Main findings: state-funded schools inspections and outcomes as at 31 August 2026
Published 10 November 2026
Applies to England

© Crown copyright 2026
This publication is licensed under the terms of the Open Government Licence v3.0 except where otherwise stated. To view this licence, visit nationalarchives.gov.uk/doc/open-government-licence/version/3 or write to the Information Policy Team, The National Archives, Kew, London TW9 4DU, or email: psi@nationalarchives.gov.uk.
Where we have identified any third party copyright information you will need to obtain permission from the copyright holders concerned.
This publication is available at https://www.gov.uk/government/statistics/state-funded-schools-inspections-and-outcomes-as-at-31-august-2026/main-findings-state-funded-schools-inspections-and-outcomes-as-at-31-august-2026
This is the main findings report for the state-funded schools inspections and outcomes as at 31 August 2026 release. The following are also available:
- underlying data
- methodology
- pre-release access list
This official statistics release covers the first year of the renewed education inspection framework (EIF), which came into effect on 10 November 2025. These statistics are published as official statistics in development. Please see the accompanying methodology for further details.
Your feedback will help us improve future publications. Please share your views by completing this survey.
Data for the previous version of the framework remain available. Statistical releases for inspections between 2019 and 2025 are available on the Ofsted statistics website. Inspections between 1 September and 9 November 2025 are available in our management information dataset as at 31 December 2025.
Summary
This release includes:
- data for inspections completed between 10 November 2025 and 31 August 2026 where the report cards were published by 30 September 2026
- schools’ most recent inspections and outcomes as at 31 August 2026
- revised data for inspections completed between 10 November 2025 and 31 March 2026
Between 10 November 2025 and 31 August 2026, we have carried out 3,262 inspections, of which 3,188 were full inspections.
The proportions of schools graded ‘expected standard’ or better for each evaluation area at a full inspection were:
- 90% for ‘inclusion’
- 78% for ‘curriculum and teaching’
- 72% for ‘achievement’
- 84% for ‘attendance and behaviour’
- 95% for ‘personal development and wellbeing’
- 85% for ‘leadership and governance’
Number of providers
There are currently 21,957 state-funded schools. Forty-six per cent of these are maintained by local authorities and 54% are academies and free schools.
Inspections carried out between 10 November 2025 and 31 August 2026
Between 10 November 2025 and 31 August 2026, we have carried out 3,262 inspections, of which 3,188 were full inspections.
Since the renewed EIF came into effect, we have carried out 3,262 inspections, comprising 3,188 full inspections and 74 monitoring inspections (13 focused monitoring inspections, 56 legacy monitoring inspections and 5 of the new-style improvement monitoring inspections).[footnote 1]
The 3,188 full inspections carried out represent only 15% of all state-funded schools, so the grade profile is not representative of all schools.
As we inspect lower-performing schools more often than high-performing schools, the mix of schools inspected in any single year is not typically representative of all schools. Of the 3,187 schools that received a full inspection this year, 17% were graded ‘requires improvement’ or ‘inadequate’ for overall effectiveness at their previous full inspection. This 17% compares with 10% of all 21,879 schools being graded ‘requires improvement’ or ‘inadequate’ at their most recent inspection in August 2024, and an estimate of 8% in August 2025.[footnote 2]
Grades at full inspections
The proportions of schools graded ‘expected standard’ or better for each evaluation area at a full inspection were:
- 90% for ‘inclusion’
- 78% for ‘curriculum and teaching’
- 72% for ‘achievement’
- 84% for ‘attendance and behaviour’
- 95% for ‘personal development and wellbeing’
- 85% for ‘leadership and governance’
In full inspections, we look at 6 core evaluation areas in all schools, and grade early years and post-16 provision where relevant.
The most common grade was ‘expected standard’: between 53% and 62% of schools received this grade across the 8 evaluation areas.
The evaluation area with the highest proportion of schools graded ‘expected standard’ or better was ‘personal development and wellbeing’ (95%), while the area with the lowest proportion was ‘achievement’ (72%).[footnote 3]
The evaluation area with the largest difference between primary and secondary schools was ‘attendance and behaviour’ (86% expected standard or better in primary schools compared with 78% in secondary schools).[footnote 4]
Figure 1 shows a breakdown of the inspection grades from the 3,188 full inspections carried out.
Figure 1: Full inspection grades by evaluation area, 10 November 2025 to 31 August 2026
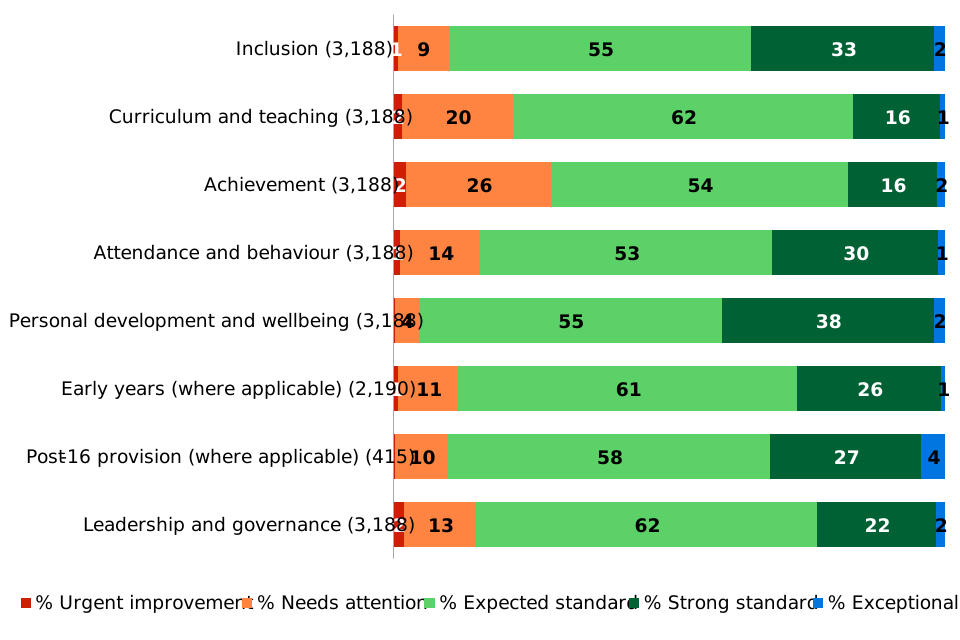
1. Percentages are rounded and may not add up to 100. For those rounded to 0, see the accessible table for these percentages to 1 decimal place.
2. Numbers of inspections are in brackets.
View data in an accessible table format.
Safeguarding standards were met in 99% of full inspections. In the 18 schools (0.6%) where safeguarding standards were not met, safeguarding was rarely the only weak aspect identified in the school. All but one of 18 schools were graded ‘urgent improvement’ for ‘leadership and governance’, and 13 were graded ‘urgent improvement’ for at least one other evaluation area too.[footnote 5]
In 37% of inspections, schools were graded either ‘urgent improvement’ or ‘needs attention’ for at least one evaluation area. In 3% of these inspections, schools were graded ‘urgent improvement’ for at least one evaluation area; in 33%, at least one evaluation area was graded ‘needs attention’ but none were graded ‘urgent improvement’.[footnote 6]
The schools that received ‘urgent improvement’ grades were placed in a category of concern (57% required special measures and 43% required significant improvement). Any school with at least one ‘urgent improvement’ or ‘needs attention’ grade will have follow-up monitoring inspections before their next full inspection.[footnote 7]
Four per cent of schools were graded ‘exceptional’ for at least one evaluation area. Eleven schools were graded ‘exceptional’ in all evaluation areas.
The relationship between grades for the different evaluation areas
Seventy-two per cent of schools received a mix of different grades across the 6 core evaluation areas.[footnote 8] Of the 28% of inspections in which the grades across all evaluation areas were the same, the most common scenario was that all 6 evaluation areas were graded ‘expected standard’ (accounting for 18% of all inspections).[footnote 9]
The evaluation areas across which the grades are most closely aligned are ‘achievement’ and ‘curriculum and teaching’ (where 81% of schools had the same grades for these 2 evaluation areas). The grades for ‘curriculum and teaching’ are also closely aligned with those for ‘leadership and governance’ (79%).
Figure 2: The proportion of full inspections carried out between 10 November 2025 and 31 August 2026 that have the same grade for each evaluation area
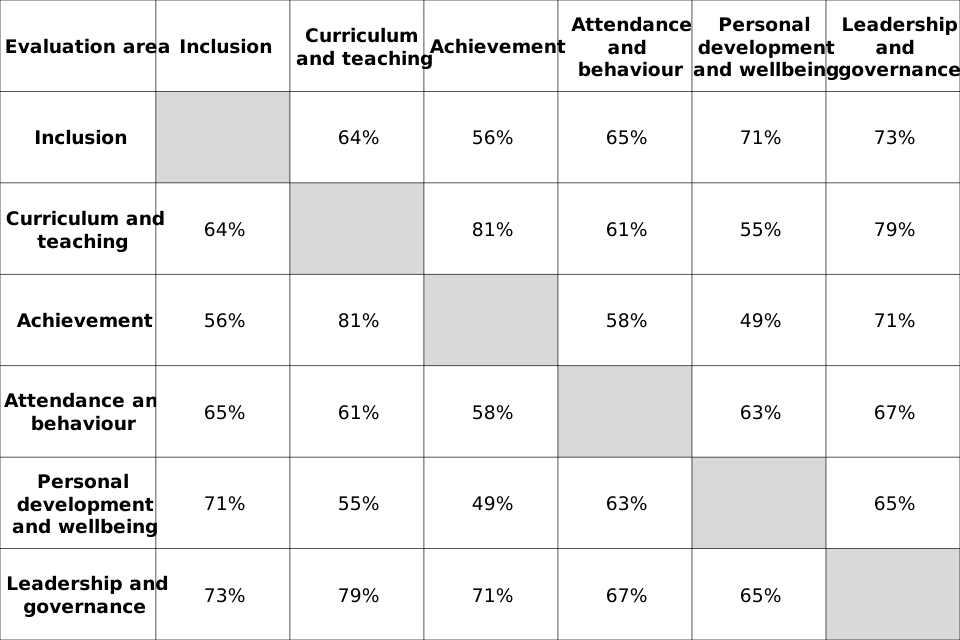
1. Each box shows the proportion of full inspections where the outcome for the evaluation area listed on the left matched that of the evaluation area listed at the top.
View data in an accessible table format.
Improvement monitoring inspections
In June 2026 we began carrying out improvement monitoring inspections under the renewed EIF. These monitoring inspections are for schools that were graded either ‘needs attention’ or ‘urgent improvement’ for any evaluation area at a previous full inspection under the renewed EIF. Unlike monitoring inspections under the original EIF, improvement monitoring inspections can result in a change to the grades of any evaluation areas that are looked at.
There are 2 different types of improvement monitoring inspections – one for schools with at least one ‘urgent improvement’ grade and one for schools with at least one ‘needs attention’ grade but no ‘urgent improvement’ grades. Monitoring inspections for schools with at least one ‘urgent improvement’ grade start sooner, typically in the term after the report for the full inspection is published. They may be carried out more regularly if required, until all evaluation areas have improved to ‘expected standard’ or better. This year we have not carried out any monitoring inspections to schools with ‘needs attention’ grades only.
Six improvement monitoring inspections carried out in June and July were published by the cut-off date for this release. All 6 were to schools with at least one ‘urgent improvement’ grade from its last full inspection (in the autumn or spring term), so the school had been placed into a category of concern.
One monitoring inspection converted to a full inspection, where all evaluation areas were graded. Previously, safeguarding standards were judged not to have been met, and at the converted inspection these were judged to have been met. Leadership and governance also improved from ‘urgent improvement’ to ‘needs attention’. The school was taken out of the category of concern.
A further 5 monitoring inspections were not deemed full inspections. These inspections considered 13 different evaluation areas previously judged either ‘urgent improvement’ or ‘needs attention’, with one improving (from ‘urgent improvement’ to ‘needs attention’).[footnote 10] Safeguarding was considered in 2 schools where it had previously been judged as ‘not met’, and in both of these it was judged as now ‘met’.
Revisions to previous release
The provisional data in the previous release related to inspections that took place between 10 November 2025 and 31 March 2026, with the reports published by 30 April 2026. Revised data for inspections in this period is provided in table 1R of this release: State-funded schools inspections and outcomes as at 31 August 2026, charts and tables.
This revised data includes an additional 496 full inspections that had not been published by 30 April 2026 but were published by 30 September 2026.
We publish revisions to data in this publication, in line with our revisions policy for official statistics.
Notes
You can find an explanation of the main uses of this data, further contextual information and the arrangements for quality assurance in the methodology report. The methodology report provides information about the strengths and limitations of the statistics.
Glossary
Definitions of terms are in the statistical glossary.
Further information
Contacts
If you are a member of the public and have any comments or feedback on this publication, please contact Louise Butler on 03000 131 457 or the schools data and analysis team at inspectioninsight@ofsted.gov.uk.
Press enquiries should be sent to our press team, at pressenquiries@ofsted.gov.uk.
Acknowledgements
Thanks to the following for their contribution to this statistical release: Chris Foley, Talan George and Matthew Spencer.
Ofsted: explore an area
For an interactive map of Ofsted school inspection outcomes in a local area see Ofsted: explore an area.
How to search
Press Ctrl + F on a Windows laptop or Command + F on a Mac.
This will open a search box in the top right-hand corner of the page. Type the word you are looking for in the search bar and press enter.
Your browser will highlight the word, usually in yellow, wherever it appears on the page. Press enter to move to the next place where it appears.
Data tables for figures
Data for Figure 1: Full inspection grades by evaluation area, 10 November 2025 to 31 August 2026
| Evaluation area | Number of inspections | % Urgent improvement | % Needs attention | % Expected standard | % Strong standard | % Exceptional |
|---|---|---|---|---|---|---|
| Inclusion | 3,188 | 1 | 9 | 55 | 33 | 2 |
| Curriculum and teaching | 3,188 | 2 | 20 | 62 | 16 | 1 |
| Achievement | 3,188 | 2 | 26 | 54 | 16 | 2 |
| Attendance and behaviour | 3,188 | 1 | 14 | 53 | 30 | 1 |
| Personal development and wellbeing | 3,188 | 0.3 | 4 | 55 | 38 | 2 |
| Early years (where applicable) | 2,190 | 1 | 11 | 61 | 26 | 1 |
| Post-16 provision (where applicable) | 415 | 0.2 | 10 | 58 | 27 | 4 |
| Leadership and governance | 3,188 | 2 | 13 | 62 | 22 | 2 |
See Figure 1.
Data for Figure 2: The proportion of full inspections carried out between 10 November 2025 and 31 August 2026 that have the same grade for each evaluation area
| Evaluation area 1 | Evaluation area 2 | Proportion where grades match |
|---|---|---|
| Inclusion | Curriculum and teaching | 64 |
| Inclusion | Achievement | 56 |
| Inclusion | Attendance and behaviour | 65 |
| Inclusion | Personal development and wellbeing | 71 |
| Inclusion | Leadership and governance | 73 |
| Curriculum and teaching | Achievement | 81 |
| Curriculum and teaching | Attendance and behaviour | 61 |
| Curriculum and teaching | Personal development and wellbeing | 55 |
| Curriculum and teaching | Leadership and governance | 79 |
| Achievement | Attendance and behaviour | 58 |
| Achievement | Personal development and wellbeing | 49 |
| Achievement | Leadership and governance | 71 |
| Attendance and behaviour | Personal development and wellbeing | 63 |
| Attendance and behaviour | Leadership and governance | 67 |
| Personal development and wellbeing | Leadership and governance | 65 |
See Figure 2.
-
Based on events carried out by 31 August 2026 where the inspection report was published by 30 September 2026. Eighty-seven additional inspections were carried out but not published by the cut-off point; see Table 1 (inspection events) of our monthly management information datasets for details of the number carried out by the end of each month.
Six improvement monitoring inspections were carried out; however, one converted to a full inspection. See the section on ‘Improvement monitoring inspections’ for more details. ↩
-
This is based on the latest overall effectiveness grades for all schools, apart from those that were inspected in 2024/25 and so did not have an overall effectiveness grade. For these, we have used the ‘quality of education’ grade instead. ↩
-
For further details on the ‘achievement’ grade and its relationship with attainment data, see our statistical commentaries The ‘achievement’ grade, attainment data and schools in challenging circumstances, May 2026 and Considering the context of schools in challenging circumstances: an analysis of similar schools data, October 2026. ↩
-
See Table 1 in the accompanying ODS file for the grades for each evaluation area broken down by phase of education. ↩
-
See Table 4 in the accompanying ODS file for further details. ↩
-
Some schools have a mixture of ‘urgent improvement’ or ‘needs attention’ grades. Out of the 100 inspections with at least one ‘urgent improvement’ grade 95 also had at least one ‘needs attention’ grade. There were an additional 1,064 inspections with at least one ‘needs attention’ grade but no ‘urgent improvement’ grades. Therefore in total 1,164 inspections resulted in the school requiring follow up monitoring inspections (37% of all full inspections) ↩
-
For details on the monitoring process see: School monitoring operating guide for inspectors, August 2026. ↩
-
The 6 core evaluation areas exclude early years and sixth-form provision, which are only graded in schools with the relevant age group. ↩
-
See Table 7a in the accompanying ODS file for further details. ↩
-
See Table 5 in the accompanying ODS file for further details. ↩