State-funded schools inspections and outcomes as at 31 August 2018
Updated 21 September 2020

© Crown copyright 2020
This publication is licensed under the terms of the Open Government Licence v3.0 except where otherwise stated. To view this licence, visit nationalarchives.gov.uk/doc/open-government-licence/version/3 or write to the Information Policy Team, The National Archives, Kew, London TW9 4DU, or email: psi@nationalarchives.gov.uk.
Where we have identified any third party copyright information you will need to obtain permission from the copyright holders concerned.
This publication is available at https://www.gov.uk/government/statistics/state-funded-schools-inspections-and-outcomes-as-at-31-august-2018/state-funded-schools-inspections-and-outcomes-as-at-31-august-2018
This release contains:
- schools’ most recent inspections and outcomes as at 31 August 2018
- provisional data for inspections completed between 1 April and 31 August 2018
- revised data for inspections completed between 1 September 2017 and 31 March 2018
86% of schools are good or outstanding.
At the end of August 2018, we had judged 86% of schools good or outstanding at their most recent inspection, similar to the proportion at the end of August 2017.
Inspection outcomes continue to be higher for primary schools compared to secondary schools.
Outcomes continue to be higher for primary schools (87% good or outstanding) compared to secondary schools (75%).
67% of the exempt outstanding schools inspected this year declined.
Outstanding primary and secondary schools are exempt from routine inspections but can be inspected if we have concerns. 67% of those inspected this year declined.
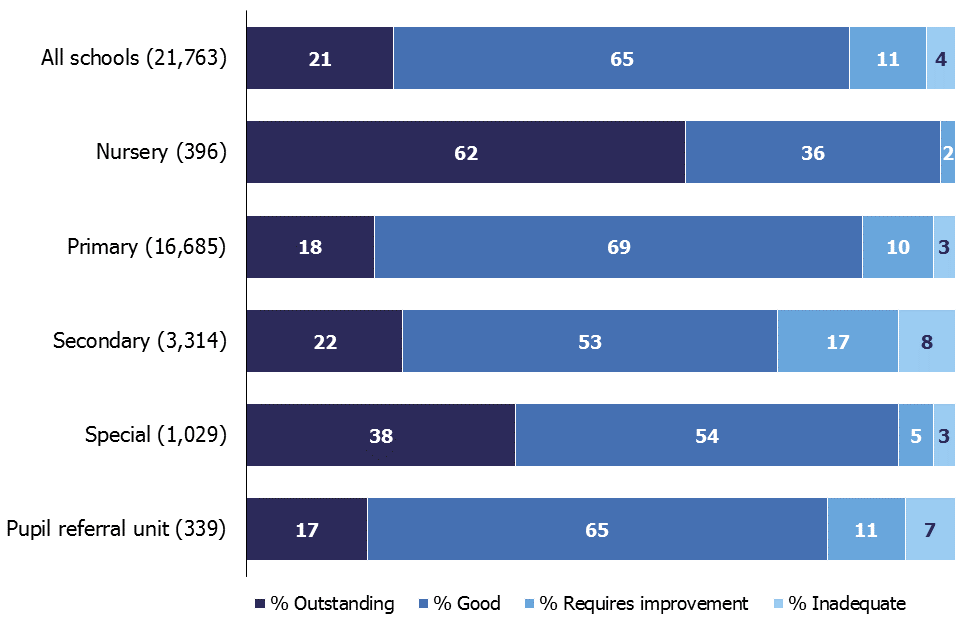
Figure 1: Overall effectiveness of state-funded schools at their most recent inspection
1. Introduction
The purpose of these official statistics is to disseminate the data on school standards collected through Ofsted’s role as an inspectorate. They provide information about how the judgements of schools have changed over time and vary across different phases of education and different parts of the country.
This official statistics release reports on the outcomes of state-funded school inspections carried out under sections 5 or 8 of the Education Act 2005. These inspections were carried out between 1 September 2017 and 31 August 2018. This release also includes the most recent inspections and outcomes for all schools that have been inspected, as at 31 August 2018.
Following a consultation, this release contains some changes to the way in which we report on schools’ most recent inspection grades. See the consultation and an analysis of the responses.
Throughout this release, the term ‘schools’ is used to cover all local authority maintained schools, state-funded academies and non-maintained special schools in England that Ofsted is required to inspect under section 5 of the Education Act 2005.
2. Inspections between 1 September 2017 and 31 August 2018
This year we carried out 6,889 visits to schools.[footnote 1] Inspections are carried out under a range of legal powers and for a variety of different reasons. For instance, we carried out:
- 2,466 full inspections, leading to graded inspection judgements, including:
- 849 full inspections of schools previously judged to be inadequate or to require improvement
- 542 full inspections of new academies that were having their first inspection as the new school
- 3,977 short inspections of schools previously judged to be good or outstanding (including 312 that became full inspections)
- 149 visits to outstanding primary and secondary schools, which are exempt from routine inspection, but which we visited because we had some concerns[footnote 2]
- 651 monitoring visits[footnote 3]
Of the 2,466 full inspections, 7% of schools were outstanding, 47% were good, 37% were judged to require improvement and 9% were inadequate.
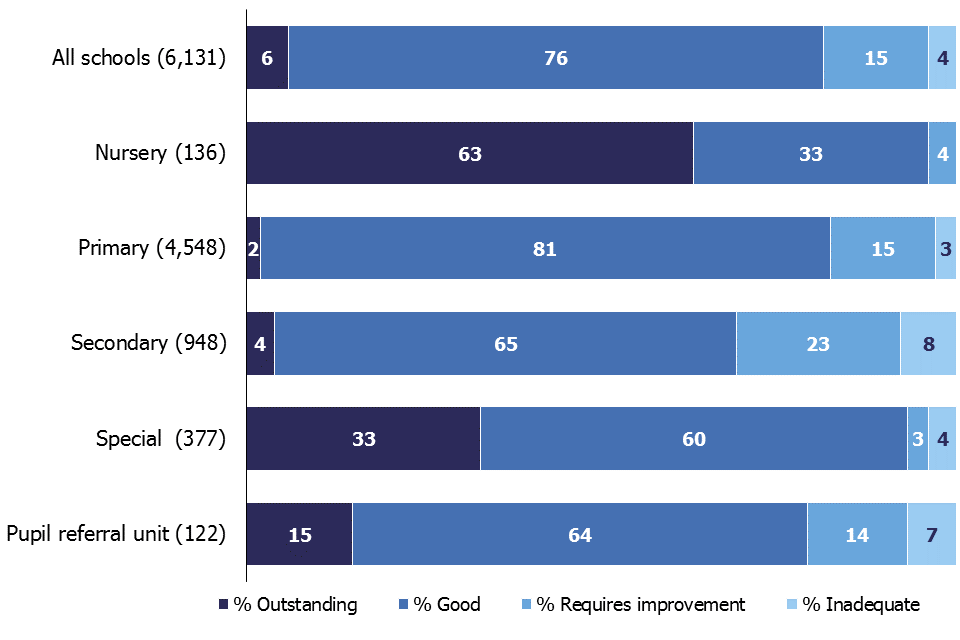
Where a short inspection did not convert to a full inspection, the school maintained its previous grade of good or outstanding. Where these outcomes are included alongside the outcomes for full inspections, the overall mix of grades seen this year is much more positive. Six per cent of schools were found to be outstanding, 76% were good, 15% were judged to require improvement and 4% were inadequate.
Figure 2: Overall effectiveness of schools inspected this year (including short inspections that did not convert)
2.1 Inspections of schools previously judged to be good
In September 2015, we introduced short inspections for schools that were judged good at their most recent full inspection. Short inspections last for one day and take place approximately every 4 years. A short inspection determines whether the school continues to provide a good standard of education for the pupils and whether safeguarding is effective. Following 2 consultations in 2017[footnote 4], in the 2017 to 2018 academic year we introduced 2 further changes to the way we inspect good schools.
In November 2017, we began using risk assessment to select some good schools for full inspections instead of short inspections. When a risk assessment suggests that it would be highly likely for a short inspection to convert to a full one to gather more evidence, we arrange that full inspection from the start. This happens in approximately 1 in 5 inspections of good primary and secondary schools due for inspection in the year.
In January 2018, we made a change that reduced the proportion of short inspections that converted immediately. If a school was previously good, an inspection will now only convert if the lead inspector has serious concerns about safeguarding, behaviour or the quality of education to the extent that the school might be judged inadequate at a full inspection.
In 76% of cases, the short inspection confirms that the school remains good and we schedule a further section 8 inspection for approximately 4 years’ time. When inspectors believe that the school may have improved to outstanding or declined from good if it had been a full inspection, we schedule a full inspection for 1 to 2 years’ time (see the section 8 school inspection handbook). Before January 2018, these short inspections would have converted immediately.
These changes in policy have led to a substantial decrease in the proportion of short inspections that convert to a full inspection. Since January 2018 less than 1% of short inspections of good schools have converted to a full inspection. This is down from 22% between September and December 2017, and 29% in 2016 to 2017. This is in line with the intentions explained in the consultation.
Overall, across all types of schools we inspected 4,832 previously good schools this year, either through a full or a short inspection. Eighty-three per cent maintained their good grade, 2% improved to outstanding, and 15% declined to requires improvement or inadequate. The changes to the way we inspect these schools mean that it is not possible to accurately compare the outcomes this year with those from previous years.
2.2 Inspections of schools previously judged to be outstanding
There are currently 4,498 schools judged outstanding at their most recent inspection, including 3,805 primary and secondary schools. As part of the 2011 Education Act, the government made outstanding primary and secondary schools exempt from routine inspections. This means that we have been unable to carry out regular inspections of these schools. As a result, 17% of outstanding primary and secondary schools have not had a full inspection in the last 10 academic years.
We are still able to inspect exempt outstanding schools if their performance gives cause for concern. We have inspected 48% of these schools within the last 6 academic years. We have inspected 149 of these schools this year. Of those schools that had their inspection converted to a full inspection, only 7 kept their outstanding grade, 55 declined to good, 35 declined to requires improvement and 10 declined to inadequate. The remaining 42 schools did not have a full inspection and remained outstanding.
Overall, 67% of the exempt schools visited this year declined from their previously outstanding grade. However, this is not surprising because most of the exempt schools inspected were those whose performance appeared to be declining.
3. Schools at their most recent inspection
By the end of August 2018, we had judged 86% of schools good or outstanding at their most recent inspection. There was little change from the position at the end of August 2017 (87%). Outcomes continue to be higher for primary schools (87% good or outstanding) compared to secondary schools (75%).
There was a minor reduction in the overall proportion of schools judged good or outstanding at their most recent inspection at the end of August 2018 (86%) compared with the end of August 2017 (87%). The actual change was just over 1 percentage point (1.2 percentage points). While the overall change is very small, a slight fall was seen across each of the phases (between -0.3 and -2.8 percentage points per phase). Several factors may have contributed to this pattern.
Of the 1,495 schools that were previously good or outstanding and had a full inspection this year, 761 declined to requires improvement or inadequate. Of the 849 schools inspected that were previously requires improvement or inadequate, 496 improved to good or outstanding. The difference between the sizes of these groups of schools is the main contributory factor in explaining the minor reduction in the proportion of schools judged good or outstanding at their most recent inspection.
We carried out a smaller number of inspections of schools that require improvement this year. This is largely due to a smaller number of inspections of these schools being due in 2017 to 2018. The number of inspections of schools previously judged to require improvement in 2017 to 2018 was just over half that of 2016 to 2017 – 624 compared to 1,166.
In 2017 to 2018 we carried out more inspections of schools that were previously judged outstanding or good compared to 2016 to 2017 (5,160 full and short inspections this year compared to 3,895 last year). A slightly larger number of these schools declined to requires improvement or inadequate this year than last year (761 compared to 713). The policy changes made this year (see previous section) mean that the proportion of schools that declined is not comparable over time. However the increase in the overall number of schools that declined this year has contributed to the change in the overall proportion of schools at different grades.
4. Changes to our methodology for statistical reporting
In June 2018, following a consultation, we changed the way we report on inspection outcomes in our statistical datasets. The main change was to include the grades of schools that had since become academies in our statistics and analysis. These are called ‘predecessor schools’.
By including the inspection outcomes of around 700 more schools, our data is now more comprehensive and transparent. We have also back-dated the changes for previous years, so that we can still compare the quality of the sector over time (see historical datasets).
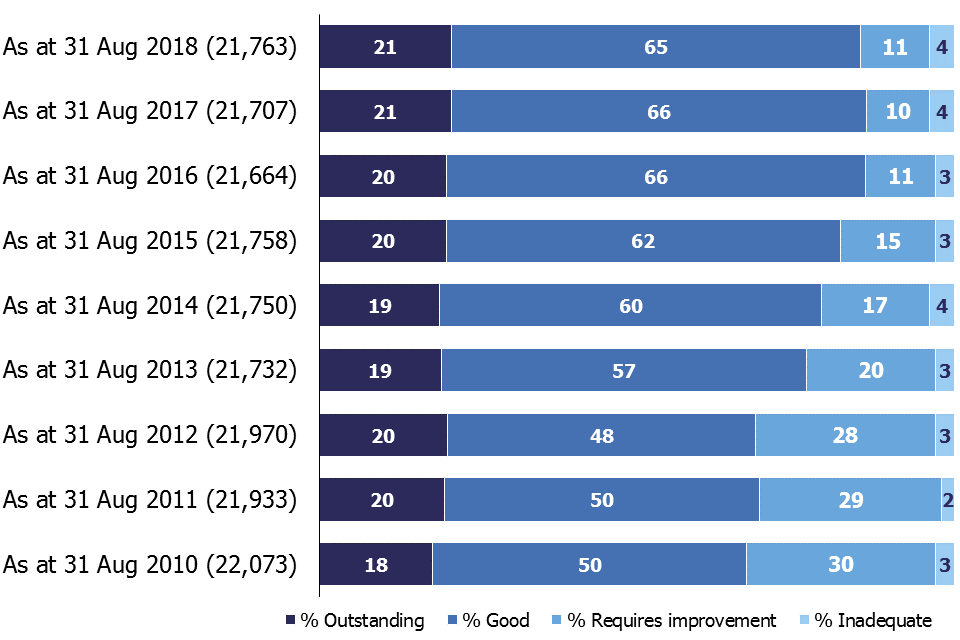
The revised data shows a similar trend to that seen before we made these changes. The sector has improved substantially since 2010, when only 68% of schools were good or outstanding.
Figure 3: Most recent inspection outcomes of all state-funded schools, 2010 to 2018
5. Pupil referral units and alternative provision
Alternative provision is a diverse and complex sector, some of which is not regulated. It includes:
-
education arranged by local authorities for pupils who, because of exclusion, illness or other reasons, would not otherwise receive suitable education
-
education arranged by schools for pupils on a fixed period exclusion
-
schools sending pupils to off-site provision to improve their behaviour (see ‘Alternative provision’ guidance from the Department for Education).
Alternative provision may be provided by:
-
pupil referral units (PRUs) maintained by local authorities
-
alternative provision academies and free schools
-
registered independent schools
-
unregistered independent schools
-
charities and other organisations
We inspect 353 state-funded pupil referral units and alternative provision schools. Two-thirds of these are pupil referral units run by local authorities, and a third are academies[footnote 5], including 40 free schools. Almost three-quarters of the academies and free schools are part of a multi-academy trust (MAT).
Together these state-funded schools educate 16,732 children and young people aged 2 to 19 plus. Forty per cent of these pupils are eligible for and claiming free school meals. Eighty-eight per cent of the pupils are aged between 11 and 15 (see ‘Schools, pupils and their characteristics: January 2018’, Table 1B).
5.1 Inspection outcomes for state-funded pupil referral units and alternative provision academies and free schools
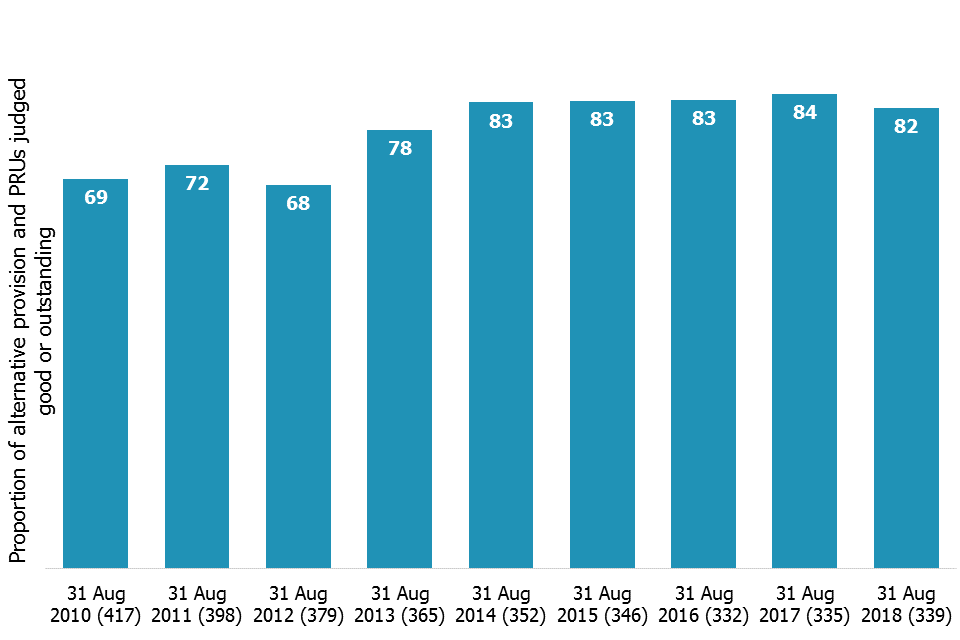
Eighty-two per cent of all state-funded PRUs and alternative provision academies and free schools were judged to be good or outstanding at their most recent inspection. This is a small reduction from 84% in August 2017.[footnote 6] Prior to this year, since 2010 there had been a general trend of improvement in the proportion of good or outstanding pupil referral units. There had also been a general trend of decreasing numbers of providers until the last 2 years when numbers rose very slightly.
Figure 4: Proportion of state-funded pupil referral units and alternative provision academies and free schools judged good and outstanding at their most recent inspection, 2010 to 2018
6. Revisions to previous release
The provisional data in the previous release related to inspections that took place between 1 September 2017 and 31 March 2018, with the reports published by 30 April 2018. Revised data for inspections in this period is provided in table 1R and 2R of the Excel file accompanying this release.
This revised data includes an additional 81 full inspections that had not been published by 30 April but were published by 30 September 2018. Thirty-four resulted in an inadequate judgement, 18 requires improvement, 27 were good and 2 were outstanding.
The inclusion of these inspections results in the following changes to the proportion of all schools at each grade between September 2017 and March 2018:
- the percentage good has been revised down from 47% to 46%
- the percentage requires improvement has been revised down from 38% to 37%
- the percentage inadequate has been revised up from 8% to 10%
Forty-two of the additional inspections were of primary schools. As a result the percentage judged inadequate has been revised up from 7% to 8%.
Twenty five were of secondary schools. As a result:
- the percentage outstanding has been revised down from 7% to 6%
- the percentage good have been revised down from 45% to 44%
- the percentage requires improvement have been revised down from 38% to 37%
- the percentage inadequate has been revised up from 10% to 13%
Thirteen were of special schools. As a result:
- the percentage outstanding has been revised down from 35% to 31%
- the percentage good has been revised down from 42% to 41%
- the percentage requires improvement has been revised down from 15% to 12%
- the percentage inadequate has been revised up from 8% to 16%
One was of a pupil referral unit:
- the percentage outstanding has been revised up from 4% to 7%
- the percentage good has been revised down from 46% to 45%
- the percentage requires improvement has been revised down from 32% to 31%
- the percentage inadequate has been revised down from 18% to 17%
Revisions to data in this publication are published in line with Ofsted’s revisions policy for official statistics.
7. Notes
Inspections are conducted under sections 5 and 8 of the Education Act 2005. The inspection framework was most recently revised on 1 September 2015. Ofsted introduced a common inspection framework for all settings on the Early Years Register, state-funded schools, non-association independent schools and further education and skills providers. An explanation of the main uses of this data, further contextual information and the arrangements for quality assurance is provided in the methodology. This report provides information about strengths and limitations of the statistics.
8. Glossary
8.1 Academies
Academies are publicly funded independent schools. Academies do not have to follow the national curriculum and can set their own term times. They still have to follow the same rules on admissions, special educational needs and exclusions as other state schools.
Academies get money directly from the government, not the local authority. They are run by an academy trust, which employs the staff. Some academies have sponsors such as businesses, universities, other schools, faith groups or voluntary groups. Sponsors are responsible for improving the performance of their schools.
Academies include converter and sponsor-led academies, free schools, university technical colleges and studio schools.
8.2 Academy converters
Academy converters are schools which have opted to become an academy, most of which were good or outstanding local authority maintained schools before they became an academy.
Academy converters retain their latest inspection grade, even if the most recent inspection was of the predecessor school.
8.3 Sponsor-led academies
Sponsor-led academies are academies which have sponsors such as businesses, universities, other schools, faith groups or voluntary groups. Sponsors are responsible for improving the performance of their schools.
Sponsor-led academies are viewed as new legal entities and do not retain their inspection history.
8.4 Free schools
Free schools are funded by the government and are not run by the local authority. They are set-up on a not-for-profit basis by charities, universities, and community and faith groups, among others.
Free schools are ‘all-ability’ schools, so cannot use academic selection processes like a grammar school. They can set their own pay and conditions for staff and change the length of school terms and the school day. Free schools do not have to follow the national curriculum.
8.5 Local authority maintained schools
Maintained schools are funded by the government and run by the local authority. They must follow the national curriculum.
8.6 Short inspections
Most good schools now receive short inspections, as do outstanding nursery, pupil referral units and special schools. Short inspections are a one-day inspection visit and take place approximately every four years. A short inspection determines whether the school continues to provide the same good or outstanding standard of education for pupils. A short inspection does not result in individual graded judgements nor does it change the overall effectiveness grade of the school. If the school shows significant decline, a short inspection is converted to a full inspection, where inspectors will make the full set of graded judgements required under section 5.
From November 2017, around 20% of previously good schools are now subject to a full section 5 inspection instead of a short inspection, where our risk assessment tells us that a short inspection would be highly likely to convert. For example where a school underwent significant change, such as changing its age range, or where the quality of provision may have deteriorated significantly.
From January 2018 short inspections are only converted to a full inspection where there are serious concerns. Where a short inspection does not convert, there are additional outcomes where the school remains either good or outstanding but the next inspection will be a section 5 inspection.
Findings from our forthcoming Annual Report will be published on 4 December 2018.
If you have any comments or feedback on this publication, please contact Louise Butler on 03000 131 457 or inspection.insight@ofsted.gov.uk.
8.7 Acknowledgements
Thanks to the following for their contribution to this statistical release: Oli Bayntun, James Jordan, Jay Kerai, and Clair Simpson.
-
Includes all types of inspections conducted under sections 5 and 8 of the Education Act 2005. A section 8 visit may be deemed a section 5 visit and become a full inspection, which lasts for longer and results in a graded set of inspection judgements. Note the list of events that follow are not mutually exclusive, so do not add to the total of 6,889 inspections. ↩
-
Most inspections of exempt schools are carried out because the school’s performance appears to be declining. However, some are also due to complaints we receive about the schools, or because the school has substantially changed since it was judged to be outstanding (for instance, it has taken on another key stage or merged with another school). ↩
-
Monitoring visits to schools where most recent overall effectiveness was requires improvement or inadequate. ↩
-
Short inspections of good schools and Short inspections of good schools: maintained schools and academies. ↩
-
Since September 2012, any need for new, registered alternative provision is required to be met through the establishment of AP free schools. Local authority PRUs were also invited to convert to become AP academies. ↩
-
August 2017 figure is based on the revised methodology ‘Changes to Ofsted’s statistical reporting of inspection outcomes for state-funded schools: an analysis of the changes’, Ofsted, June 2018. ↩