Smoking profile: statistical commentary, October 2026
Published 6 October 2026
Applies to England

© Crown copyright 2026
This publication is licensed under the terms of the Open Government Licence v3.0 except where otherwise stated. To view this licence, visit nationalarchives.gov.uk/doc/open-government-licence/version/3 or write to the Information Policy Team, The National Archives, Kew, London TW9 4DU, or email: psi@nationalarchives.gov.uk.
Where we have identified any third party copyright information you will need to obtain permission from the copyright holders concerned.
This publication is available at https://www.gov.uk/government/statistics/smoking-profile-october-2026-update/smoking-profile-statistical-commentary-october-2026
What’s new
New data has been added to the smoking profile on the Fingertips platform for:
- smoking prevalence indicators from the Annual Population Survey (APS) updated with 2025 data
- stop smoking services indicators updated with 2025 to 2026 data
Updated indicators are available at local authority and integrated care board (ICB) level, as well as for England, the regions and various inequality groups. Updated indicators are listed in the updated indicators section below.
Introduction
The smoking prevalence figures included in this commentary are from the APS. The APS is the most widely used survey for estimating smoking prevalence in England and provides a consistent time series for smoking prevalence from 2011 onwards.
Main findings
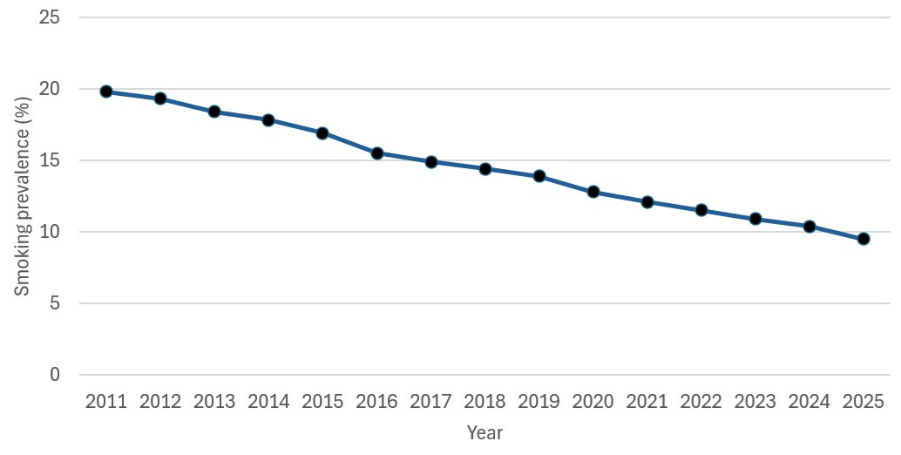
The proportion of adults in England who smoke has halved since 2011. One in 5 adults smoked in 2011 but by 2025 this was 1 in 10.
In 2025, 9.5% of adults aged 18 and over smoked. This is the first time smoking prevalence in England has been less than 10% and is a reduction from 10.4% in 2024. This continues the general downward trend that has been seen since 2011 (19.8%).
In 2025, 11.1% of men smoked compared with 8.0% of women. The absolute gap between men and women narrowed from 4.6 percentage points in 2011 to 3.1 percentage points in 2025.
The prevalence of adults who used to smoke (ex-smokers) in 2025 was 26.4%. The prevalence of those who had never smoked was 64.1%.
Figure 1: prevalence of current smokers (aged 18 and over), England, 2011 to 2025
Source: APS
Prevalence estimates from the APS are also available for 3-year periods as these provide more robust estimates for sub-national areas. For regions in England, the prevalence of current smokers in 2023 to 2025 was highest in Yorkshire and the Humber (11.8%) and lowest in the South East (9.3%). The prevalence of current smokers at district and unitary local authority level ranged from 19.7% in South Holland (East Midlands) to 3.3% in Mole Valley (South East). The prevalence of current smokers at ICB level ranged from 13.5% in NHS Black Country ICB to 7.1% in NHS Surrey Heartlands ICB.
The prevalence of current smokers in 2023 to 2025 was highest in the most deprived tenth of small (lower super output area (LSOA)) areas (19.4%) and lowest in the least deprived tenth (4.7%).
The prevalence of current smokers in the routine and manual occupation group (aged 18 to 64) in 2023 to 2025 was 17.9%, a decrease from 23.3% in 2019 to 2021. The absolute gap between the routine and manual occupation group and the managerial and professional group narrowed from 14.4 percentage points in 2019 to 2021 to 11.3 percentage points in 2023 to 2025.
The odds of being a current smoker in the routine and manual group in 2023 to 2025 were double (2.1 times) the odds of being a current smoker in other occupational groups. The odds ratio quantifies the difference in smoking prevalence between those in routine and manual occupations and those in other occupations.
Background and further information
The smoking profile provides information on the extent of smoking and its related harm, and measures being taken to reduce this harm at a local level. The aim of the profile is to assess the effect of smoking on local populations. The indicators in the smoking profile were selected following consultation with stakeholders and a review of the availability of routine data. The profile is part of a series of products by the Office for Health Improvement and Disparities (OHID) that provide local data alongside national comparisons to support local health improvement.
The tool allows you to compare your local authority against other local authorities in the region and benchmark your local authority against the England or regional average. For enquiries or feedback relating to the smoking profile, email pha-ohid@dhsc.gov.uk.
Updated indicators
The following indicators have been updated:
- smoking prevalence in adults (aged 18 and over) - current smokers (APS)
- smoking prevalence in adults (aged 18 and over) - ex-smokers (APS)
- smoking prevalence in adults (aged 18 and over) - never smoked (APS)
- smoking prevalence among adults aged 18 to 64 in routine and manual occupations (APS)
- odds of smoking among adults aged 18 to 64 with a routine and manual occupation compared with those in other occupations (APS)
- proportion of local smoking population referred to stop smoking services
- proportion of local smoking population who set a quit date
- proportion of those setting a quit date who successfully quit smoking
- proportion of local smoking population who successfully quit smoking
- cost per smoking quitter
- smoking prevalence in adults (aged 18 and over) admitted to treatment for substance misuse (National Drug Treatment Monitoring System (NDTMS) data) - alcohol