Smart meters in Great Britain, quarterly update June 2026: statistical bulletin
Published 27 August 2026
Applies to England, Scotland and Wales

© Crown copyright 2026
This publication is licensed under the terms of the Open Government Licence v3.0 except where otherwise stated. To view this licence, visit nationalarchives.gov.uk/doc/open-government-licence/version/3 or write to the Information Policy Team, The National Archives, Kew, London TW9 4DU, or email: psi@nationalarchives.gov.uk.
Where we have identified any third party copyright information you will need to obtain permission from the copyright holders concerned.
This publication is available at https://www.gov.uk/government/statistics/smart-meters-in-great-britain-quarterly-update-june-2026/smart-meters-in-great-britain-quarterly-update-june-2026-statistical-bulletin
This report includes an update from all large energy suppliers in the market in Great Britain at the end of June 2026, with data from small suppliers up to end 2025.
This report includes a range of changes to support users, as well as being the first in this series to be published in HTML format. In addition to data on installations of smart meters replacing non-smart meters, we now also include installations replacing smart meters since 2022 (the period for which we have reliable data) to provide a more complete view of total installation activity. All data from previous reports, as well as new data points in this report are included in revised supporting tables. These now use a Tidy Standard long form data set (to facilitate easier analysis by users, including with agentic AI or statistical coding packages) alongside a simplified set of tables presenting data in the main report.
At the end of June 2026 there were 42 million smart and advanced meters in homes and small businesses across Great Britain, making up 72% of all meters. Of the 40 million smart meters, 92% were operating in smart mode. This means they are communicating remotely with the customer’s energy supplier. Table 1 gives a breakdown of meters operated by large energy suppliers at the end of June 2026, and those operated by small energy suppliers at the end of December 2025 (the latest data available).
Breakdown of energy meters by type, end June 2026
Large and small energy suppliers, domestic and non-domestic
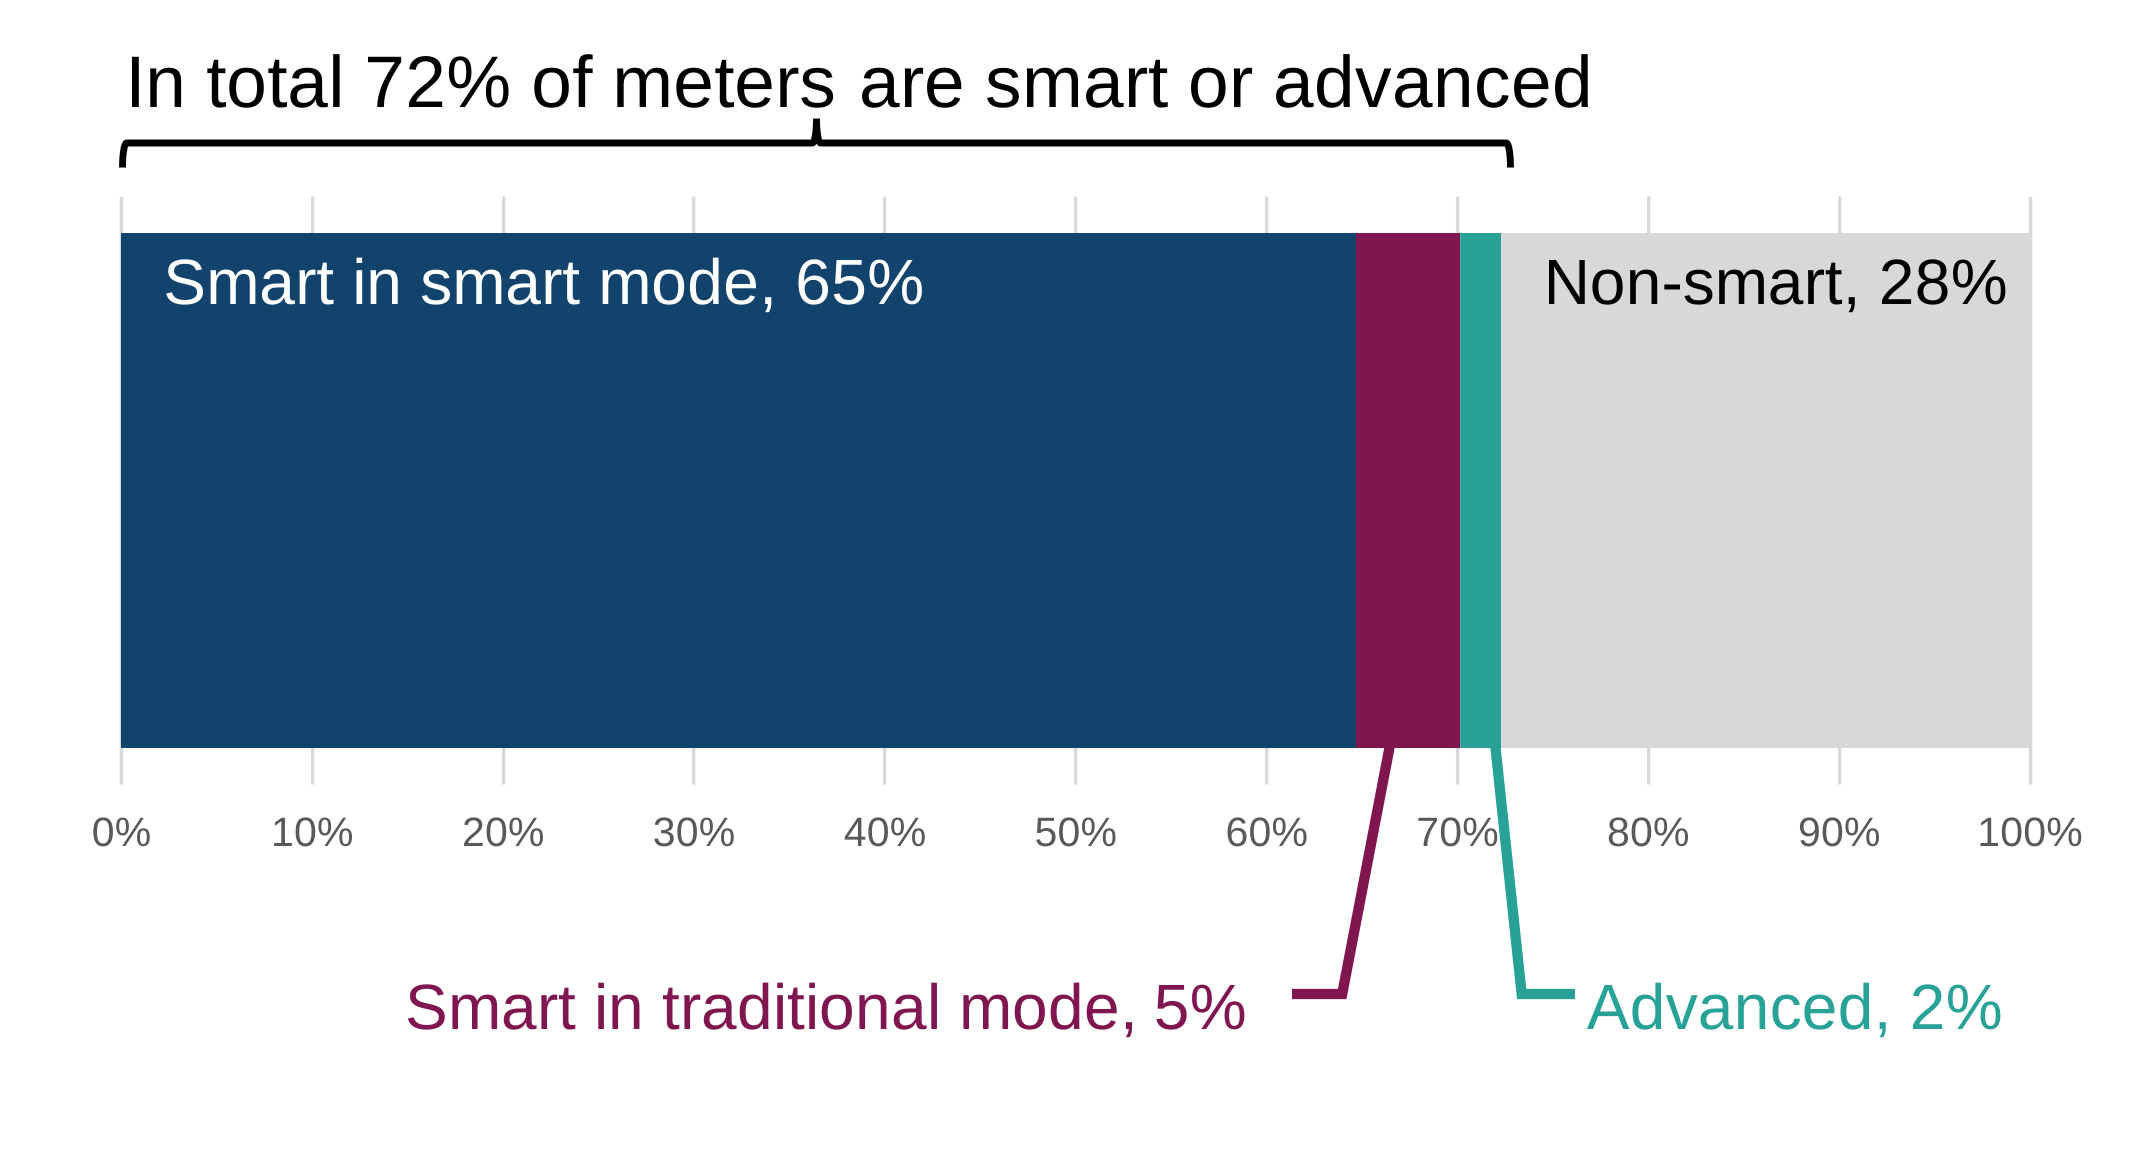
Table 1: Meters operating to end June 2026
Domestic and non-domestic, rounded to nearest thousand
| Large Suppliers (June 2026) | Small Suppliers (December 2025) | Total | |
|---|---|---|---|
| Smart meters in smart mode | 36,732,000 | 453,000 | 37,185,000 |
| Smart meters in traditional mode | 3,082,000 | 52,000 | 3,133,000 |
| Advanced meters | 719,000 | 520,000 | 1,239,000 |
| Non-smart meters | 15,513,000 | 428,000 | 15,941,000 |
| All Meters | 56,046,000 | 1,453,000 | 57,498,000 |
Between April and June 2026 1.1 million smart and advanced meters were installed by large suppliers in homes and small businesses across Great Britain. Table 2 shows the breakdown by smart and advanced meters.
Of these 525,000 were new installations, which we reported on previously, and 570,000 were replacements, which we are now publishing for the first time to provide a more complete view of total installation activity. New installations are where a smart or advanced meter is installed in a new metering point or replaces a non-smart meter. Replacements are carried out to ensure continuation of smart services where an existing smart or advanced meter has been installed. This includes when meters have reached the end of their operational life, or to ensure they are compatible with the latest communications technology.
Table 2: Smart and advanced meters installed by large energy suppliers by installation type in Q2 2026
Domestic and non-domestic, rounded to nearest thousand
| New Installations | Replacements | Total | |
|---|---|---|---|
| Smart | 521,000 | 568,000 | 1,089,000 |
| Advanced | 4,000 | 2,000 | 6,000 |
| Total | 525,000 | 570,000 | 1,095,000 |
What you need to know about these statistics:
This quarterly release provides statistics on smart meters in Great Britain. It covers the number of smart meters installed in domestic and smaller non-domestic properties by large energy suppliers in Q2 2026, as well as the total number of meters they operated on 30 June 2026. It also includes installation activity by small energy suppliers during 2025 and the number of meters they operated at the end of 2025.
Smart meters are a major national infrastructure upgrade that help make the energy system cheaper, cleaner and more reliable. They give consumers real‑time information on energy use via an In-Home Display, helping them manage consumption, save money and cut emissions. Smart meters send readings automatically to suppliers, improving billing accuracy, and support the transition to a low‑carbon system by enabling tools such as smart tariffs and better demand management.
The programme is led by the Department for Energy Security & Net Zero, regulated by Ofgem, and delivered by energy suppliers.
This publication (data to June 2026) is the first presented in a revised HTML format. It is the first release to also include data for installations where a smart meter replaced an existing smart meter back to 2022. The supporting tables have also been updated, presenting the data as Tidy Format data sets, which support summary tables showing the information in the graphics in the report.
The next quarterly release is scheduled for 26 November 2026.
1. Meters in Domestic Properties
1.1 Meters installed in domestic properties
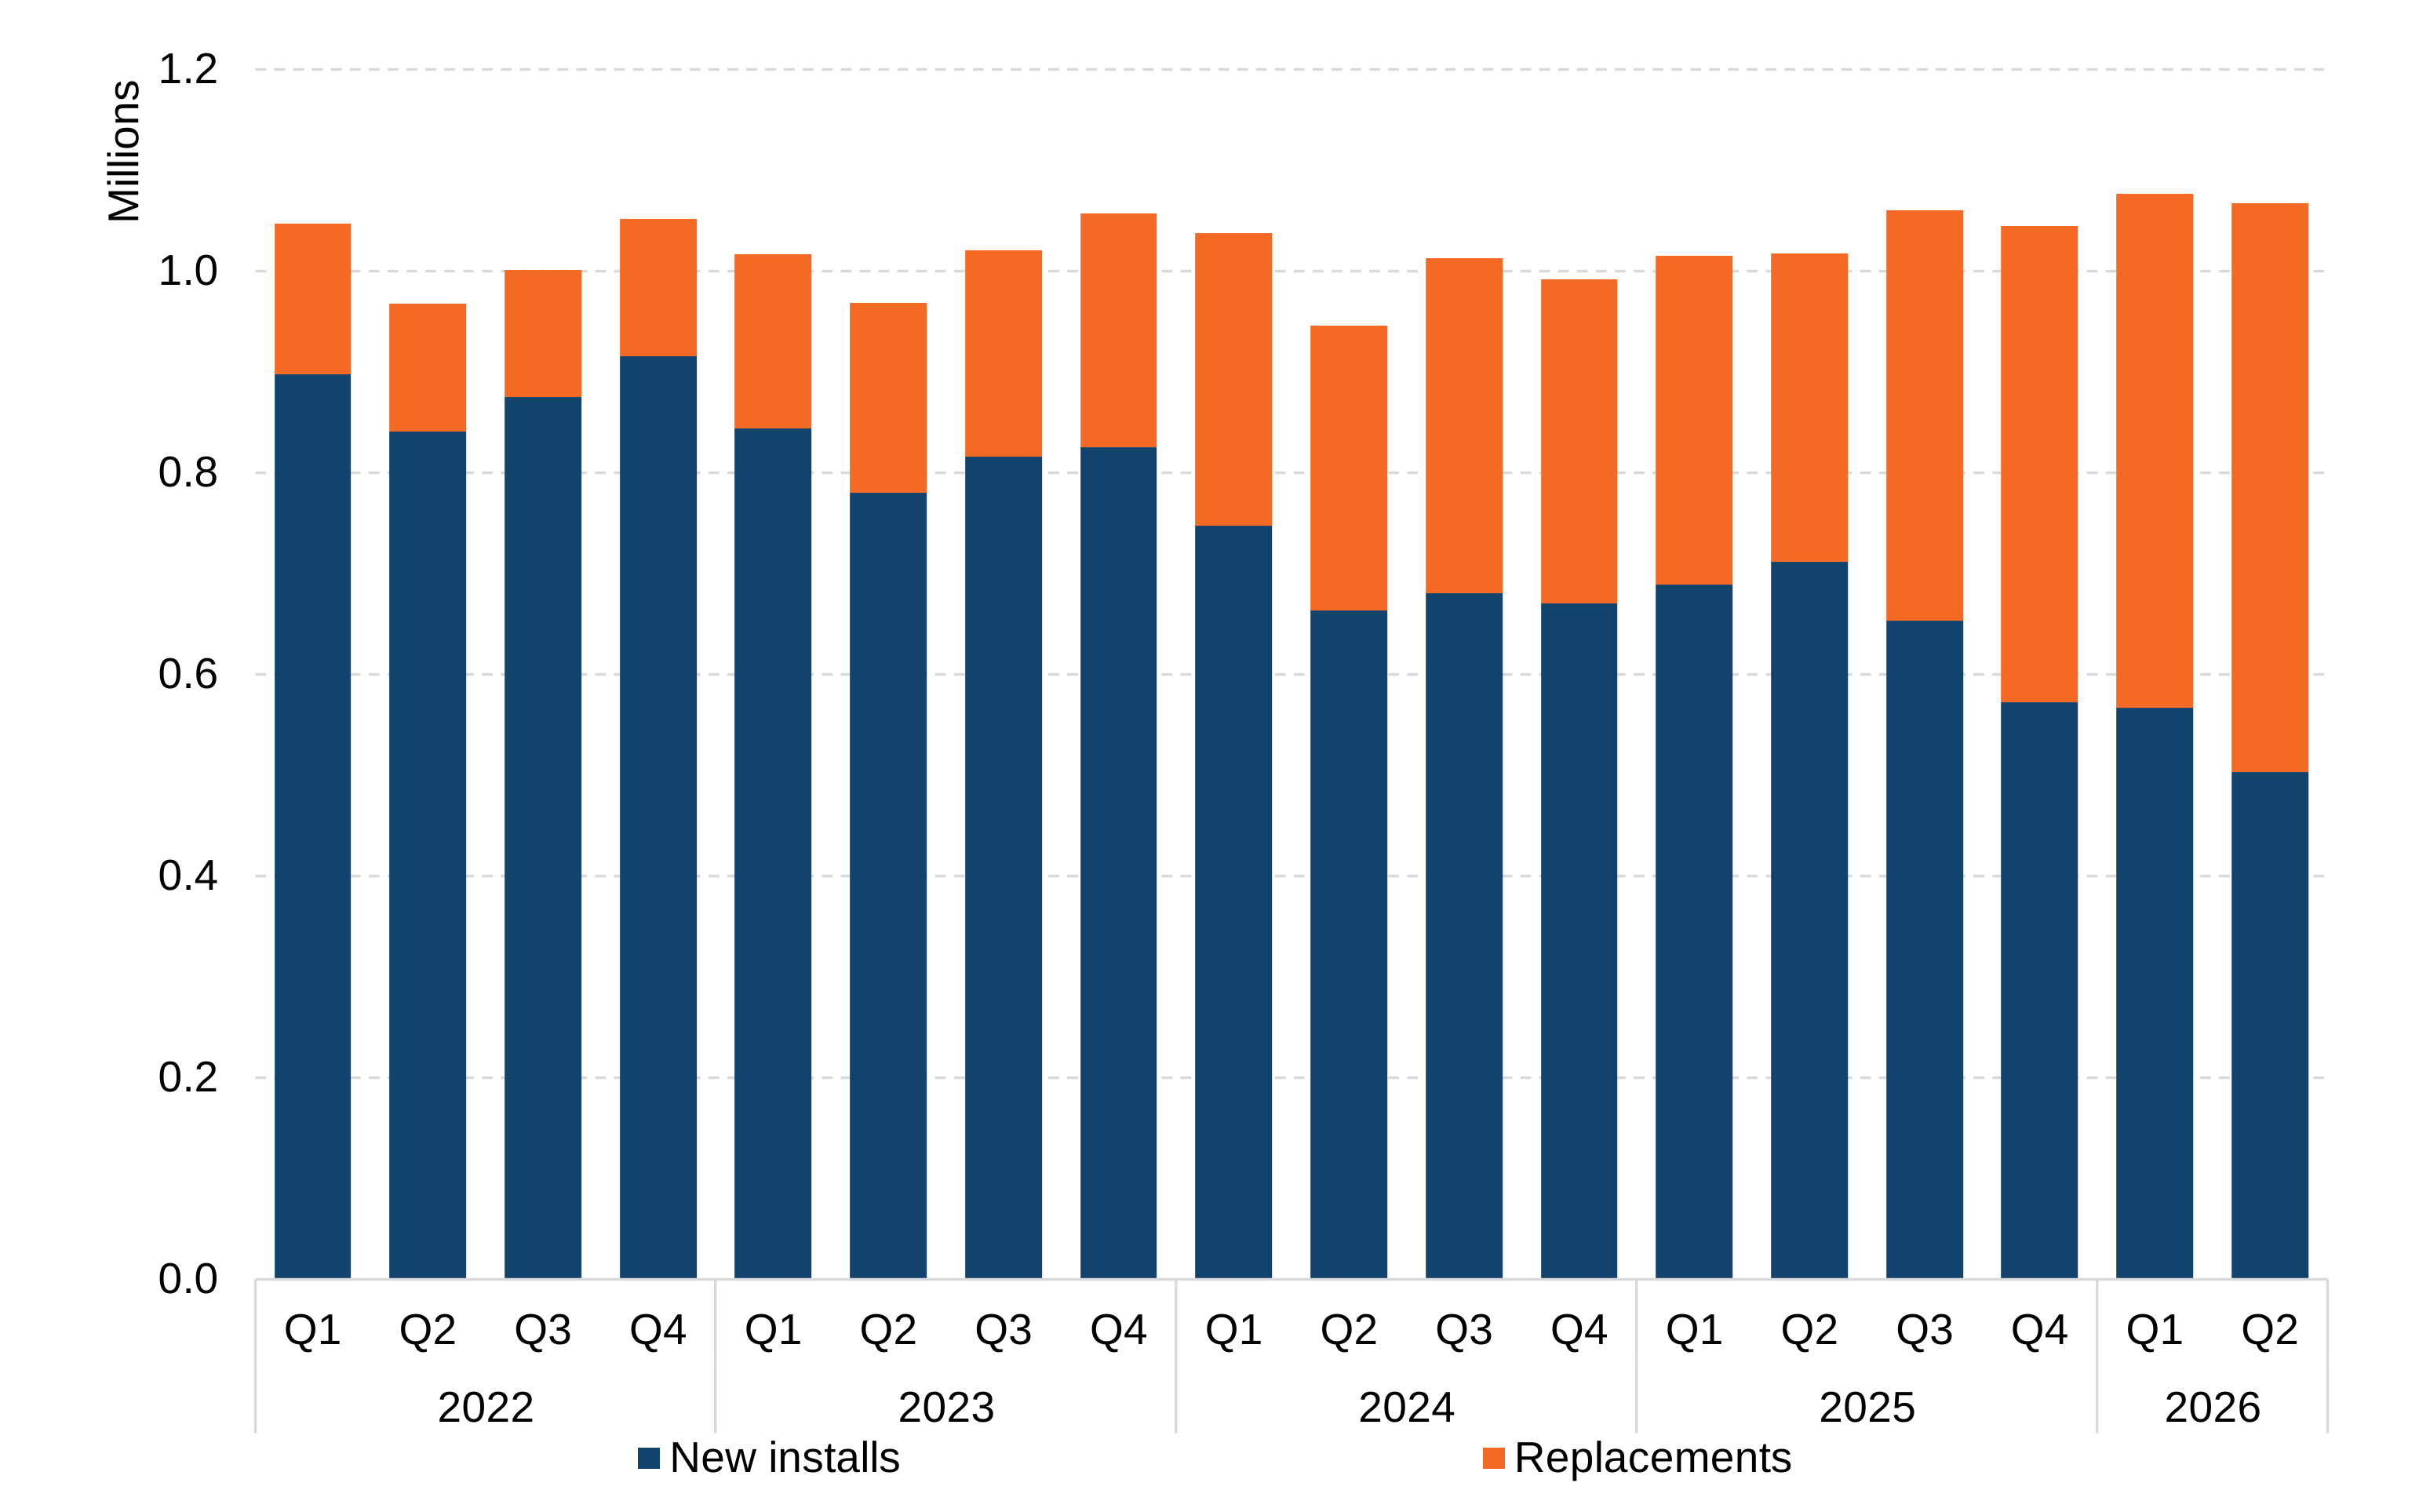
Large energy suppliers carried out 1,067,000 installations in homes during Q2 (April to June) 2026, of which 503,000 were new installations, with the remaining 564,000 being replacements. Quarterly domestic installation activity by large energy suppliers over recent years is shown in Figure 1. This shows that overall domestic installation volumes have been consistent since 2022 at approximately 1.0 million installations a quarter (we have reliable replacements data from 2022). However, the mix between new installations and replacements has shifted from 14% of all installations being replacements in Q1 2022 to 30% in Q2 2025 and then 53% in Q2 2026. Replacements are carried out to ensure continuation of smart services where an existing smart or advanced meter has been installed. This includes when meters have reached the end of their operational life, or to ensure they are compatible with the latest communications technology.
Total installation volume is down 0.9% compared to Q1 2026, and up 4.3% compared to Q2 2025.
During Q2 2026, smart meters were installed in 2.0% of all domestic metering sites operated by large suppliers, 0.9% replacing non-smart meters, and 1.0% replacing smart meters. Of the 15 million non-smart meters operating at the end of March 2026 3.3% were replaced by smart meters during Q2 2026. Of the 39 million smart meters operated by large suppliers at the end of March 2026 1.5% were replaced during Q2 2026.
Figure 1: Domestic smart meter installations carried out by large energy suppliers in Great Britain from 2022
1.2 Operational meters in domestic properties
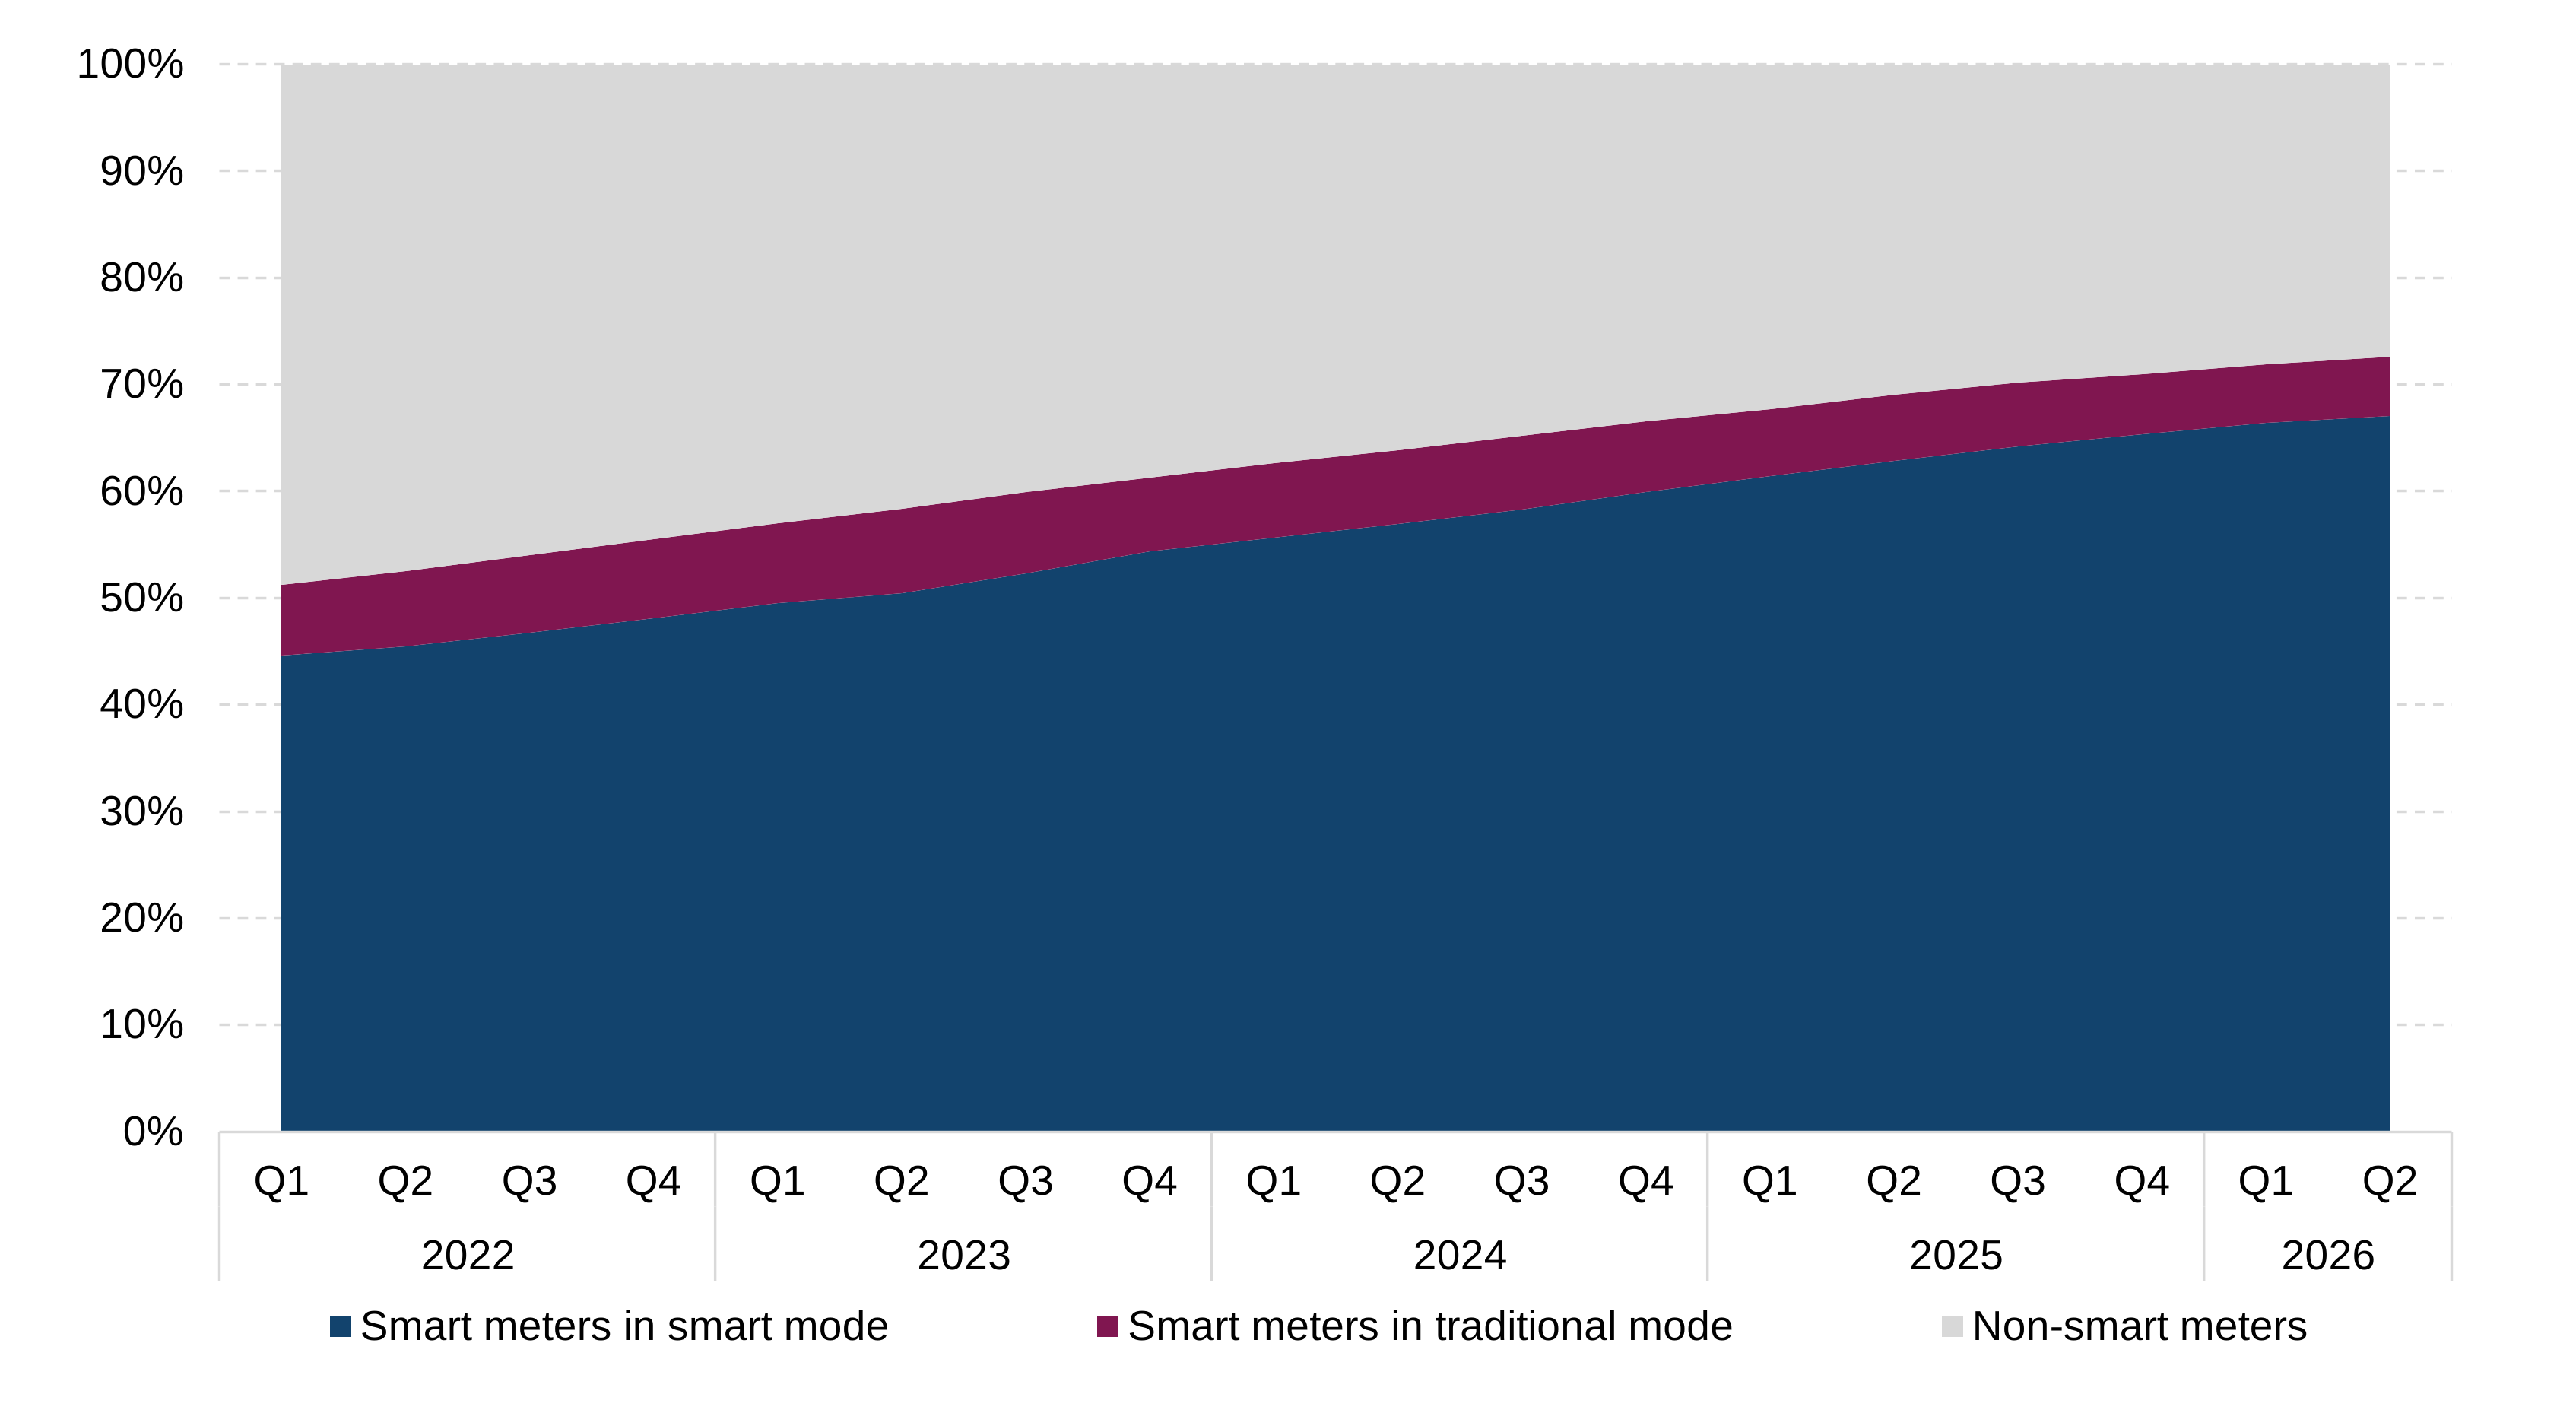
Large energy suppliers operate over 99% of all domestic energy meters, with the remaining 0.7% operated by small energy suppliers (who report data once a year). At the end of June 2026, large energy suppliers operated 39 million smart meters in domestic properties for both electricity and gas (of which 92% were operating in smart mode). They also operated 15 million non-smart meters, therefore 73% of all meters operated by large energy suppliers were smart. Total domestic meters operated by large energy suppliers over recent years is shown in Figure 2.
The proportion of domestic properties with a smart meter can be approximated by smart electricity meter coverage (while not all households are connected to the gas grid, all have access to electricity). Three quarters (75%) of properties have a smart electricity meter (comprising of 71% with one in smart mode and 3.8% with one in traditional mode). The remaining 25% of homes have a non-smart electricity meter. Over half of homes (57%) have a smart gas meter (of these 50% are operating in smart mode, 6.4% in traditional mode). In addition, 25% of homes have a non-smart gas meter and the remaining 18% have no gas meter.
Figure 2: Domestic energy meters operated by large energy suppliers in Great Britain from 2022
2. Meters in smaller non-domestic sites
The non-domestic energy retail market, as well as non-domestic energy metering, differs from the domestic market in several ways:
- In the non-domestic market small energy suppliers (who report data once a year) provide energy to approximately a third of all metering points, compared to 0.7% for domestic.
- Only a quarter of non-domestic meters are gas meters, compared to approximately 45% for domestic.
- In some circumstances non-domestic customers may have advanced meters installed, rather than smart meters.
2.1 Meters installed in smaller non-domestic sites
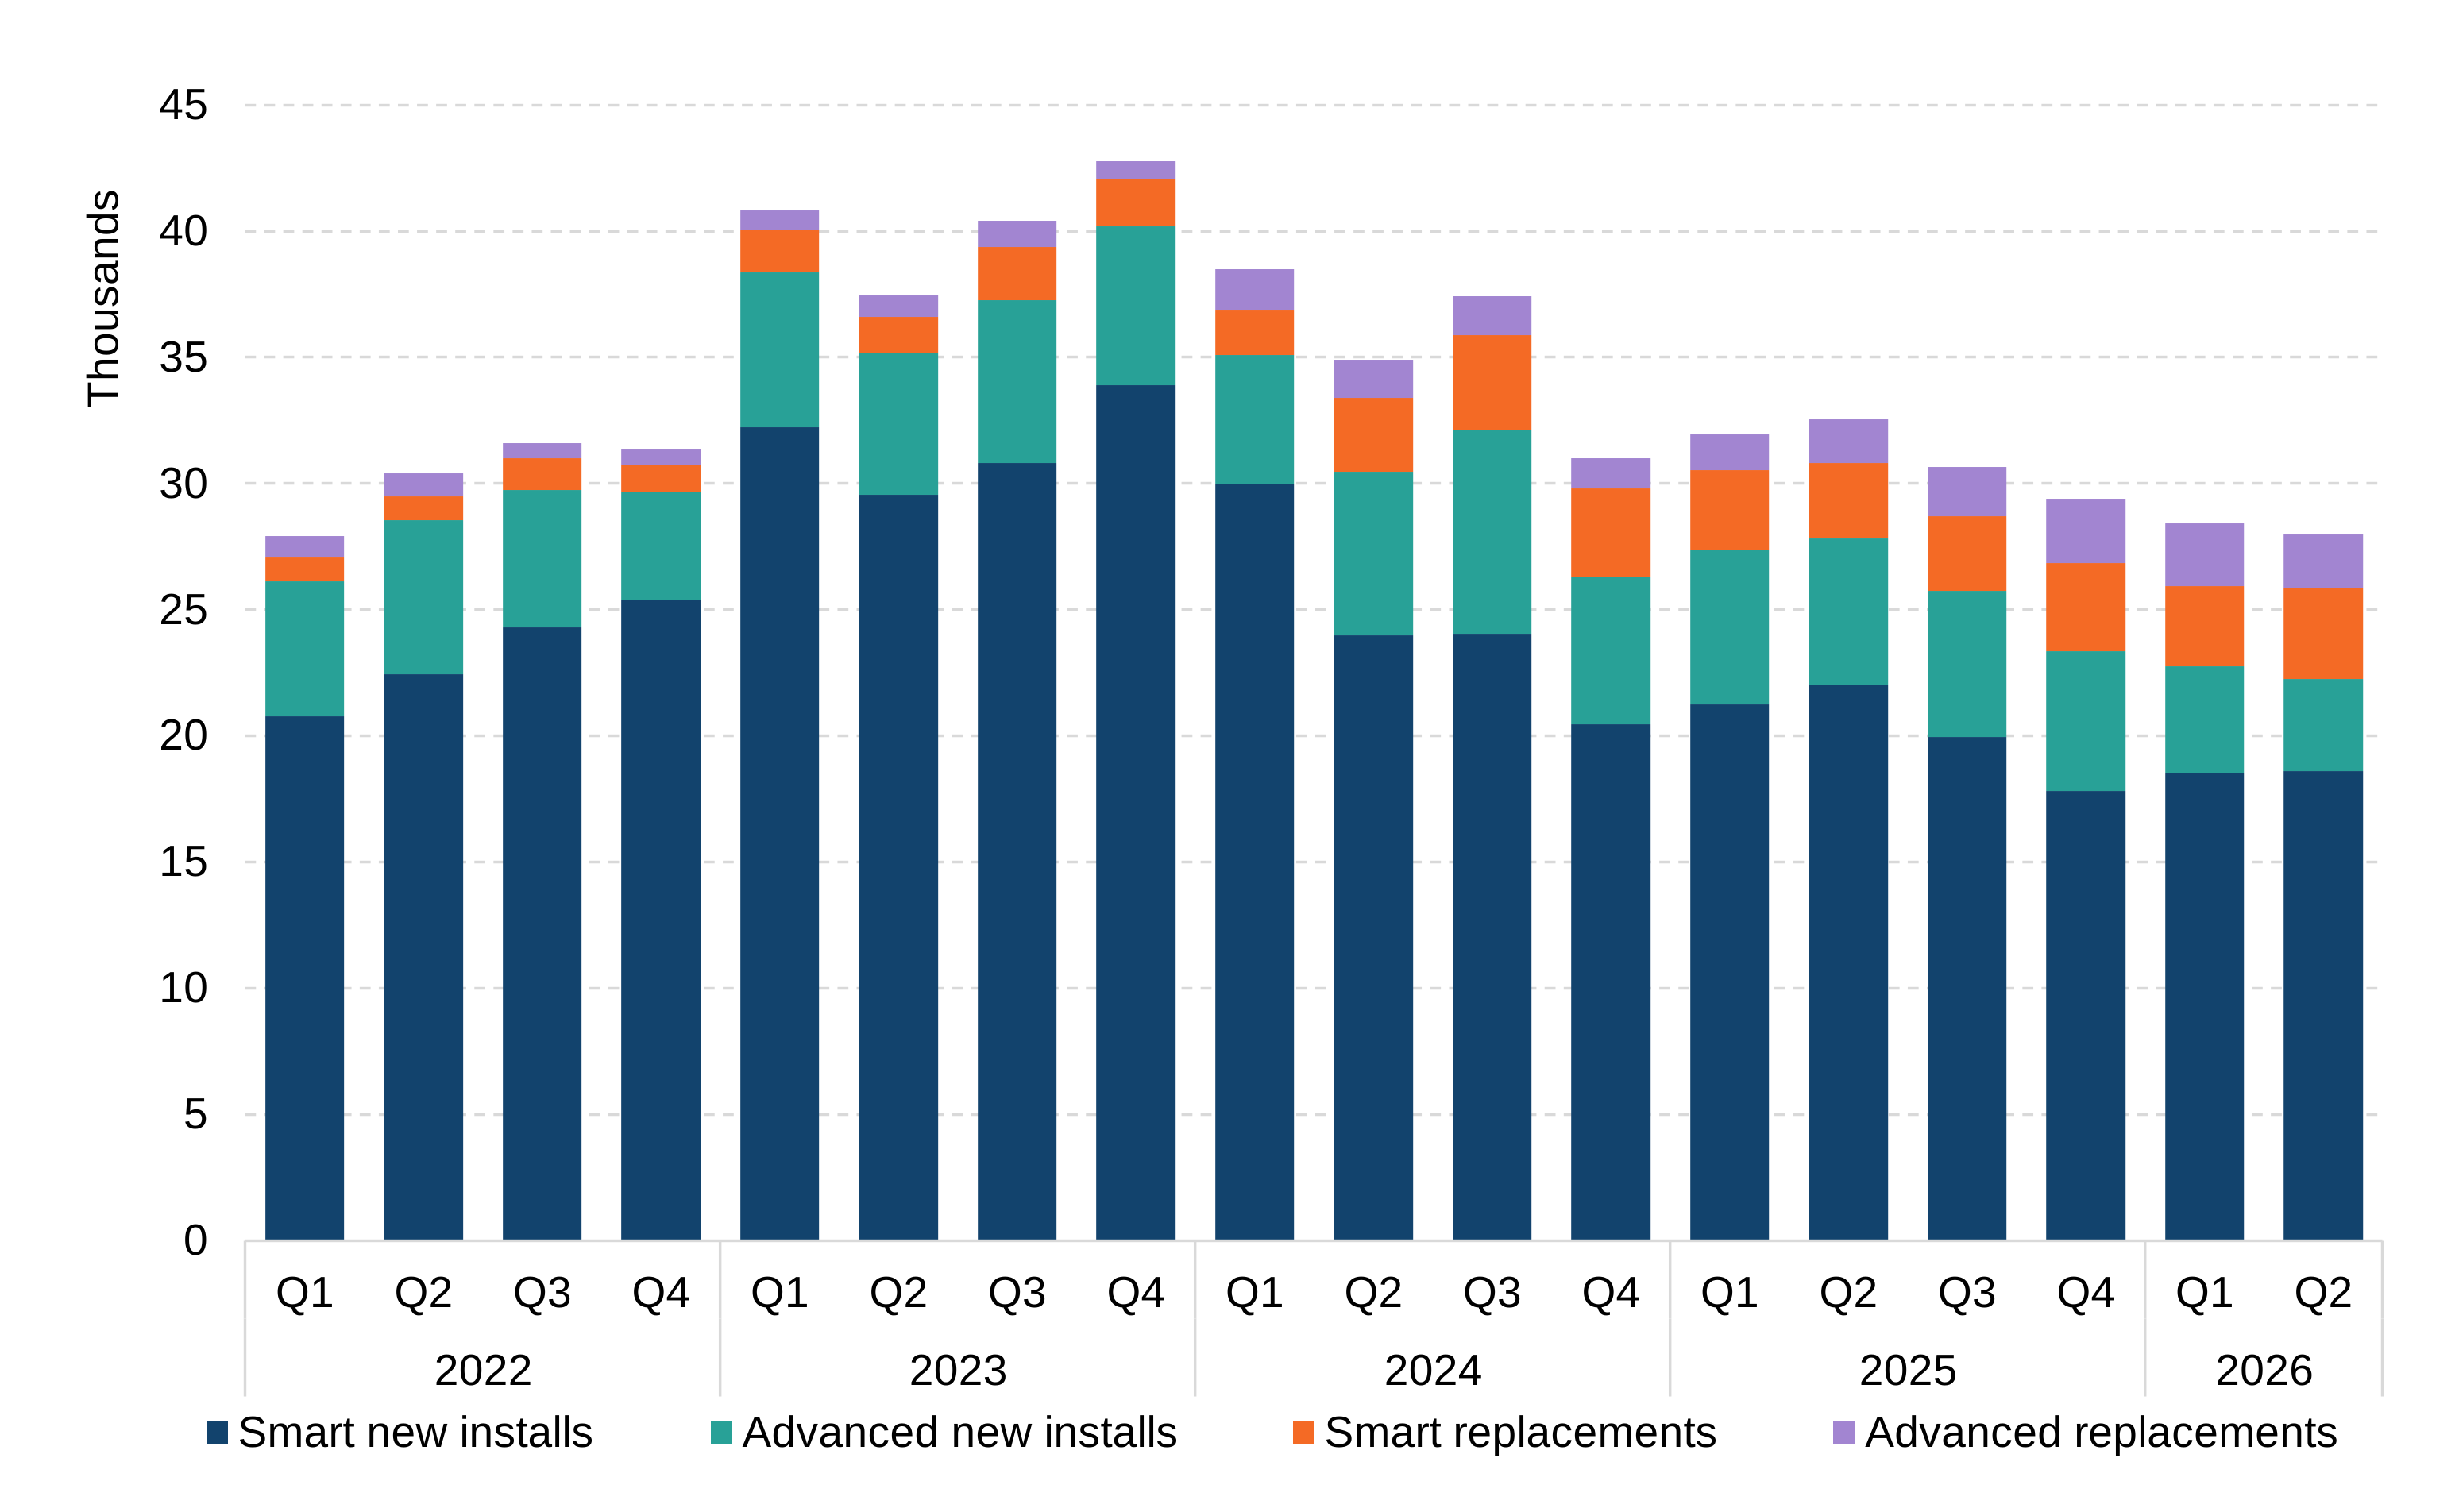
Large energy suppliers carried out 28,000 installations at smaller non-domestic sites during Q2 2026; of these 22,000 were smart meters and 6,000 were advanced meters. Of the total number of installations, 22,000 were new installations and 6,000 were replacements. Quarterly non-domestic installation activity by large energy suppliers over recent years is shown in Figure 3. Total installation volume is down 1.5% compared to Q1 2026 and down 14% compared to Q2 2025. The proportion of installations that are replacements is 20%, unchanged compared to Q1 2026 and an increase from 6.5% in Q1 2022.
Figure 3: Quarterly smart meter installations carried out by large energy suppliers at smaller non-domestic sites in Great Britain since 2022
2.3 Operational meters in smaller non-domestic sites
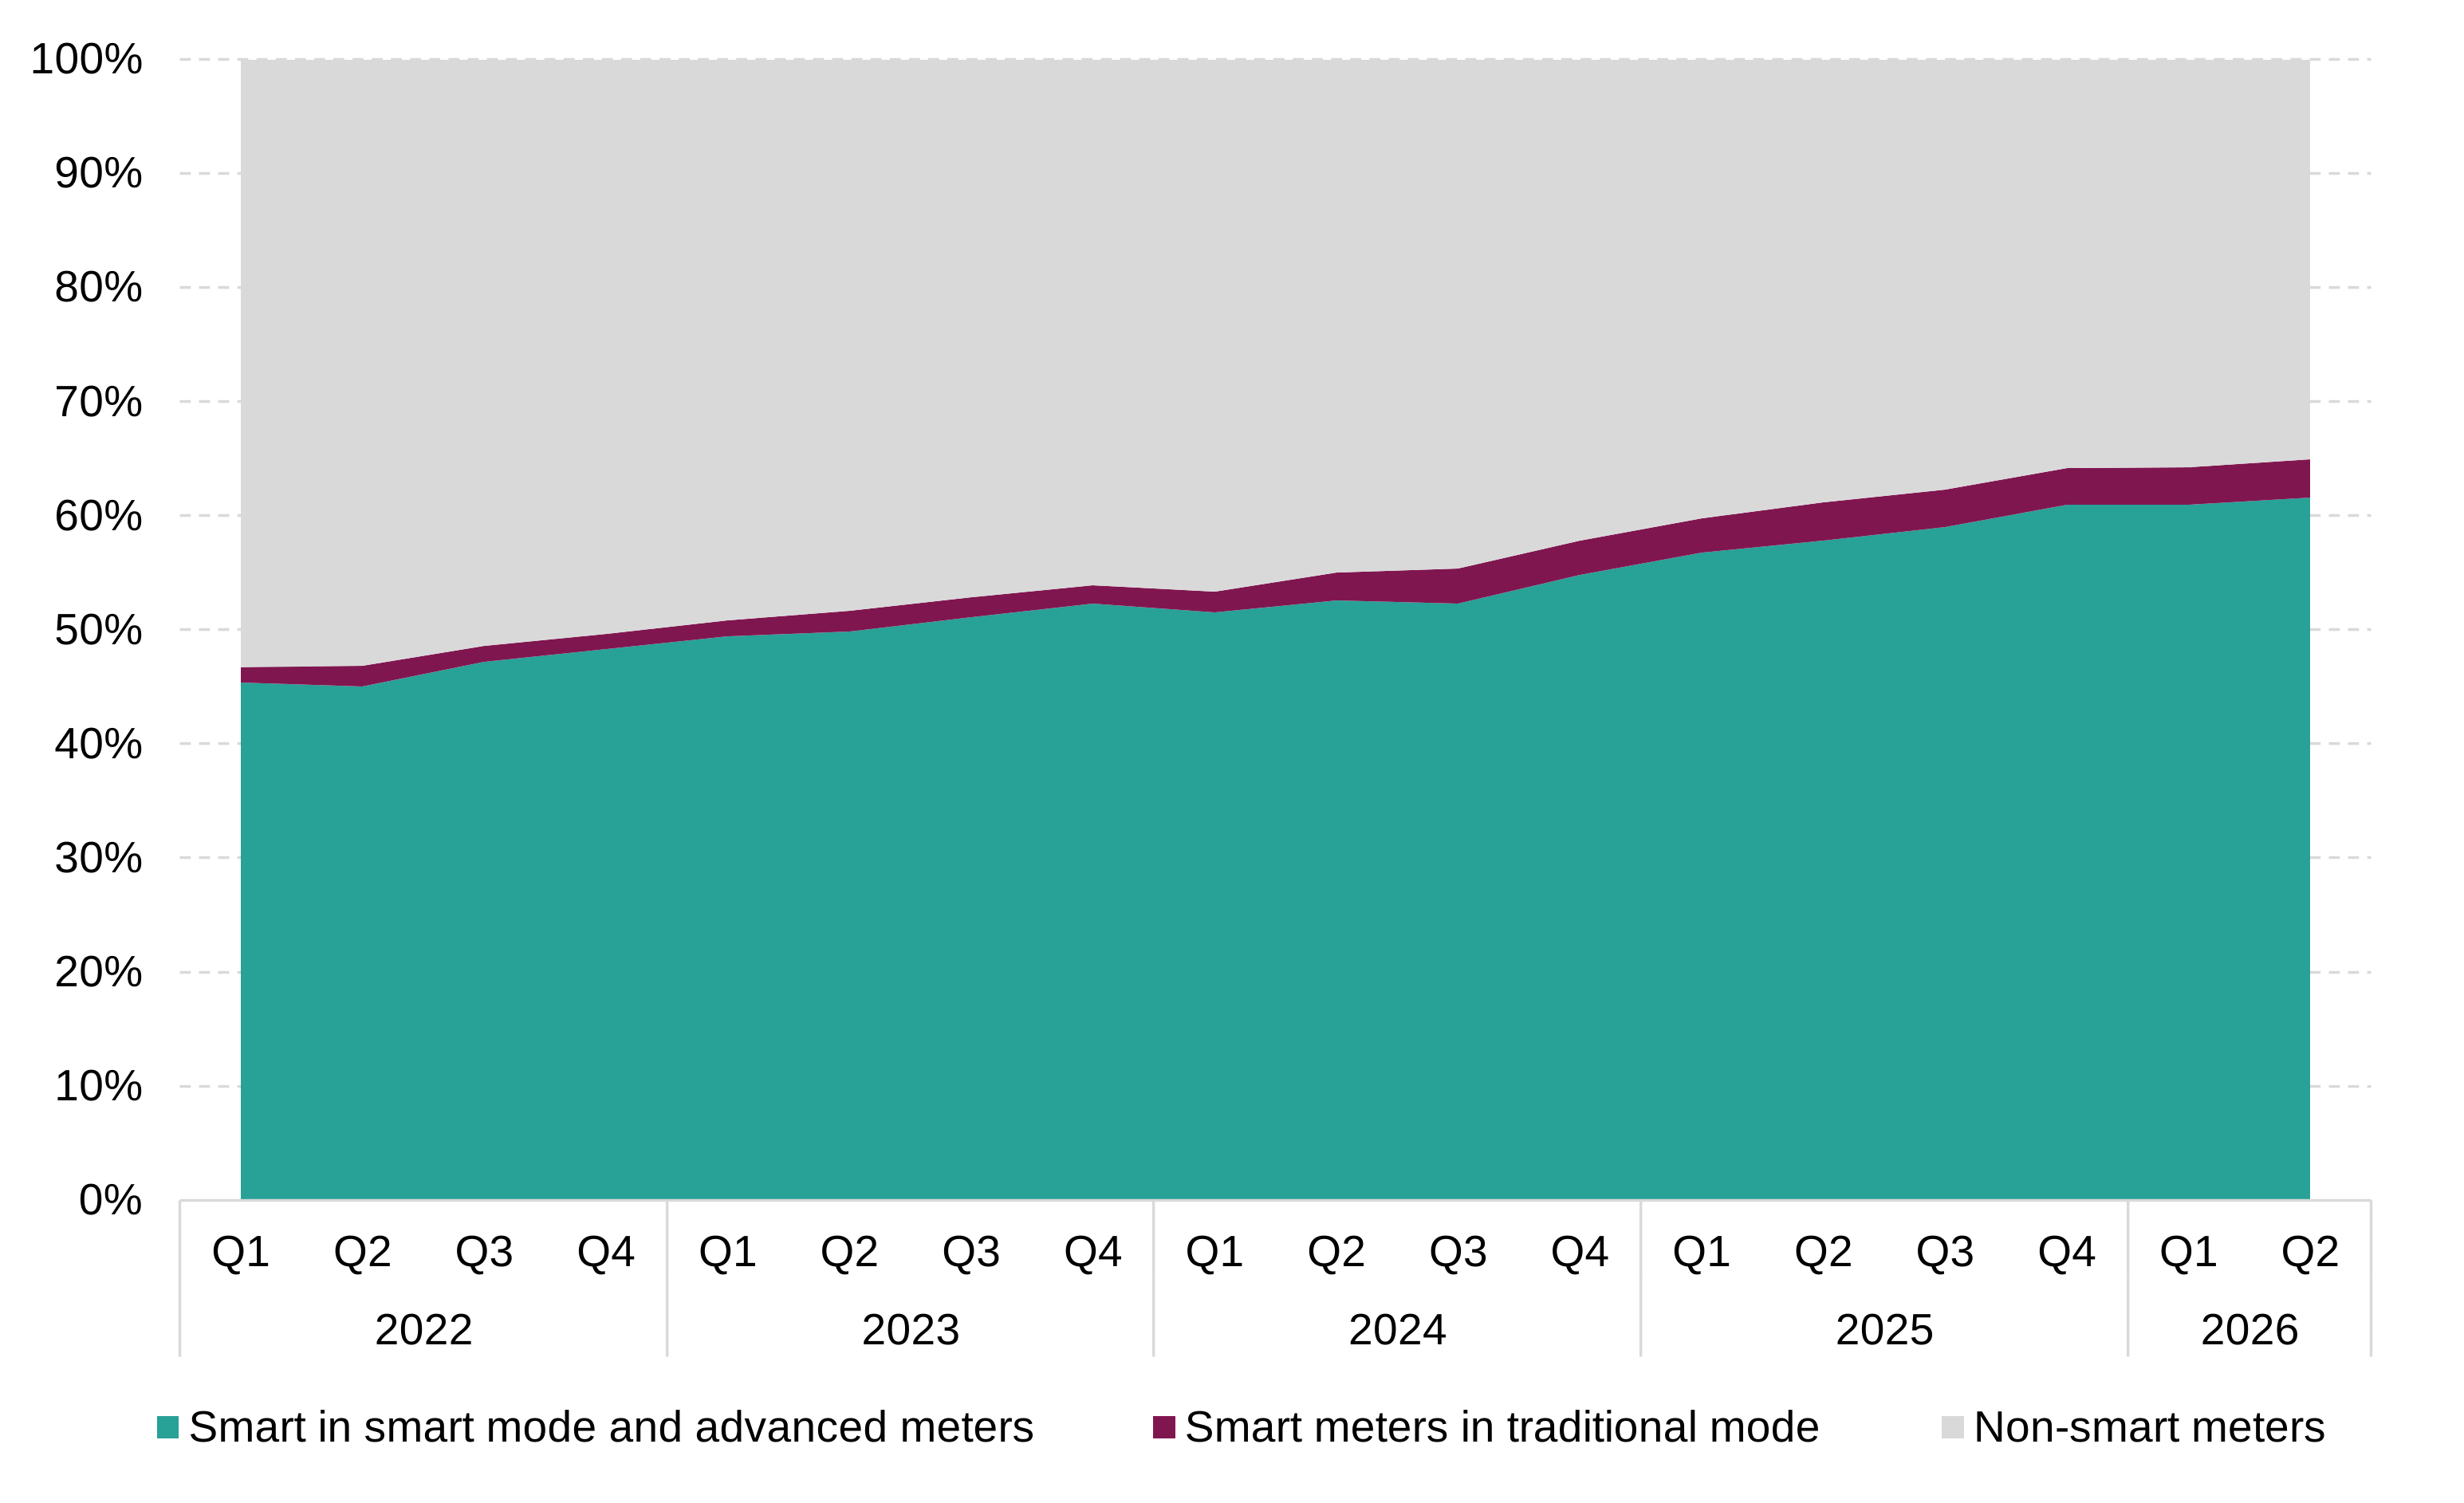
At the end of June 2026, large energy suppliers operated 1.3 million smart and advanced meters in smaller non-domestic sites. Of these 0.7 million were advanced meters and 0.6 million were smart meters (89% of which were in smart mode). Combined, 65% of non-domestic meters operated by large energy suppliers were smart or advanced. Quarterly non-domestic meters operated by large energy suppliers over recent years is shown in Figure 4.
Including small energy suppliers, for which the latest data is from the end of December 2025, there are a total of 2.1 million smart and advanced meters in smaller non-domestic sites, 67% of all non-domestic meters covered by the rollout.
Figure 4: Meters at smaller non-domestic sites operated by large energy suppliers in Great Britain from 2022
3. Further information
3.1 Methodology Note
Further information about these statistics can be found in the Technical Information.
3.2 Revisions policy
The Department for Energy Security & Net Zero statistical revisions policy sets out the revisions policy for these statistics, which has been developed in accordance with the UK Statistics Authority Code of Practice for Statistics.
3.3 Uses of these statistics
The data associated with this release is used in internal analysis to help form policy decisions and is also used by industry to monitor trends in the roll-out. The data within and associated with this publication are also used to answer Parliamentary questions and Freedom of Information requests.
3.4 User engagement
Users are encouraged to provide comments and feedback on how these statistics are used and how well they meet user needs. Comments on any issues relating to this statistical release are welcomed and should be sent to smartmeter.stats@energysecurity.gov.uk.
The Department for Energy Security & Net Zero statement on statistical public engagement and data standards sets out the department’s commitments on public engagement and data standards as outlined by the Code of Practice for Statistics.
3.5 Pre-release access to statistics
Some ministers and officials receive access to these statistics up to 24 hours before release. Details of the arrangements for doing this and a list of the ministers and officials that receive pre-release access to these statistics can be found in the Department for Energy Security & Net Zero statement of compliance with the Pre-Release Access to Official Statistics Order 2008.
3.6 Contact
-
Responsible statistician: Mita Kerai
-
Statistical enquiries: 0300 068 5044
-
Media enquiries: 020 7215 1000
-
General enquiries: smartmetering@energysecurity.gov.uk