Reported road casualties in Great Britain, provisional estimates: 2025
Published 28 May 2026

© Crown copyright 2026
This publication is licensed under the terms of the Open Government Licence v3.0 except where otherwise stated. To view this licence, visit nationalarchives.gov.uk/doc/open-government-licence/version/3 or write to the Information Policy Team, The National Archives, Kew, London TW9 4DU, or email: psi@nationalarchives.gov.uk.
Where we have identified any third party copyright information you will need to obtain permission from the copyright holders concerned.
This publication is available at https://www.gov.uk/government/statistics/reported-road-casualties-great-britain-provisional-results-2025/reported-road-casualties-in-great-britain-provisional-estimates-2025
About this release
This release provides an estimate of the number of personal injury road traffic casualties in Great Britain that were reported by the police in 2025 using the STATS19 reporting system. These figures are provisional as they will change following the end of year validation process.
Data by road user type and police force are available in the accompanying data tables.
These are accredited official statistics[footnote 1] and were independently reviewed by the Office for Statistics Regulation in July 2009. For more information, see the about these statistics section.
1. Headline figures
In reported road collisions in Great Britain in 2025 there were an estimated:
-
1,556 fatalities, a decline of 3% compared to 2024
-
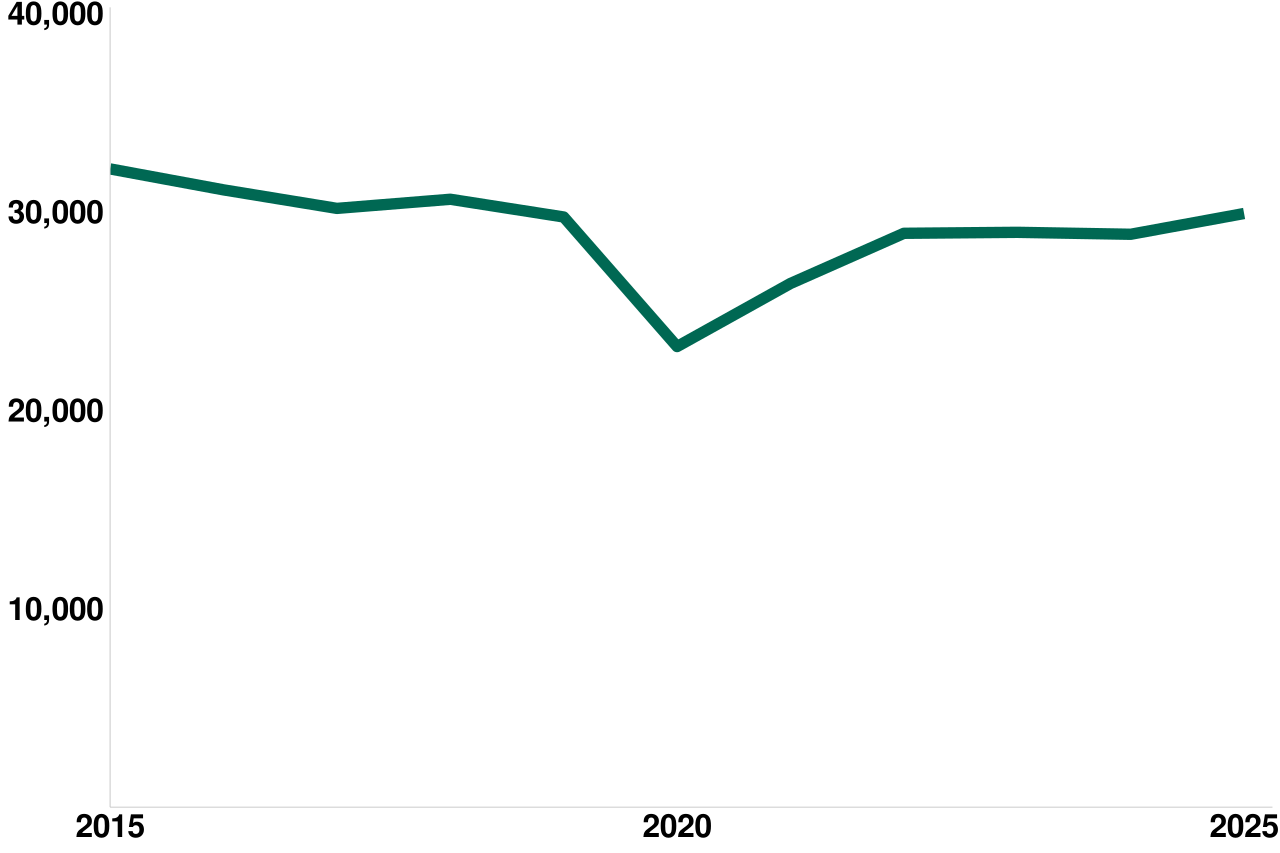
29,911 killed or seriously injured (KSI) casualties, an increase of 4% compared to 2024
-
127,870 casualties of all severities, little change compared to 2024
Of the 4 road user groups with the most casualties (car occupants, pedestrians, motorcyclists and pedal cyclists), the statistics show that between 2025 and 2024:
-
motorcycle users had the largest estimated percentage change in the number of fatalities, an increase of 13% to 384
-
pedestrians had the second largest estimated percentage change in fatalities, a decline of 9% to 372
-
pedal cycle casualties showed the largest estimated percentage change in total casualties, an increase of 10% to 16,027
The increase in motorcycle user fatalities marks the second consecutive annual increase in motorcycle user fatalities. However, given year‑to‑year volatility in fatality numbers, it is too early to determine whether this represents a sustained upward trend or a short‑term fluctuation.
In 2025, 77% of fatalities and 61% of casualties of all severities were male, similar to recent years.
Chart 1: Reported road KSI (adjusted) casualties, in Great Britain, 2015 to 2025 (provisional)
2. Things you need to know
2.1 Provisional figures
Figures in this release are provisional and are based on data supplied by police forces as of 11 May 2026. Figures will change following updates from the police and the end of year validation process, and the addition of a small number of known missing collisions. Further details are given in the background information section.
2.2 Reporting on road safety strategy targets
The UK Government’s road safety strategy, published in January 2026, sets targets to reduce the number of people killed or seriously injured (KSI) in reported road collisions by 65% by 2035, and to reduce child (under 16) KSIs by 70% by 2030, using a 2022 to 2024 baseline. Statistics for these targets will be reported on in the annual publication in July, once the data is finalised.
2.3 Severity adjustment
The figures in this release for injured casualties are based on adjusting figures reported by the police to take account of changes in the reporting of injury severity by some police forces in recent years. These adjusted figures can reliably be used to compare trends over time across the country. Police forces that have recently adopted injury‑based reporting, severity adjustments are based on a limited volume of data and may be subject to greater revision in future years. More details can be found in our severity adjustments guidance.
2.4 Data coverage
There is no obligation for people to report all personal injury collisions to the police. These figures, therefore, do not represent the full range of all collisions or casualties in Great Britain. All collisions reported by the police and that occurred on a public highway involving at least one motor vehicle, horse rider or pedal cyclist, and where at least one person was injured, are included in these statistics. More information on STATS19, how road traffic casualty data is collected and how these figures are produced can be found in the accompanying guidance.
3. Overall casualties
3.1 Casualties by severity
Casualties are broken down into fatalities (people killed in road collisions), and those injured (further split into seriously and slightly injured based on type of injury sustained). Killed and seriously injured casualties are commonly grouped together as ‘KSIs’.
It has long been known that non-fatal (and particularly slight) casualties are under-reported to the police, though we believe that the trends shown are likely to reflect genuine changes. Further information is available in the quality section below.
Chart 2 and Table 1 show the trend in road casualties by severity over the last decade. Trends in road casualties are affected by a wide range of factors, with 2020 and 2021 being impacted by COVID-19. In the decade prior to the pandemic in 2020, fatalities had been generally stable, with a steady decline in overall casualties. Figures from 2022 onwards show a return to the pre-pandemic trends.
Since 2022, fatalities have declined, the number of killed or seriously injured (KSI) casualties has risen, and total casualties have continued a gradual downward trend.
Road casualty counts are also affected by traffic levels, which have increased in recent years; casualty rates are shown in the following section.
In reported road collisions in Great Britain in 2025 there were an estimated:
-
1,556 fatalities, a decline of 3% compared to 2024
-
29,911 KSI casualties, an increase of 4% compared to 2024
-
127,870 casualties of all severities, little change compared to 2024
Chart 2: Reported road casualties by severity, in Great Britain, 2015 to 2025 (provisional) RAS91
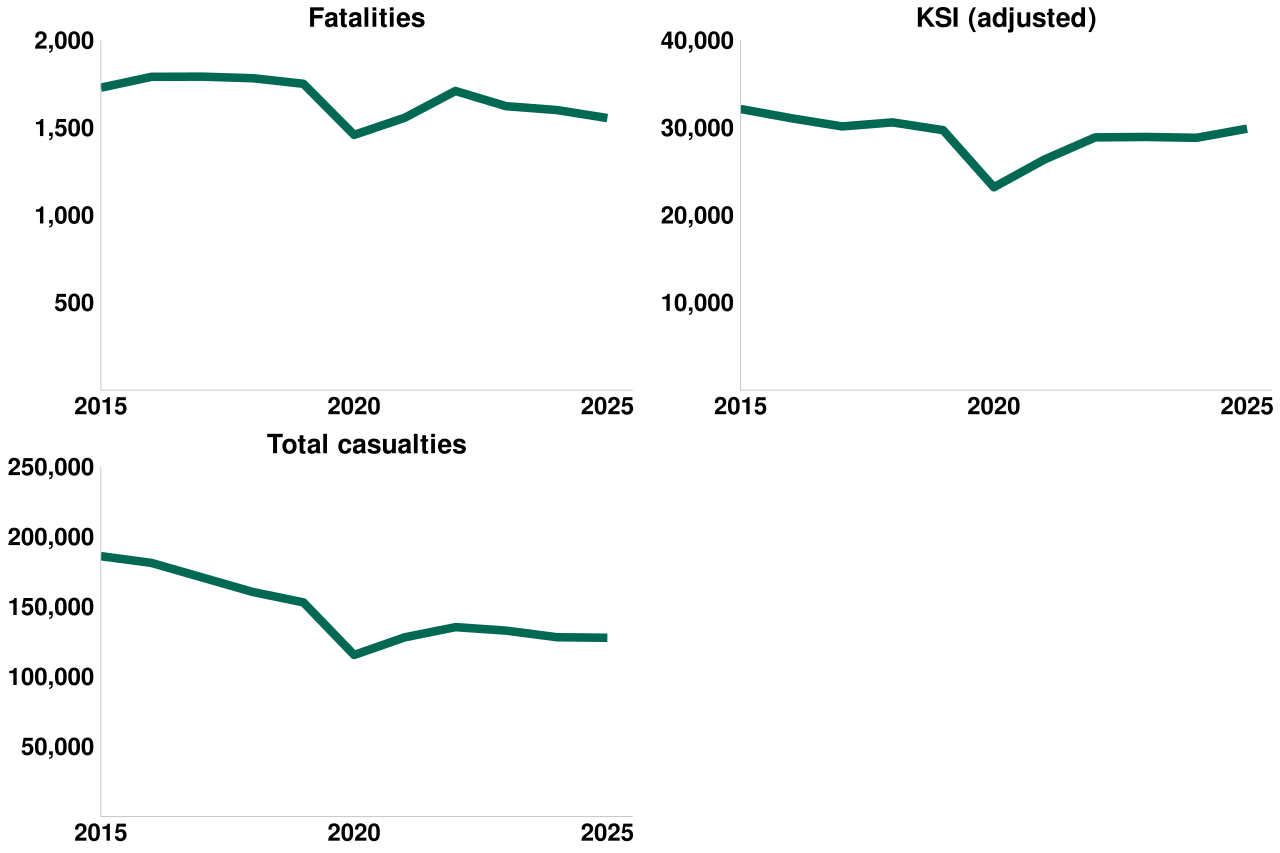
Table 1: Reported road casualties by severity, in Great Britain, 2025 (provisional) compared with 2024 and 2015 RAS91
| Severity | 2025 | % change from 2024 | % change from 2015 |
|---|---|---|---|
| Killed | 1,556 | -3 | -10 |
| Seriously injured (adjusted) | 28,355 | 4 | -7 |
| KSI (adjusted) | 29,911 | 4 | -7 |
| Slightly injured (adjusted) | 97,959 | -1 | -36 |
| All casualties | 127,870 | 0 | -31 |
4. Trends in casualty rates
Chart 3 and Table 2 show the trend in road casualty rates over the last decade. Over the past decade, overall casualty and fatalities rates have fallen. The rates for KSIs have slightly reduced, with an uptick between 2024 and 2025.
In reported road collisions in Great Britain in 2025, there were an estimated:
-
4.5 fatalities per billion vehicle miles travelled, a decline of 5% compared to 2024
-
86 KSI casualties per billion vehicle miles travelled, an increase of 2% compared to 2024
-
369 casualties of all severities per billion vehicle miles travelled, a decline of 2% compared to 2024
Chart 3: Reported road casualty rates per billion vehicle miles by severity, Great Britain, 2015 to 2025 (provisional)
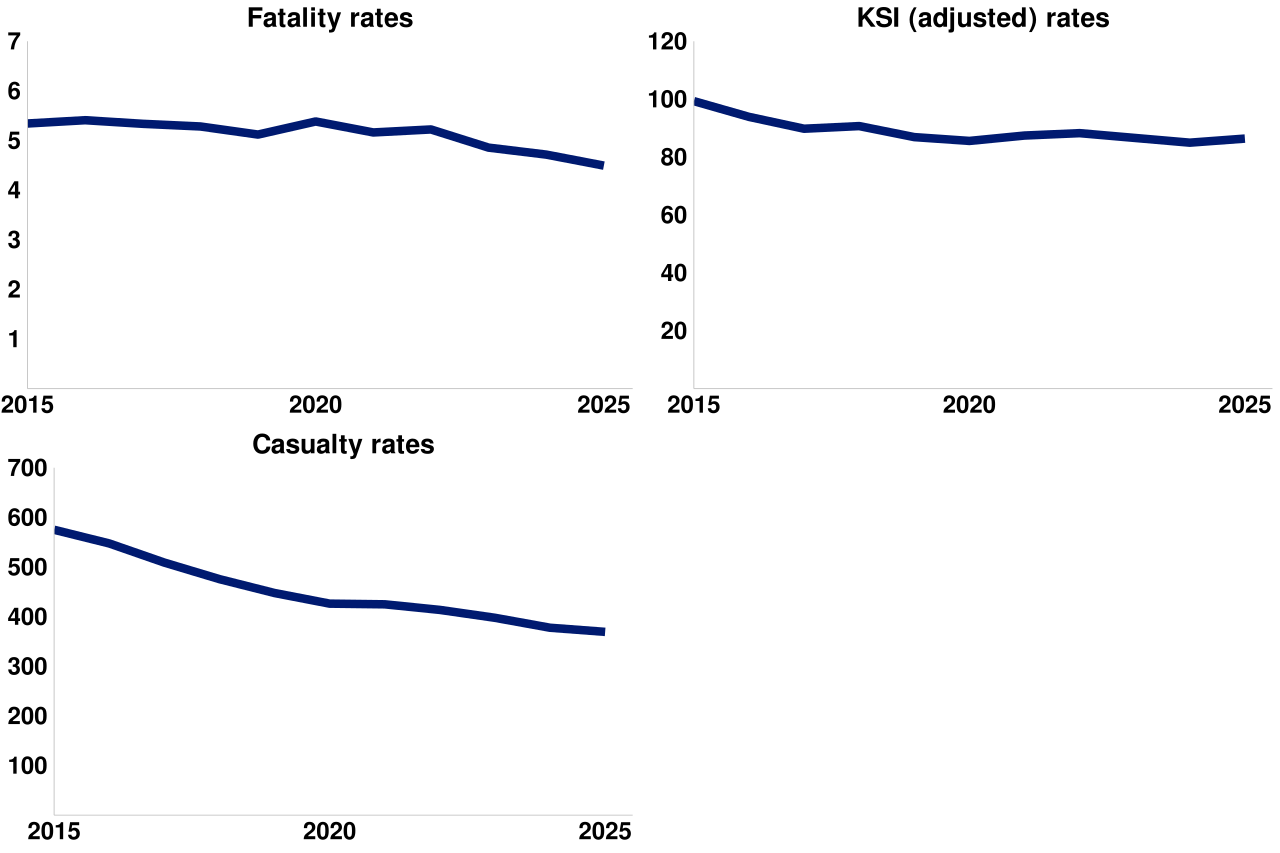
Table 2: Reported road casualty rates per billion vehicle miles by severity, Great Britain, 2025 (provisional) compared to 2024 and 2015
| Severity | 2025 | % change from 2024 | % change from 2015 |
|---|---|---|---|
| Fatalities per billion vehicle miles | 4.5 | -5 | -16 |
| KSIs per billion vehicle miles | 86.4 | 2 | -13 |
| Casualties per billion vehicle miles | 369.3 | -2 | -36 |
5. Casualties by road user type
The 4 main road user types (car occupants, pedestrians, motorcyclists and pedal cyclists) are used in the charts below to show comparisons over the last decade.
‘Other vehicle occupants’ include e-scooters, which account for much of the increase in casualties for this road user category between 2020, when e-scooters were first recorded in STATS19, and 2025.
Provisionally, there were an estimated 1,484 casualties in collisions involving e-scooters, compared to 1,390 in 2024. There were 10 killed in collisions involving e-scooters (10 of whom were e-scooter riders) compared to 6 in 2024. Our best estimate, after adjusting for changes in reporting by police, is that there were 485 seriously injured and 989 slightly injured in collisions involving e-scooters, this compares to 428 and 956 respectively in 2024.
5.1 Fatalities by road user type
Chart 4 shows fatalities for 2025 for the 4 main road user types: car occupants, pedestrians, motorcyclists and pedal cyclists.
In 2025, 41% of fatalities were car occupants, 25% were motorcyclists, 24% were pedestrians and 5% were pedal cyclists.
For fatalities, of these 4 road user types:
-
motorcycle users had the largest estimated percentage change in the number of fatalities between 2025 and 2024, an increase of 13% to 384
-
the second biggest percentage change compared to 2024 was for pedestrians, which showed a decline of 9% to 372
-
car occupants showed a decline of 8% to 638
-
pedal cyclists showed a decline of 1% to 81
The increase in motorcycle user fatalities marks the second consecutive annual increase in motorcycle user fatalities. However, given year‑to‑year volatility in fatality numbers, it is too early to determine whether this represents a sustained upward trend or a short‑term fluctuation.
Chart 4: Reported road fatalities by road user type, in Great Britain, 2015 to 2025 (provisional) RAS91

Table 3: Reported road fatalities by road user type, in Great Britain, 2025 (provisional) compared with 2024 and 2015 RAS91
| Road User Type | 2025 | % change from 2024 | % change from 2015 |
|---|---|---|---|
| Car occupants | 638 | -8 | -15 |
| Motorcyclists | 384 | 13 | 5 |
| Pedestrians | 372 | -9 | -9 |
| Pedal cyclists | 81 | -1 | -19 |
| Goods vehicles occupants | 44 | -10 | -32 |
| Other vehicle occupants | 32 | 19 | -3 |
| Bus or coach occupants | 5 | 67 | 0 |
5.2 All casualties by road user type
Chart 5 shows overall casualties figures split into the 4 main road user types: car occupants, pedestrians, motorcyclists and pedal cyclists.
In 2025, 53% of casualties were car occupants, 16% were pedestrians, 12% were motorcyclists and 13% were pedal cyclists.
For all casualties, of these 4 road user types:
-
pedal cycle casualties showed the largest estimated percentage change in total casualties, with an increase of 10% between 2025 and 2024 to 16,027
-
motorcyclists showed a decline of 3% between 2025 and 2024 to 15,442
-
pedestrian casualties showed an increase of 4% between 2025 and 2024 to 19,972
-
car occupant casualties declined for the third consecutive year, with a decline of 3% between 2025 and 2024 to 67,720
Chart 5: Reported road casualties by road user type, in Great Britain, 2015 to 2025 (provisional) RAS91
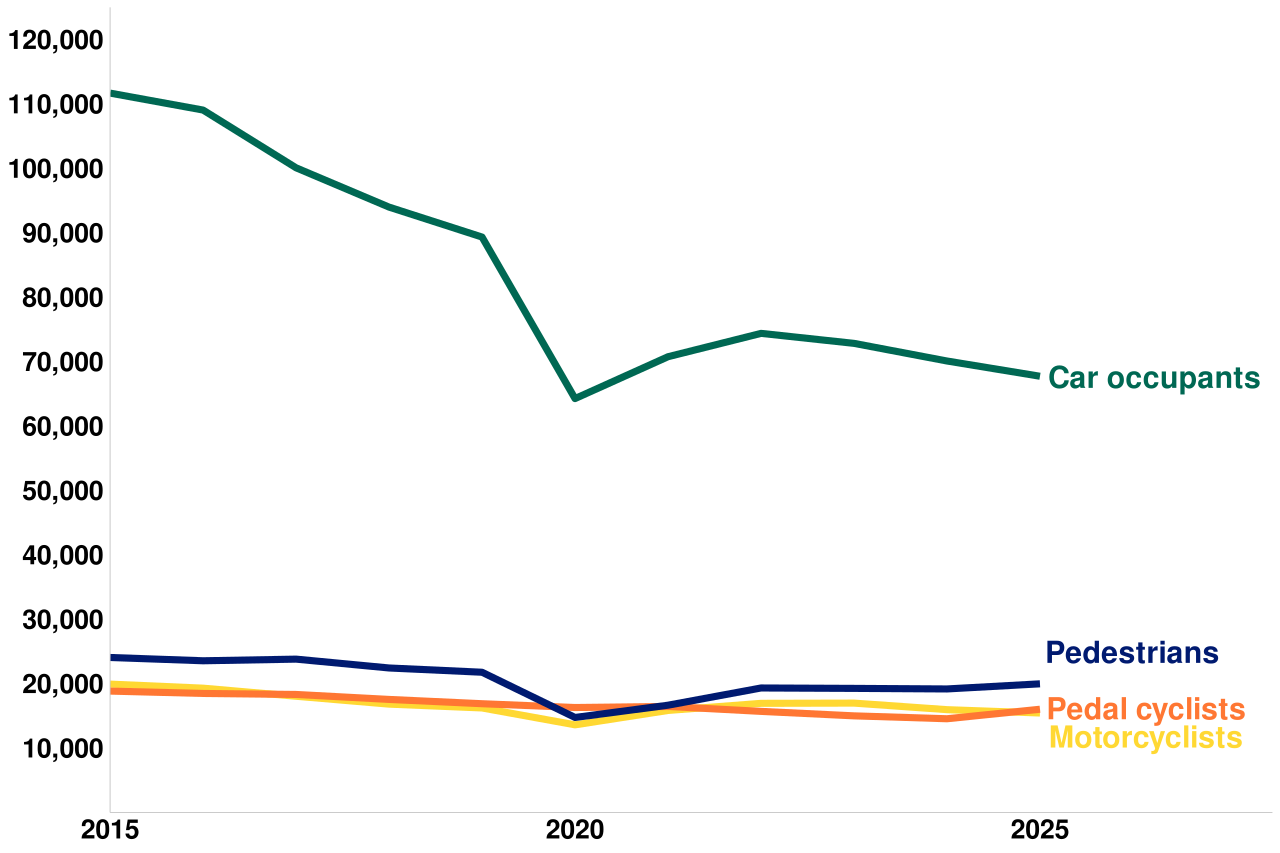
Table 4: Reported road casualties by road user type, Great Britain, 2025 (provisional) compared with 2024 and 2015 RAS91
| Road User Type | 2025 | % change from 2024 | % change from 2015 |
|---|---|---|---|
| Car occupants | 67,720 | -3 | -39 |
| Pedestrians | 19,972 | 4 | -17 |
| Pedal cyclists | 16,027 | 10 | -15 |
| Motorcyclists | 15,442 | -3 | -23 |
| Goods vehicles occupants | 4,647 | 11 | -24 |
| Bus or coach occupants | 2,036 | -9 | -56 |
| Other vehicle occupants | 2,026 | -3 | 111 |
6. Casualties by age and sex
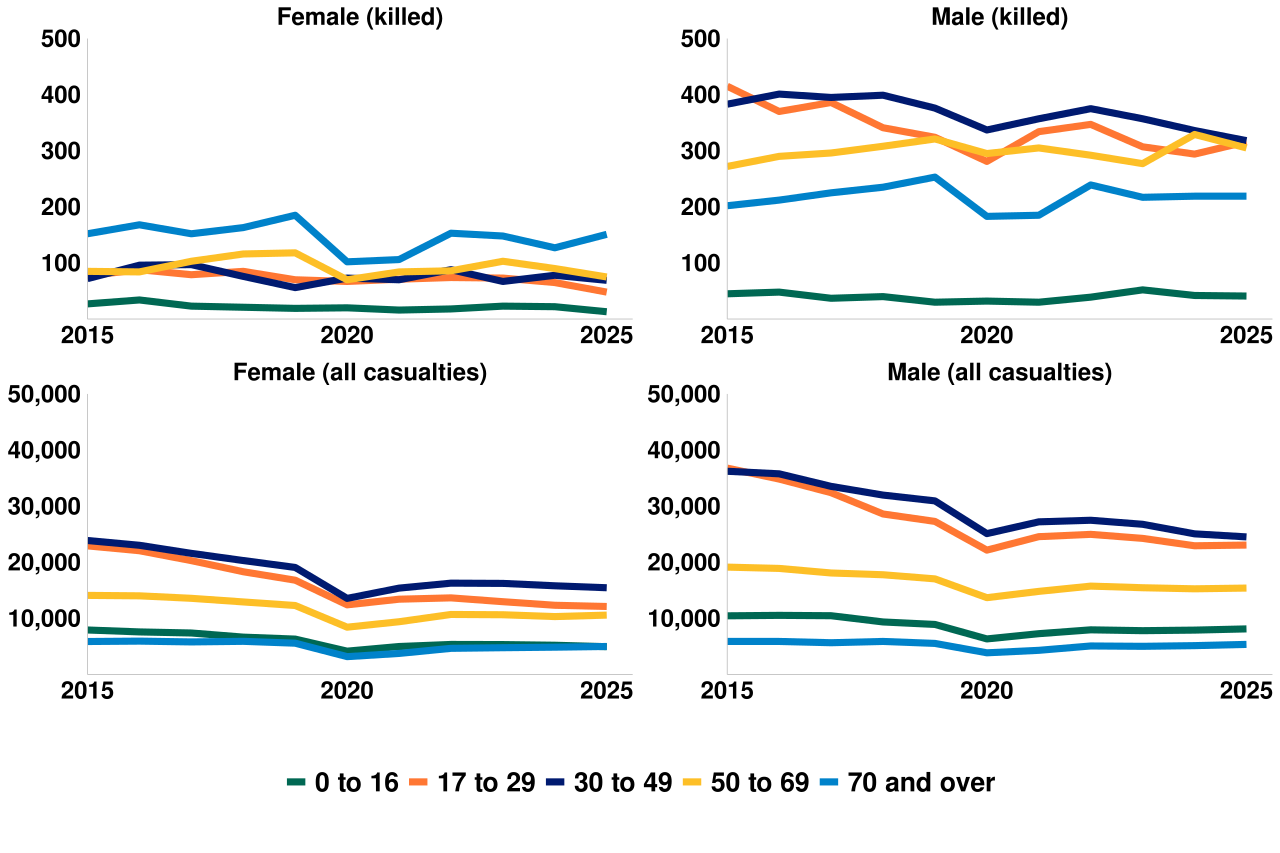
Chart 6 shows fatalities and all casualties split by both sex and age group.
Overall, in 2025:
- 77% of fatalities and 61% of casualties of all severities were male
- 3% of fatalities and 10% of casualties were aged 16 years old and under
- 23% of fatalities and 28% of casualties were aged 17 to 29 years old
- 24% of fatalities and 8% of casualties were aged 70 years old and over
Chart 6: Reported road fatalities and all casualties by age group and sex in Great Britain, 2015 to 2025 (provisional)
6.1 Fatalities by age and sex
Overall, 77% of fatalities were male in 2025.
Among males, fatality levels remain highest for those aged 17 to 29, 30 to 49 and 50 to 69, with broadly similar numbers across these three age groups in 2025. Over the past decade, male fatalities among those aged 17 to 29 and 30 to 49 have fallen, while fatalities among those aged 50 over have increased. This reflects a continuing longer‑term shift towards older age groups accounting for a greater share of male road fatalities. Overall, the total number of male fatalities across all ages was slightly lower than in 2024 and remains below 2015 levels.
Among females, fatalities in 2025 were highest among those aged 70 and over. Over the longer term, female fatalities have declined across all age groups since 2015, particularly among those under 30.
As the numbers in each group are small, there can be large fluctuations when comparing between years, as shown in Chart 5 and Table 4.
Table 5: Reported road fatalities by age group and sex in Great Britain, 2025 (provisional) compared with 2024 and 2015
| Sex | Age group (years) | 2025 | % change from 2024 | % change from 2015 |
|---|---|---|---|---|
| Male | 0 to 16 | 41 | -2 | -9 |
| Male | 17 to 29 | 316 | 7 | -24 |
| Male | 30 to 49 | 318 | -5 | -17 |
| Male | 50 to 69 | 305 | -7 | 12 |
| Male | 70 and over | 219 | 0 | 8 |
| Male | All ages | 1,200 | -2 | -9 |
| Female | 0 to 16 | 13 | -41 | -52 |
| Female | 17 to 29 | 48 | -26 | -38 |
| Female | 30 to 49 | 69 | -12 | -4 |
| Female | 50 to 69 | 75 | -17 | -12 |
| Female | 70 and over | 151 | 19 | -1 |
| Female | All ages | 356 | -7 | -14 |
6.2 All casualties by age and sex
Overall, 61% of casualties of all severities were male in 2025.
Among males, casualty levels in 2025 were highest among those aged 17 to 29 and 30 to 49. Over the longer term, male casualties have fallen across all age groups since 2015, with particularly large reductions among those aged 17 to 29 and 30 to 49.
Among females, casualty levels in 2025 were highest among those aged 30 to 49. Over the longer term, female casualties have declined across all age groups since 2015, with the largest reductions among those under 30.
Table 6: Reported road casualties by age group and sex in Great Britain, 2025 (provisional) compared with 2024 and 2015
| Sex | Age group (years) | 2025 | % change from 2024 | % change from 2015 |
|---|---|---|---|---|
| Male | 0 to 16 | 8,121 | 3 | -22 |
| Male | 17 to 29 | 23,066 | 1 | -37 |
| Male | 30 to 49 | 24,519 | -2 | -32 |
| Male | 50 to 69 | 15,398 | 1 | -20 |
| Male | 70 and over | 5,359 | 4 | -9 |
| Male | All ages | 77,630 | 0 | -30 |
| Female | 0 to 16 | 4,950 | -5 | -38 |
| Female | 17 to 29 | 12,116 | -2 | -47 |
| Female | 30 to 49 | 15,457 | -2 | -35 |
| Female | 50 to 69 | 10,579 | 3 | -25 |
| Female | 70 and over | 4,987 | 3 | -15 |
| Female | All ages | 48,869 | -1 | -36 |
7. Background quality information
Detailed guidance on road casualty statistics is given on our guidance page. A full list of the definitions used in this publication can be found in our notes and definitions documentation.
7.1 Quality and methodology
Quality
Road casualty statistics have been assessed as accredited official statistics, indicating compliance with the Code of Practice for Statistics. Full details of the quality of these statistics are available in the background quality report.
There are several important areas which users of the statistics should be aware of which are listed below.
Provisional figures
These provisional annual figures are the second accredited official statistics published on the number of road casualties in Great Britain during 2025. They follow the mid-year estimates published in November 2025. Final annual figures are scheduled for publication in July 2026.
This publication is based on data supplied by police forces up to 11 May. All police forces have supplied data for all months, however there are around 100 collisions for which data has not been provided, including 3 fatalities. This data will be included in the final statistics in July. In addition, fatality figures are subject to further revision, as some cases may later be reclassified where a death is determined to be due to suicide or a medical episode rather than a road traffic collision.
These are provisional estimates which have not been validated in detail. There may be some duplicates, as some casualties might have been logged twice or more, these will be deleted following end of year validation. The potential of duplicate records is relatively small and therefore this publication provides a good picture of the road safety landscape especially at high aggregation.
Provisional results for some road user types can be impacted by misclassified vehicle types. Misclassified vehicle types are reported back to the police who will return a designated vehicle type where notified. Vehicles are matched to the Driver and Vehicle Licensing Agency database and where there is a good body type match, vehicle type may be reclassified.
These factors are unlikely to affect the high-level national trends shown, but will have a bigger impact on figures for individual police force areas.
Comparison of provisional and final figures
In order to assess the impact of the validation process an assessment of the difference between published provisional figures and final figures has been conducted for 2020 to 2022 data. This analysis shows that there are only minor changes between the provisional and final figures at a national level (typically less than 1%) and these do not affect the overall trends. There is also no specific bias to the differences, with some provisional figures being over-estimates and some being under-estimates. Further details are available in the background quality report.
Under-reporting
Comparisons of road collision reports with death registrations show that very few, if any, road collision fatalities are not reported to the police. However, a considerable proportion of non-fatal casualties are not known to the police, as hospital, survey and compensation claims data all indicate a higher number of casualties than those recorded in police collision data. More information on the coherence of the police reported data with alternative sources can be found in our comparison to other sources of information on road casualties.
Changes in reporting systems used by police forces
From 2016 onwards, figures on the severity of injury have been affected by a large number of police forces changing their reporting systems. It is likely that the recording of injury severity is more accurate for forces using these new reporting systems.
The Office for National Statistics (ONS) Methodology Advisory Service have completed analysis to quantify the effect of the introduction of new injury based reporting systems on the number of slight and serious injuries reported to the police, and to estimate the level of slight and serious injuries as if all police forces were using injury-based reporting systems.
For more information, please see our guide to severity adjustments.
A number of police forces have recently transitioned to injury‑based reporting. As a result, severity adjustments for these forces are based on a relatively limited volume of data and may therefore be subject to greater revision than for forces with more established injury‑based reporting. The affected forces are: Avon and Somerset, Cheshire, Cleveland, Derbyshire, Dorset, Dyfed‑Powys, Hampshire, Leicestershire, Northamptonshire, Thames Valley and Wiltshire.
Online self-reporting
Online self-reporting is part of a wider project for digital public contact known as Single Online Home. It is funded by the Home Office to allow people involved in road traffic collisions to report the collision to the police online should they choose to do so, rather than having to physically report it at a police station.
The principle of online reporting is to make it easier for members of the public to report collisions. It is expected that the introduction of online reporting will affect the number of non-fatal (and particularly slight) casualties reported and therefore impact the total for Great Britain, as the public will have more reporting options available to them.
See our analysis of the impact of online self reporting for more details.
7.2 User engagement, developments and STATS19 review
Details of users and uses of road casualty statistics and response to recent user feedback is available from our user engagement page.
The STATS19 system which provides the majority of statistics for this publication is periodically reviewed to keep up with changes in technology, to make improvements to completeness and accuracy, and to reduce the reporting burden. An update on progress in implementing the recommendations of the latest review can be found via the above link.
7.3 About these statistics
These official statistics were independently reviewed by the Office for Statistics Regulation in July 2009. They comply with the standards of trustworthiness, quality and value in the Code of Practice for Statistics and should be labelled ‘accredited official statistics’.
They undergo regular quality assurance reviews to ensure they meet customer needs. More information can be found on our national statistics status webpage.
Details of Ministers and officials who receive pre-release access to these statistics up to 24 hours before release can be found in our pre-release access list.
8. Instructions for printing and saving
Depending on which browser you use and the type of device you use (such as a mobile or laptop) these instructions may vary.
Tablets and mobile devices normally have the option to “find in text” and “print or save” in their sharing or quick options menu of their browser, but this will vary by device model.
9. How to search
Select Ctrl and F on a Windows laptop or Command and F on a Mac.
This will open a search box in the top right-hand corner of the page. Type the word you are looking for in the search bar and press enter.
Your browser will highlight the word, usually in yellow, wherever it appears on the page. Press enter to move to the next place it appears.
10. Contact details
Road safety statistics
Email roadacc.stats@dft.gov.uk
-
Accredited official statistics are called National Statistics in the Statistics and Registration Service Act 2007. Accredited Official Statistics Policy – Office for Statistics Regulation ↩