Reported road casualties Great Britain: estimates involving driving for work (new approach methodology)
Updated 24 September 2026

© Crown copyright 2026
This publication is licensed under the terms of the Open Government Licence v3.0 except where otherwise stated. To view this licence, visit nationalarchives.gov.uk/doc/open-government-licence/version/3 or write to the Information Policy Team, The National Archives, Kew, London TW9 4DU, or email: psi@nationalarchives.gov.uk.
Where we have identified any third party copyright information you will need to obtain permission from the copyright holders concerned.
This publication is available at https://www.gov.uk/government/statistics/reported-road-casualties-great-britain-involving-driving-for-work/reported-road-casualties-great-britain-estimates-involving-driving-for-work-new-approach-methodology
Official statistics in development
This methodology note relates to a proposed new method for estimating work-related collisions within road casualty statistics. It is being published alongside the resulting estimates as statistics in development with the intention that this method will be adopted from the publication of 2026 statistics in summer 2027, subject to further testing and any feedback from users of the statistics, which can be provided by email using the contact details below.
1. Introduction
The STATS19 road collision reporting system records information on the circumstances of vehicles involved in reported road collisions. This includes information on the purpose of the journey being undertaken by the driver or rider at the time of the collision.
However, journey purpose is not known for all vehicles involved in reported road collisions.
Of the 2,038,856 vehicles recorded between 2016 and 2025:
- 286,127 vehicles were recorded as travelling for work
- 531,330 vehicles were recorded as travelling for non-work purposes
- 1,221,399 vehicles (59.9%) had an unknown journey purpose
The high prevalence of unknown journey purpose means that statistics based solely on vehicles with a recorded journey purpose may not provide a complete picture of work related road collisions.
This methodology describes a statistical approach used to estimate the probability that vehicles with an unknown journey purpose were travelling for work. These probabilities are then used to produce estimates of the number and proportion of vehicles, collisions and casualties associated with work related travel.
Table 1: Recorded journey purpose by year, Great Britain
| Year | Vehicles | Work | Non-work | Unknown | % unknown |
|---|---|---|---|---|---|
| 2016 | 252,500 | 38,028 | 46,623 | 167,849 | 66 |
| 2017 | 238,926 | 36,709 | 52,349 | 149,868 | 63 |
| 2018 | 226,409 | 33,213 | 50,086 | 143,110 | 63 |
| 2019 | 216,381 | 30,692 | 57,125 | 128,564 | 59 |
| 2020 | 167,375 | 22,408 | 45,330 | 99,637 | 60 |
| 2021 | 186,443 | 26,071 | 52,252 | 108,120 | 58 |
| 2022 | 193,545 | 26,354 | 55,418 | 111,773 | 58 |
| 2023 | 189,815 | 25,487 | 54,140 | 110,188 | 58 |
| 2024 | 183,514 | 24,234 | 54,003 | 105,277 | 57 |
| 2025 | 183,948 | 22,931 | 64,004 | 97,013 | 53 |
Across all years, more than half of vehicles involved in reported injury collisions had an unknown journey purpose.
The proportion ranged from 53% in 2025 to 66% in 2016.
2. Journey purpose information and harmonisation
Journey purpose information is recorded at the vehicle level within STATS19.
The variable used to record journey purpose changed following the introduction of the 2024 STATS19 specification. As a result, different journey purpose categories were used during the period covered by this analysis.
To produce a consistent series of estimates, categories from both STATS19 specifications were mapped to three common analytical categories:
- Journey as a part of work (work)
- Journey not as a part of work (Non-work)
- Unknown
Only journeys explicitly recorded as being undertaken as part of work were classified as work journeys.
Commuting journeys were classified as non-work journeys. This approach is consistent with the definition of work related road travel used throughout this methodology, which is restricted to journeys undertaken as part of work activity rather than travel between home and a usual place of work.
Table 2: Journey purpose categories and harmonisation
| STATS19 specification | Original category | Harmonised category |
|---|---|---|
| 2011 | Journey as part of work | Work |
| 2011 | Commuting to or from work | Non-work |
| 2011 | Taking pupil to or from school | Non-work |
| 2011 | Pupil riding to or from school | Non-work |
| 2011 | Other | See Section: Use of the “Other” category |
| 2011 | Unknown | Unknown |
| 2011 | Unknown or Other | See Section: Use of the “Other” category |
| 2024 | Journey as part of work | Work |
| 2024 | Commuting to or from work | Non-work |
| 2024 | Education and educational escort | Non-work |
| 2024 | Emergency vehicle (blue light) on response | Non-work |
| 2024 | Personal business or leisure | Non-work |
| 2024 | Not known or not requested | Unknown |
Application of the harmonisation process resulted in the following distribution of vehicle records.
Table 3: Harmonised journey purpose categories: 2016 to 2025
| Journey purpose category | Vehicles | Percentage |
|---|---|---|
| Work | 286,127 | 14% |
| Non-work | 531,330 | 26.1% |
| Unknown | 1,221,399 | 59.9% |
3. Developing the model dataset
3.1 Use of the “Other” category in the 2011 STATS19 specification
The 2011 STATS19 specification included an Other journey purpose category. Initial examination of journey purpose data showed substantial variation between police forces in the use of this category.
The distinction between the Other and Unknown journey purpose categories was not applied consistently across police forces under the 2011 STATS19 specification. Evidence from force-level recording patterns suggests that some police forces routinely distinguished between Other and Unknown, whereas others appear to have combined these concepts in practice, recording journeys that might have been classified as Other elsewhere within the Unknown category. As a result, differences in the use of Other are likely to reflect both local recording practices and differences in the interpretation of journey purpose categories, rather than genuine differences in travel behaviour.
As the Other category does not exist under the 2024 STATS19 specification, this issue is relevant only to collisions recorded under the 2011 specification.
3.2 Identifying active use of “Other”
Journey purpose recording practices were examined separately for each police force and collision year between 2016 and 2023.
A force-year was classified as an active user of Other where:
- at least 100 vehicles were recorded as Other
- vehicles recorded as Other represented at least 10% of all vehicles with a known journey purpose
The minimum threshold of 100 vehicles was included to avoid classifying force-years on the basis of small numbers.
Figure 1: Proportion of work journeys among known journeys by police force, 2023
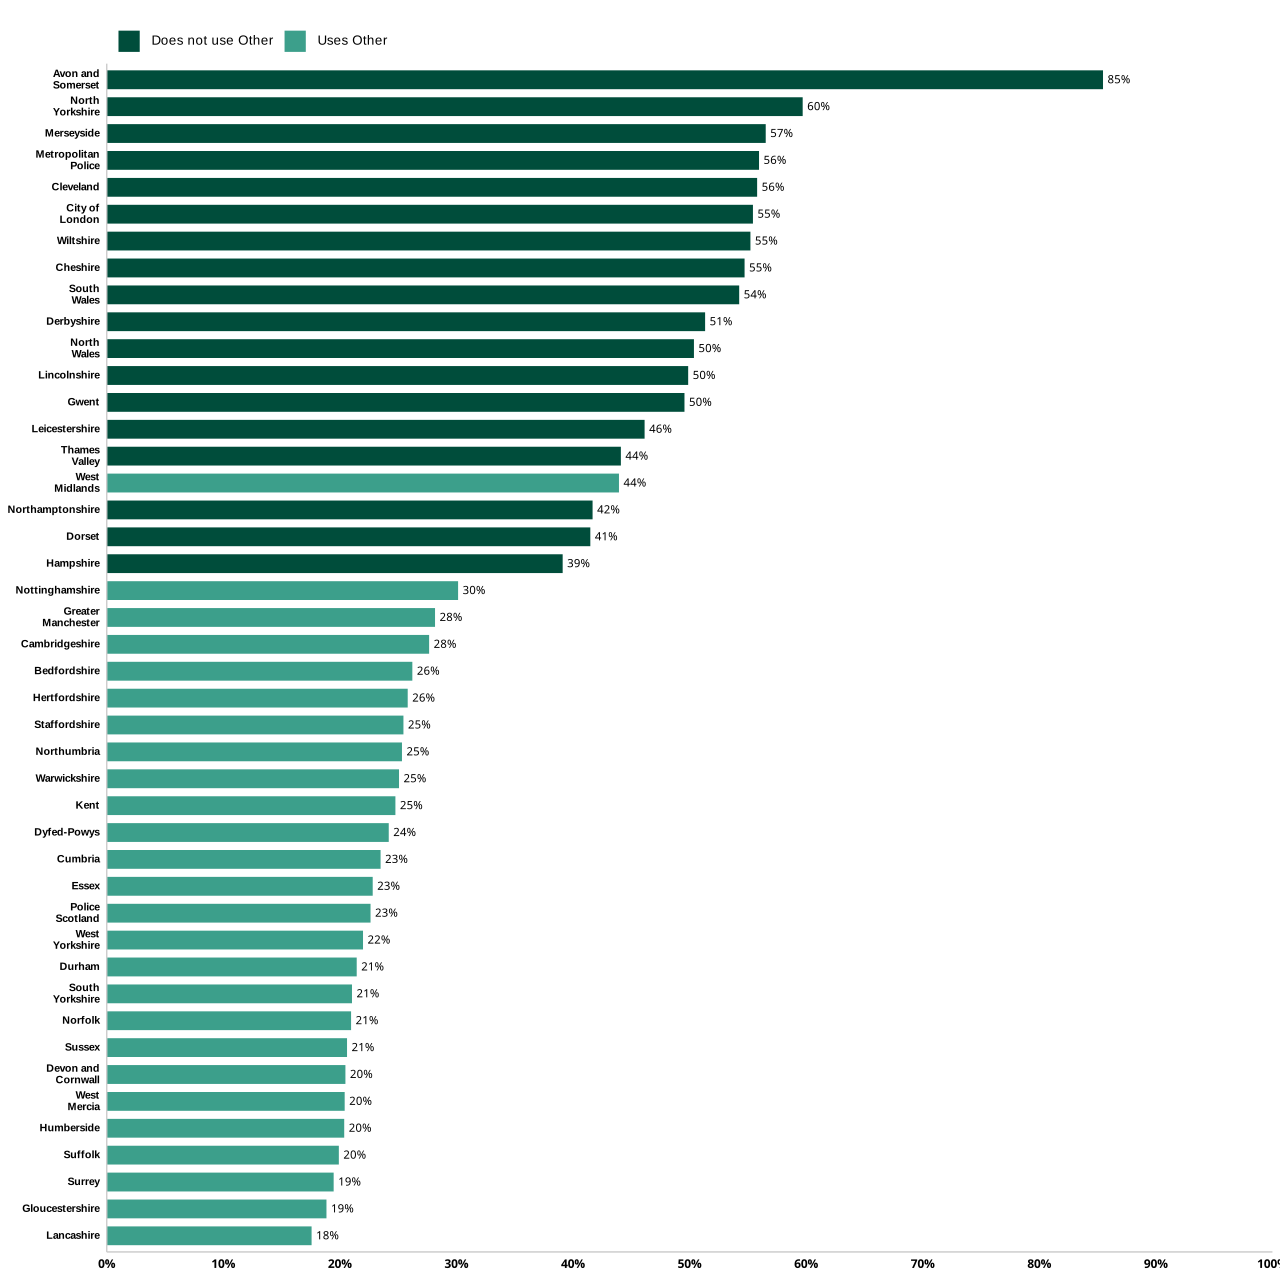
The figure shows substantial variation between police forces in the proportion of known journeys classified as work journeys.
Police forces identified as active users of the Other category generally exhibited different recording patterns from forces that did not actively use the category, reinforcing the view that journey-purpose recording behaviour varied across Great Britain.
Among active users:
- the proportion of known journeys recorded as Other ranged from 11% to 72%
- the median proportion recorded as Other was 57%
3.3 Use of “Other” within the modelling dataset
The objective of the modelling stage was to learn relationships between vehicle characteristics and journey purpose from records where journey purpose information appeared most complete.
For collisions recorded under the 2011 STATS19 specification, vehicles were included in the modelling dataset only where:
- journey purpose could be classified as either work or non-work
- valid collision-level work related information was available
- the police force-year was identified as an active user of the Other category
Within these force-years, vehicles recorded as Other were treated as known non-work journeys and incorporated into the modelling dataset.
This approach increased the amount of labelled information available to the model while reducing reliance on force-years where journey purpose recording appeared less complete.
4. Model dataset
A statistical model was developed to estimate the probability that vehicles with an unknown journey purpose were travelling as part of work.
For collisions recorded under the 2024 STATS19 specification, vehicles with a recorded work or non-work journey purpose were included in the modelling dataset.
For collisions recorded under the 2011 STATS19 specification, vehicles were included in the modelling dataset where:
- journey purpose could be classified as either work or non-work
- the journey was recorded in the CRASH system
- the police force-year was identified as an active user of the Other category
Vehicles recorded as Other within these force-years were treated as known non-work journeys.
Restricting the training dataset to CRASH-recorded collisions ensured a more consistent recording environment and reduced variation arising from differences between police collision recording systems.
Vehicles with an unknown journey purpose were excluded from model training and formed the population for which work related travel was subsequently estimated.
The modelling dataset was defined to prioritise consistency and the quality of recorded journey-purpose information rather than simply maximising the number of records available. All records meeting these criteria were retained because they provided sufficient coverage of different years, police forces, vehicle types and journey circumstances. However, the large size of the dataset does not in itself ensure that it is representative of vehicles with an unknown journey purpose. This issue is considered further in the limitations section.
Table 4: Training dataset summary
| Measure | Value |
|---|---|
| Training records | 522,632 |
| Work journeys | 126,188 |
| Non-work journeys | 396,444 |
A logistic regression model was used to estimate the probability that a vehicle with an unknown journey purpose was travelling as part of work.
The model used characteristics recorded within STATS19 that were available for both vehicles with known journey purpose and vehicles with unknown journey purpose.
Table 5: Predictor variables included in the model
| Predictor variable | Description |
|---|---|
| Vehicle type | Detailed vehicle classification |
| Driver sex | Recorded sex of the driver or rider |
| Driver age | Age of the driver or rider |
| Hour of collision | Hour at which the collision occurred |
| Tow or articulation status | Whether the vehicle was towing or articulated |
| Day of week | Day on which the collision occurred |
| Police force | Police force recording the collision |
| Junction type | Whether the collision occurred near a junction |
| Month | Month of collision |
| Year | Collision year |
| Urban/rural classification | Urban or rural location of the collision |
Driver age and collision hour were modelled using restricted cubic splines to allow for non-linear relationships with the probability of work related travel.
Where driver age was missing, the value was imputed using the median age observed within the dataset. An additional indicator variable was included to identify records with missing age information.
Police force was included to allow the estimated overall probability of work-related travel to vary between forces. The model otherwise assumes that the relationships between journey purpose and characteristics such as vehicle type, driver age and collision time are broadly consistent across police forces. This simplification avoids fitting a large number of force-specific relationships, some of which would be based on relatively few records, but may not capture every local difference in recording or travel patterns. Police forces with fewer than 100 training records were combined with the reference category to improve model stability.
The logistic regression model was fitted using the training dataset described above.
The fitted model estimated the probability that a vehicle with a particular combination of characteristics was travelling as part of work. Predicted probabilities therefore ranged between 0 and 1, where values closer to 1 indicate a greater likelihood of work related travel.
5. Model validation
Detailed model validation results are provided in Annex A below. These indicate that the model performs reasonably well within the modelling dataset, although uncertainty remains regarding how well the observed relationships apply to records with an unknown journey purpose.
Model performance was assessed using five-fold cross-validation. The modelling dataset was divided into five groups. The model was fitted using four groups and evaluated against the remaining group, with the process repeated so that each record was used once for validation. The results indicated that, among records with a known journey purpose, the model could distinguish reasonably well between work and non-work journeys and produced aggregate estimates close to the observed totals.
These results provide evidence that the model captures useful relationships within the records used to develop it. They do not, however, demonstrate that exactly the same relationships apply to records with an unknown journey purpose. Differences in whether and how journey purpose is recorded, including differences between police forces, remain an important source of uncertainty.
6. Adjustments
6.1 Adjustments for the other/unknown split
As described previously, some police forces routinely recorded vehicles using the Other journey purpose category under the 2011 STATS19 specification, while others rarely used the category.
This created a comparability issue. For police forces that regularly used Other, a proportion of non-work journeys were recorded explicitly within that category. For police forces that did not routinely use Other, comparable journeys were more likely to be recorded within the unknown category.
Without further adjustment, the model would tend to overestimate work-related travel for vehicle types where substantial numbers of non-work journeys had historically been recorded as Other.
6.2 Derivation of adjustment factors
Adjustment factors were derived using years and police forces identified as active users of the Other category.
The proportion of vehicles recorded as Other was calculated separately for four vehicle groups:
- Cars
- Motorcycles
- Pedal cycles
- Other vehicles
The adjustment factor was calculated as journey purpose recorded as unknown, divided by the sum of journey purposes recorded as unknown other and unknown.
Table 6: Vehicle-specific adjustment factors
| Vehicle type | Vehicles recorded as Other | Vehicles with unknown journey purpose | Adjustment factor |
|---|---|---|---|
| Car | 171,700 | 237,394 | 0.420 |
| Motorcycle | 16,936 | 18,505 | 0.478 |
| Other | 2,417 | 8,387 | 0.224 |
| Pedal cycle | 14,839 | 22,454 | 0.398 |
The adjustment factors indicate that a substantial proportion of journeys that would otherwise have been classified as unknown were historically recorded as Other in some police forces.
The effect was particularly marked for vehicle groups with relatively large adjustment factors, indicating substantial variation in historical recording practices between police forces.
6.3 Application of the other adjustment
The adjustment was applied only to:
- collisions recorded under the 2011 STATS19 specification
- vehicle types included in the adjustment table
- police force-years that were not identified as active users of the Other category
- vehicles with an unknown journey purpose
For affected records, the estimated work probability was multiplied by (1 − adjustment factor), thereby reducing estimated work-related travel in proportion to the observed tendency for comparable journeys to be recorded as Other rather than Unknown.
This adjustment improves comparability between police forces by accounting for historical recording differences in the use of the Other category.
6.4 Adjustments for business vehicles
In addition to the statistical modelling approach, a small number of business-rule assumptions consistent with the existing DfT driving-for-work publication were applied.
The following vehicle types were assumed to be undertaking work-related journeys regardless of their recorded journey purpose:
- goods vehicles
- buses and coaches
- agricultural vehicles
- trams and light rail vehicles
In addition, taxis and vans recorded as commuting journeys were reclassified as work journeys.
These assumptions were applied after probability estimation and before the production of final vehicle, collision and casualty estimates.
7. Application of methodology
For vehicles with an unknown journey purpose, the fitted model was used to estimate the probability that the vehicle was travelling as part of work.
This approach allows partially observed information to be incorporated without requiring each vehicle to be assigned to a single category.
For example, a vehicle with an estimated probability of 0.70 would contribute 0.70 work journeys and 0.30 non-work journeys to aggregate estimates.
7.1 Estimating work-related vehicles
Estimated numbers of work-related vehicles were produced by summing the work probabilities across all vehicles where the probability that vehicle i was travelling as part of work. Estimated numbers of non-work vehicles were calculated similarly.
This probabilistic approach avoids the loss of information that would occur if probabilities were converted into simple work or non-work classifications using a fixed threshold.
Retaining the estimated probabilities avoids converting uncertain individual estimates into fixed work or non-work classifications. However, this does not capture all sources of uncertainty, including uncertainty about whether relationships observed among records with a known journey purpose also apply to records with an unknown journey purpose.
7.2 Application to collisions
The methodology produces estimates of work-related travel at the vehicle level by assigning each vehicle a probability of being on a work journey.
These vehicle-level probabilities were then used to estimate the probability that a collision was work-related.
For each collision, the probability of being work-related was calculated as the probability that at least one involved vehicle was travelling as part of work.
The collision-level probability was calculated as 1 minus the product of 1 minus the probability of the journey being a part of work across all vehicles.
This approach reflects the probability that one or more vehicles involved in the collision were travelling as part of work.
7.3 Application to casualties
Vehicle-based approach
Under the vehicle-based approach, casualties are assigned to individual vehicles and inherit the work probability of the vehicle with which they are associated.
For example, a casualty linked to a vehicle with a work probability of 0.70 would contribute 0.70 work related casualties and 0.30 non-work casualties to aggregate estimates.
This approach provides a direct link between casualties and the work related status of individual vehicles.
Collision-based approach
Under the collision-based approach, casualties inherit the probability that the collision was work related.
Collision-level probabilities were calculated using the probabilities assigned to all vehicles involved in the collision. All casualties arising from a collision were then assigned the same collision-level probability.
This approach recognises that road casualties arise from collisions rather than from individual vehicles in isolation and ensures that all casualties associated with the same collision are treated consistently.
8. Limitations
The methodology relies on relationships observed among vehicles with a known journey purpose being sufficiently representative of vehicles with an unknown journey purpose. This assumption cannot be tested directly because the true journey purpose of the unknown records is not observed.
The modelling dataset was restricted to records considered to provide a relatively consistent source of journey-purpose information. Nevertheless, journey-purpose recording practices vary between police forces and over time. The likelihood that journey purpose is recorded may also be related to characteristics that are not available within STATS19. Adjustments have been made for identified differences in the historical use of the Other category, but some residual variation in recording behaviour may remain.
Police force is included in the model, allowing the overall estimated probability of work-related travel to vary between forces. The model assumes that relationships between journey purpose and other characteristics, such as vehicle type, driver age and collision time, are broadly consistent across police forces. Local differences in these relationships may therefore not be fully captured.
Cross-validation showed that the model performed reasonably well when applied to held-out records from the population used to develop it. This provides reassurance that the model captures useful patterns among records with a known journey purpose, but does not establish how accurately it applies to records whose journey purpose is unknown.
The resulting figures should therefore be interpreted as statistical estimates rather than direct counts of work-related vehicles, collisions or casualties.
The methodology is intended to support estimates at aggregate levels. Estimates for small subgroups, individual police forces or individual records may be subject to greater uncertainty and should be interpreted with caution.
9. Annex: model validation details
Model performance was assessed using 5-fold cross-validation using vehicle records from 2016 to 2025 that formed the model training dataset. Validation results provide reassurance that the model captures useful relationships within records where journey purpose is known. However, they do not demonstrate that exactly the same relationships apply to records with an unknown journey purpose, and estimates remain subject to uncertainty arising from journey-purpose recording practices and model assumptions.
9.1 Classification performance
Overall, the validation results indicate that the model was able to distinguish reasonably well between work and non-work journeys among records included in the validation dataset.
Table A1: Classification performance measures from 5-fold cross-validation
| Measure | Value |
|---|---|
| Area under the ROC curve (AUC) | 0.848 |
| Accuracy | 0.844 |
| Positive predictive value (PPV) | 0.795 |
| Negative predictive value (NPV) | 0.858 |
| Brier score | 0.117 |
9.2 Aggregate validation
The close agreement between observed and predicted totals indicates that the model reproduced aggregate journey-purpose totals accurately within the validation dataset.
Table A2: Observed and predicted journey totals from 5-fold cross-validation
| Measure | Observed | Predicted |
|---|---|---|
| Work journeys | 126,188 | 126,185 |
| Non-work journeys | 396,444 | 396,447 |
9.3 Glossary of validation measures
Table A3: Explanation of model validation measures
| Measure | Description |
|---|---|
| Area under the ROC curve (AUC) | Measures how well the model distinguishes between work and non-work journeys across all possible classification thresholds. Values closer to 1 indicate better discrimination. |
| Accuracy | The proportion of journeys correctly classified as work or non-work using a specified classification threshold. |
| Positive predictive value (PPV) | The proportion of journeys classified as work that were recorded as work. |
| Negative predictive value (NPV) | The proportion of journeys classified as non-work that were recorded as non-work. |
| Brier score | Measures the agreement between predicted probabilities and observed outcomes. Lower values indicate better-calibrated probability estimates. |
10. Instructions for printing and saving
Depending on which browser you use and the type of device you use (such as a mobile or laptop) these instructions may vary.
Tablets and mobile devices normally have the option to “find in text” and “print or save” in their sharing or quick options menu of their browser, but this will vary by device model.
11. How to search
Select Ctrl and F on a Windows laptop or Command and F on a Mac
This will open a search box in the top right-hand corner of the page. Type the word you are looking for in the search bar and press enter.
Your browser will highlight the word, usually in yellow, wherever it appears on the page. Press enter to move to the next place it appears.
12. Contact details
Road safety statistics
Email roadacc.stats@dft.gov.uk
To hear more about DfT statistical publications as they are released, follow us on X (formerly known as Twitter) at DfTstats.