Reported road casualties Great Britain: estimates involving driving for work (new approach)
Updated 24 September 2026

© Crown copyright 2026
This publication is licensed under the terms of the Open Government Licence v3.0 except where otherwise stated. To view this licence, visit nationalarchives.gov.uk/doc/open-government-licence/version/3 or write to the Information Policy Team, The National Archives, Kew, London TW9 4DU, or email: psi@nationalarchives.gov.uk.
Where we have identified any third party copyright information you will need to obtain permission from the copyright holders concerned.
This publication is available at https://www.gov.uk/government/statistics/reported-road-casualties-great-britain-involving-driving-for-work/reported-road-casualties-great-britain-estimates-involving-driving-for-work-new-approach
About this factsheet
These statistics present estimates of the number of vehicles, collisions and casualties involving driving for work in Great Britain between 2016 and 2025.
Driving for work refers to journeys undertaken as part of work activity and excludes travel between home and a usual place of work (commuting).
Information on journey purpose of vehicles involved in reported road collisions, including recording where a journey is made as part of work, has been recorded in STATS19 since 2005. Figures are shown in table RAS0506.
Journey purpose information is not known for all vehicles recorded in STATS19. To account for this, estimates are produced using recorded journey purpose information together with a statistical model used to estimate the likelihood that vehicles with an unknown journey purpose were travelling for work.
The full methodology used to produce these estimates is available in the accompanying methodology publication.
Statistics in development
These statistics are being published alongside existing estimates of work-related collisions as official statistics in development. It is intended that the updated method will be adopted for publication of the 2026 statistics in summer 2027, subject to further quality assurance of the new method and any feedback from users of the statistics, which can be provided by email to the team using the contact details below.
1. Main findings
In 2025, an estimated:
-
583 people were killed in collisions involving driving for work, a decrease of 25% compared with 2016.
-
24% of vehicles involved in reported injury collisions were travelling for work.
-
37% of reported injury collisions involved at least one vehicle travelling for work, equivalent to 37,456 collisions.
-
9,804 people were killed or seriously injured (KSI) in collisions involving at least one driver travelling for work.
-
2,528 drivers and riders travelling for work were killed or seriously injured in reported road collisions.
-
1,902 pedestrians were KSI in collisions involving driving for work.
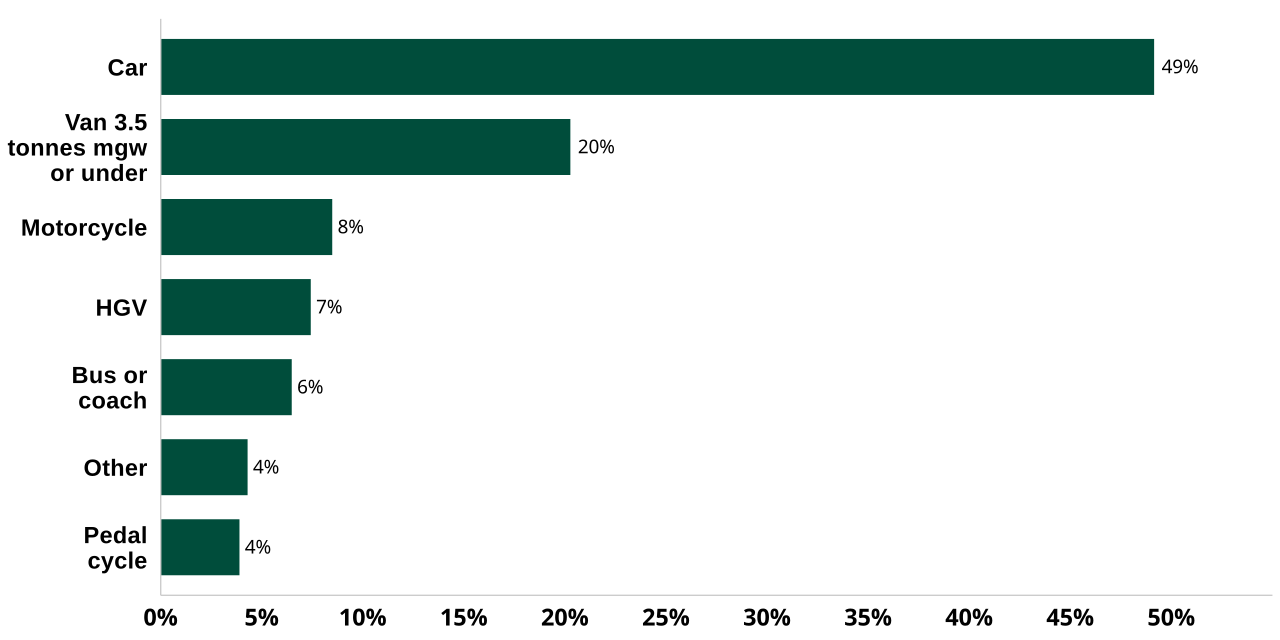
Cars accounted for 49% of all vehicles in collisions that were estimated to be travelling for work, while vans and motorcycles accounted for 20% and 8% respectively.
Driving for work collisions were more common on weekdays than at weekends, with an average of 41% of reported injury collisions involving driving for work on weekdays compared with 30% at weekends.
2. Introduction
The purpose of this analysis is to improve understanding of the scale and characteristics of road casualties involving driving for work. Information on journey purpose is collected within STATS19 road collision records; however, a substantial proportion of records contain unknown or incomplete journey purpose information. As a result, using the recorded journey purpose variable alone is likely to underestimate the true number of collisions and casualties involving people driving as part of their work.
To address these limitations, a statistical model was developed to identify vehicles and casualties that were likely to be associated with driving for work. The model uses STATS19 vehicle and driver records and applies a series of rule-based classifications based on vehicle type, journey purpose and casualty circumstances. The approach is designed to provide a more representative estimate of work-related road risk while maintaining consistency.
Several adjustments and assumptions were applied during the modelling process. To improve consistency in recording practices between police forces, records with ambiguous or incomplete journey purpose data were standardised using a common set of classification rules. Heavy goods vehicles (HGVs), buses, agricultural vehicles and trams were assumed to be travelling for work regardless of their recorded journey purpose. In addition, taxis and vans recorded as undertaking a commuting journey were reclassified as work-related journeys.
The full methodology can be found here.
3. Overall trends
3.1 Vehicles travelling for work
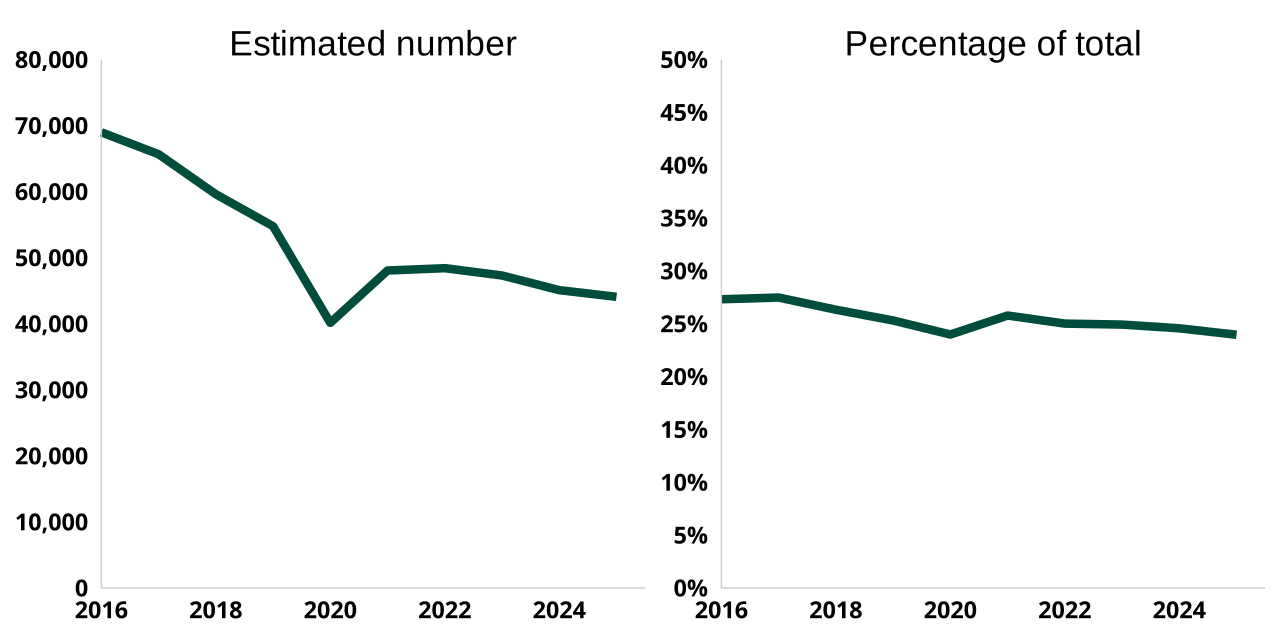
An estimated 44,072 vehicles involved in reported injury collisions in 2025 were travelling for work. This represented 24% of all vehicles involved in reported injury collisions.
The proportion of vehicles involved in reported injury collisions that were travelling for work remained relatively stable between 2016 and 2025.
Throughout most of the period, approximately one-quarter of vehicles involved in reported injury collisions were estimated to be travelling for work.
A decline was observed in 2020, corresponding with the reduction in travel associated with the COVID-19 pandemic.
Figure 1: Estimated number and proportion of vehicles involved in reported injury collisions travelling for work, Great Britain, 2016 to 2025
3.2 Collisions involving driving for work
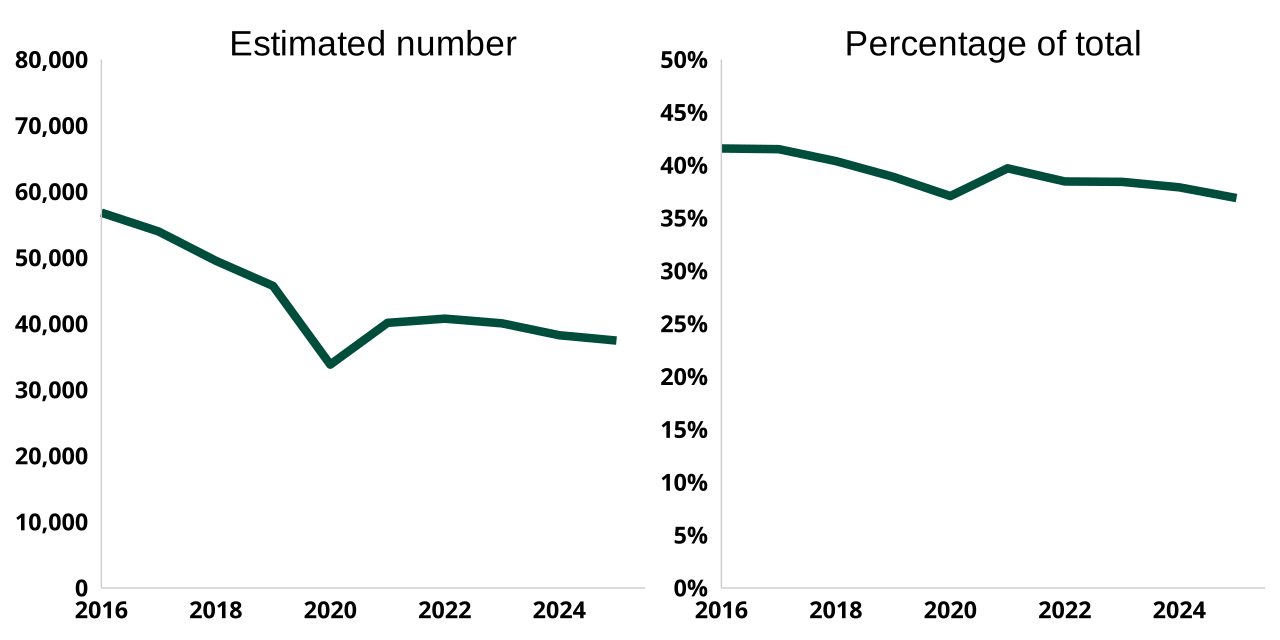
In 2025, an estimated 37,456 reported injury collisions involved at least one vehicle travelling for work. This represented 37% of all reported injury collisions. The proportion of reported injury collisions involving driving for work remained relatively stable throughout 2016 to 2025.
Figure 2: Estimated number and proportion of reported injury collisions involving driving for work, Great Britain, 2016 to 2025
3.3 Casualties involving driving for work
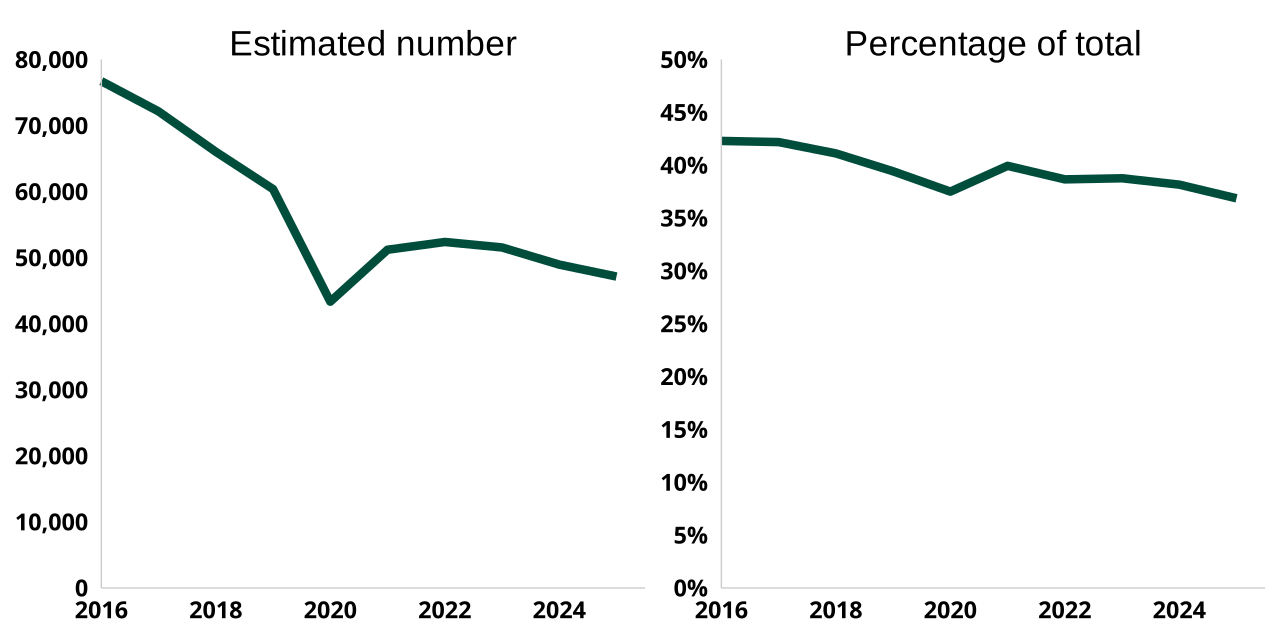
In 2025, an estimated 47,147 casualties occurred in collisions involving at least one vehicle driving for work. This represented 37% of all reported road casualties.
The estimated number of casualties involving driving for work fell by 39% between 2016 and 2025.
Figure 3: Estimated number and proportion of casualties occurring in collisions involving driving for work, Great Britain, 2016 to 2025
3.4 Casualty severity
Table 1 shows estimated casualties occurring in collisions involving at least one driver travelling for work.
In 2025, collisions involving driving for work resulted in 9,804 killed or seriously injured (KSI) casualties.
Driving for work was associated with 38% of all road fatalities and 33% of all serious casualties in 2025.
Compared with 2016, the estimated number of people killed or seriously injured in collisions involving driving for work fell by 15.7%.
Table 1: Estimated casualties occurring in collisions involving driving for work by severity, Great Britain, 2016 to 2025
| Year | Fatal | Serious | Slight | % fatal | % serious | % slight |
|---|---|---|---|---|---|---|
| 2016 | 778 | 10,854 | 65,091 | 43.4 | 37.0 | 43.3 |
| 2017 | 763 | 10,364 | 61,013 | 42.5 | 36.5 | 43.3 |
| 2018 | 765 | 10,371 | 54,895 | 42.9 | 35.9 | 42.2 |
| 2019 | 738 | 9,827 | 49,816 | 42.1 | 35.1 | 40.4 |
| 2020 | 576 | 7,163 | 35,609 | 39.5 | 32.9 | 38.6 |
| 2021 | 642 | 8,660 | 41,904 | 41.2 | 34.9 | 41.2 |
| 2022 | 669 | 9,236 | 42,474 | 39.1 | 33.9 | 39.9 |
| 2023 | 636 | 9,301 | 41,613 | 39.2 | 34.0 | 40.0 |
| 2024 | 615 | 9,272 | 39,064 | 38.4 | 34.0 | 39.3 |
| 2025 | 583 | 9,221 | 37,342 | 37.9 | 32.5 | 38.1 |
4. Drivers travelling for work
Table 2 presents estimated casualties among drivers and riders who were themselves travelling for work.
In 2025, an estimated 14,321 drivers and riders travelling for work were injured in reported road collisions.
This included 2,528 drivers and riders who were killed or seriously injured.
Compared with 2016, the number of drivers and riders travelling for work who were injured in reported road collisions fell by 41%.
Table 2: Estimated casualties among drivers and riders travelling for work, Great Britain, 2016 to 2025
| Year | Fatal | Serious | Slight |
|---|---|---|---|
| 2016 | 176 | 3,110 | 20,996 |
| 2017 | 167 | 2,946 | 19,633 |
| 2018 | 149 | 2,868 | 17,221 |
| 2019 | 140 | 2,696 | 15,857 |
| 2020 | 115 | 2,090 | 12,039 |
| 2021 | 134 | 2,651 | 14,618 |
| 2022 | 141 | 2,558 | 14,685 |
| 2023 | 132 | 2,534 | 14,257 |
| 2024 | 126 | 2,541 | 13,065 |
| 2025 | 109 | 2,419 | 11,793 |
4.1 Drivers and passengers travelling for work
Table 3 shows the estimated number of drivers, riders and passengers who were travelling as part of work.
In 2025, an estimated 3,364 drivers, riders and passengers travelling for work were killed or seriously injured in reported road collisions. Compared with 2016, this represents a decrease of 24%.
Table 3: Estimated casualties among drivers, riders and passengers travelling for work, Great Britain, 2016 to 2025
| Year | Fatal | Serious | Slight |
|---|---|---|---|
| 2016 | 223 | 4,180 | 31,252 |
| 2017 | 215 | 3,967 | 29,529 |
| 2018 | 198 | 3,883 | 25,829 |
| 2019 | 187 | 3,612 | 23,063 |
| 2020 | 146 | 2,621 | 16,259 |
| 2021 | 179 | 3,340 | 19,536 |
| 2022 | 177 | 3,369 | 19,944 |
| 2023 | 162 | 3,443 | 19,660 |
| 2024 | 159 | 3,423 | 17,957 |
| 2025 | 136 | 3,228 | 16,274 |
5. Pedestrians injured in driving for work collisions
Table 4 shows estimated pedestrian casualties occurring in collisions involving driving for work.
In 2025, an estimated 6,001 pedestrians were injured in collisions involving driving for work.
This included 1,902 pedestrians who were killed or seriously injured.
Compared with 2016, pedestrian casualties occurring in collisions involving driving for work fell by 23%.
Table 4: Estimated pedestrian casualties occurring in collisions involving driving for work, Great Britain, 2016 to 2025
| Year | Fatal | Serious | Slight |
|---|---|---|---|
| 2016 | 200 | 2,107 | 5,509 |
| 2017 | 209 | 2,135 | 5,709 |
| 2018 | 186 | 2,053 | 5,030 |
| 2019 | 193 | 1,994 | 4,723 |
| 2020 | 148 | 1,272 | 2,976 |
| 2021 | 161 | 1,501 | 3,571 |
| 2022 | 168 | 1,739 | 3,875 |
| 2023 | 172 | 1,806 | 3,819 |
| 2024 | 163 | 1,702 | 3,840 |
| 2025 | 151 | 1,751 | 4,099 |
6. Vehicle types involved in driving for work
Figure 4 shows the distribution of vehicle types estimated to be travelling for work and involved in reported injury collisions between 2021 and 2025.
Car accounted for 43% of all vehicles estimated to be travelling for work.
The next largest vehicle categories were Van 3.5 tonnes mgw or under and Motorcycle, accounting for 20% and 8% of work-related vehicles respectively.
This highlights the range of vehicle types that can be involved in work-related collisions.
Figure 4: Vehicle types estimated to be travelling for work and involved in reported injury collisions, Great Britain, 2021 to 2025
7. Driver demographics
7.1 Age of driver involved
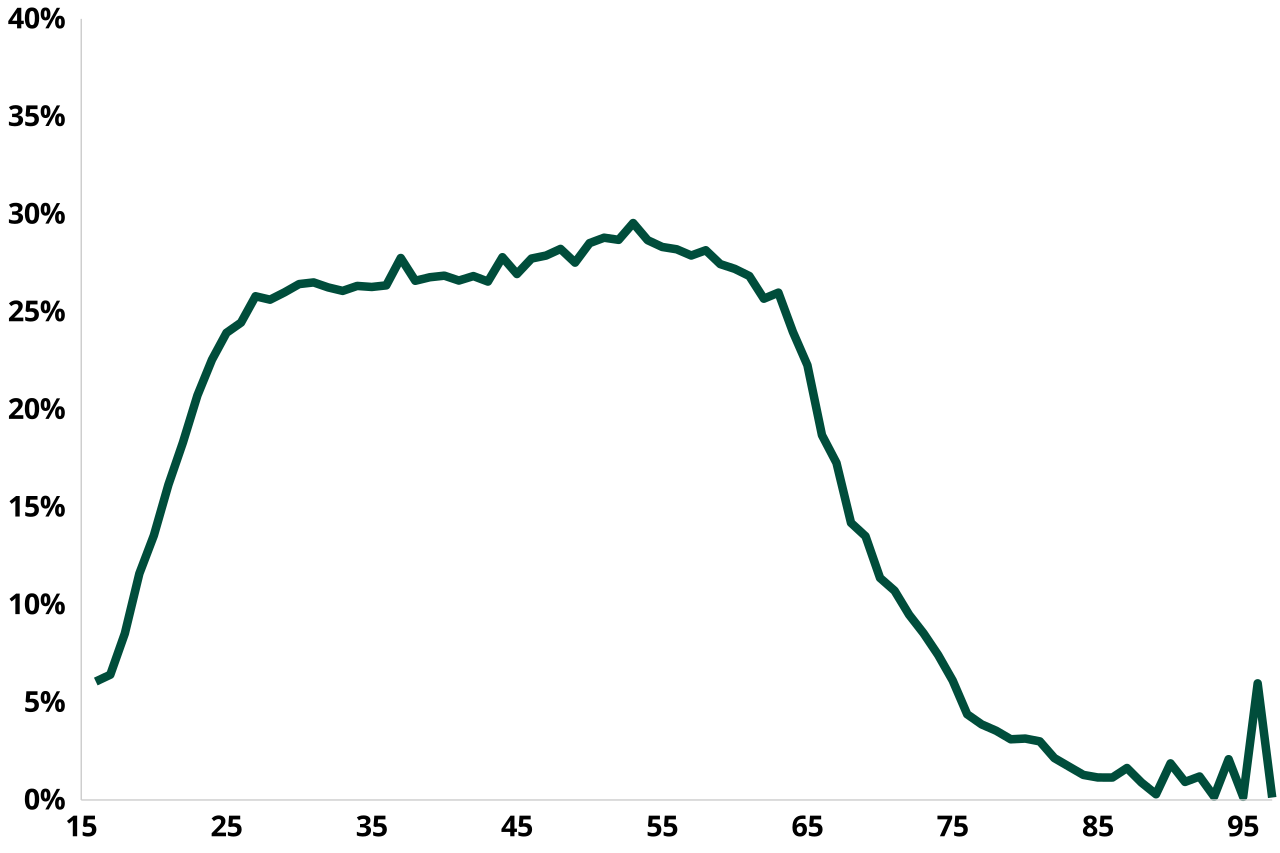
The proportion of drivers involved in reported injury collisions who were travelling for work varied substantially by age.
Among drivers aged 25 to 64, an average of 27% were estimated to be travelling for work, compared with 15% of drivers aged 17 to 24.
The proportion was considerably lower among older drivers. Among drivers aged 75 and over, only around 3% were estimated to be travelling for work.
The highest proportions were observed among drivers in their late 40s and 50s, peaking at approximately 32%.
Figure 5: Estimated proportion of drivers involved in reported injury collisions who were travelling for work, by driver age, Great Britain, 2021 to 2025
7.2 Driver home postcode deprivation
These statistics have been calculated using the 2019 English indices of deprivation.
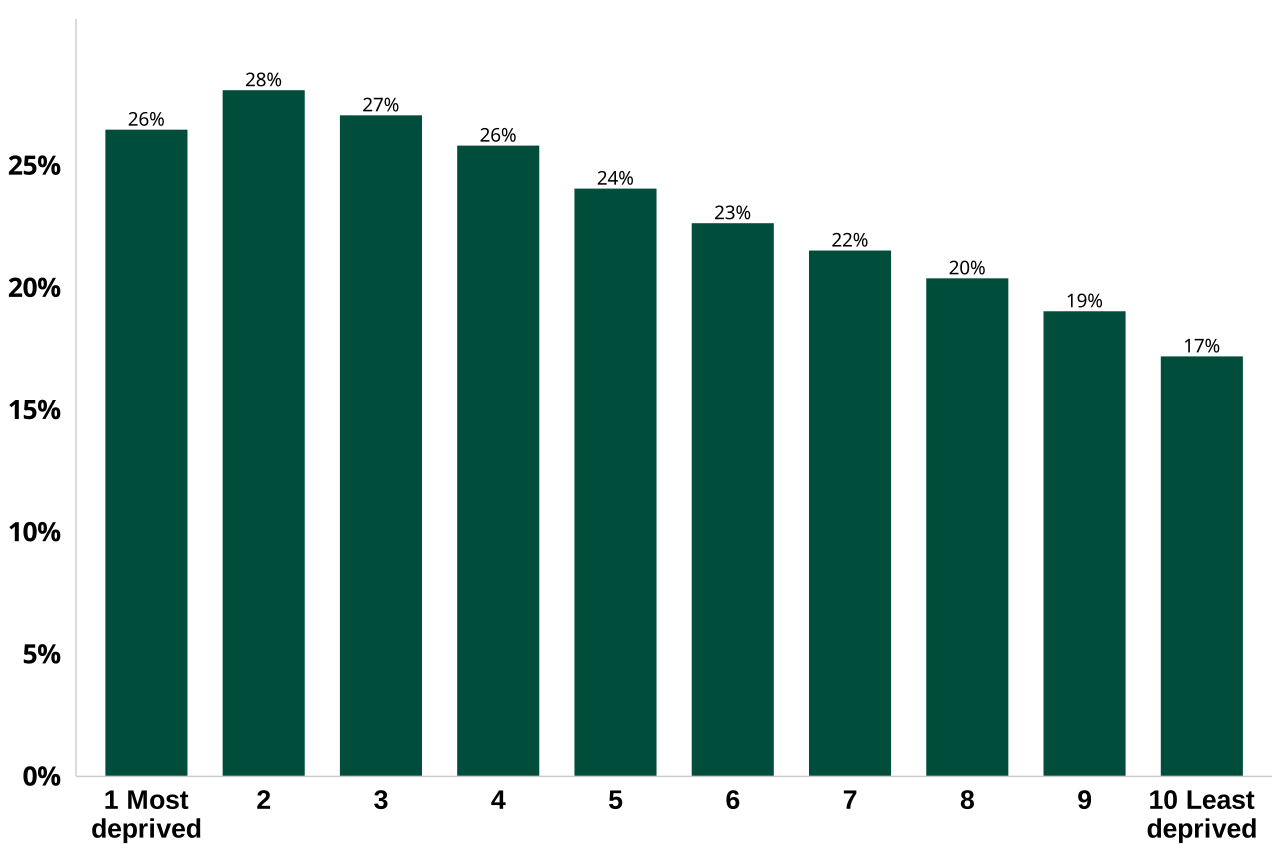
Overall, the estimated prevalence of driving for work generally decreased as area deprivation decreased.
The highest proportions were observed among drivers living in more deprived areas. Approximately 26.5% of vehicles associated with drivers living in the most deprived decile were estimated to be travelling for work, compared with 17.2% among those living in the least deprived decile.
Figure 6: Estimated proportion of vehicles involved in reported injury collisions travelling for work, by driver area deprivation (Index of Multiple Deprivation decile), England, 2021 to 2025
8. When do driving-for-work collisions occur?
8.1 Day of week
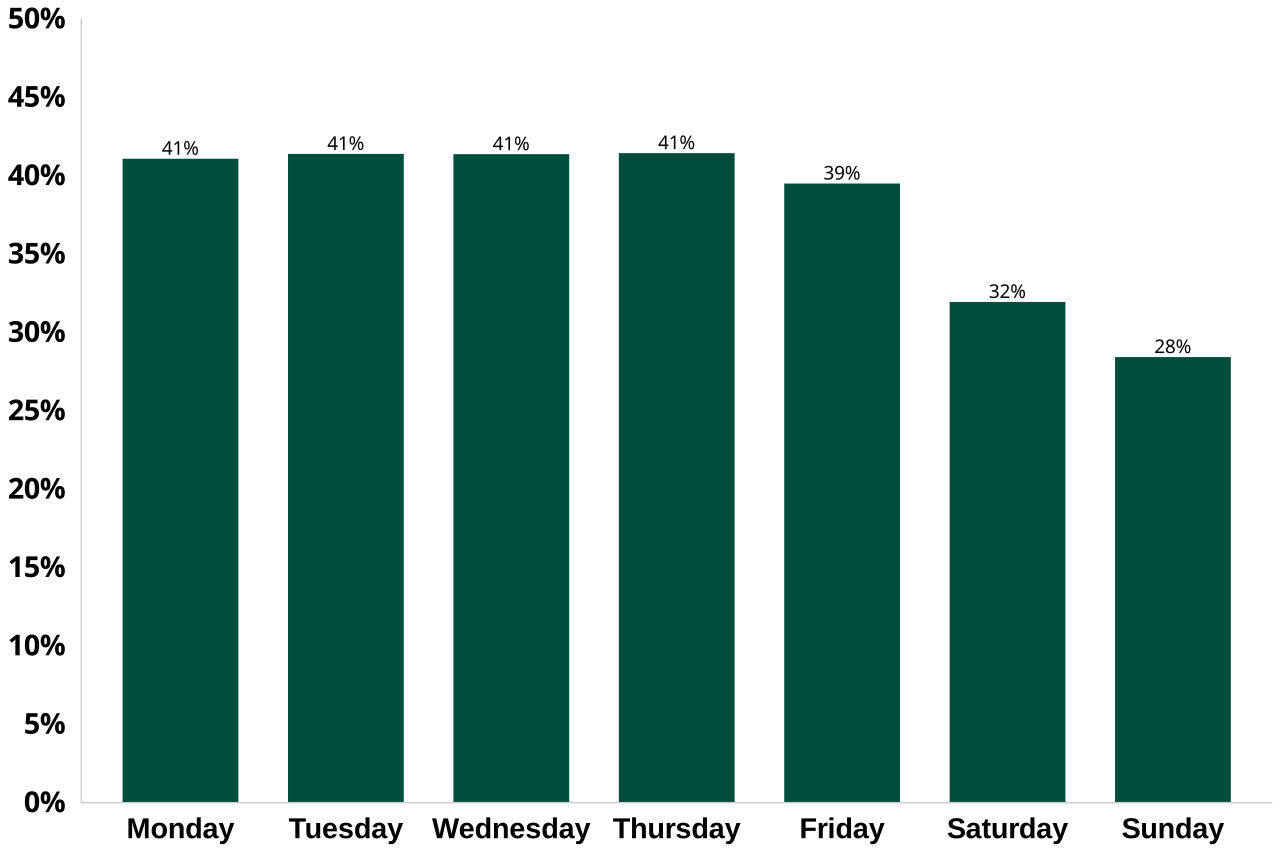
Driving for work collisions were considerably more common on weekdays than at weekends.
Between Monday and Friday, an average of 41% of reported injury collisions involved driving for work. This compared with 30% at weekends.
The lower prevalence at weekends likely reflects the concentration of work related travel during the working week.
Figure 7: Estimated proportion of reported injury collisions involving driving for work by day of week, Great Britain, 2021 to 2025
8.2 Time of day
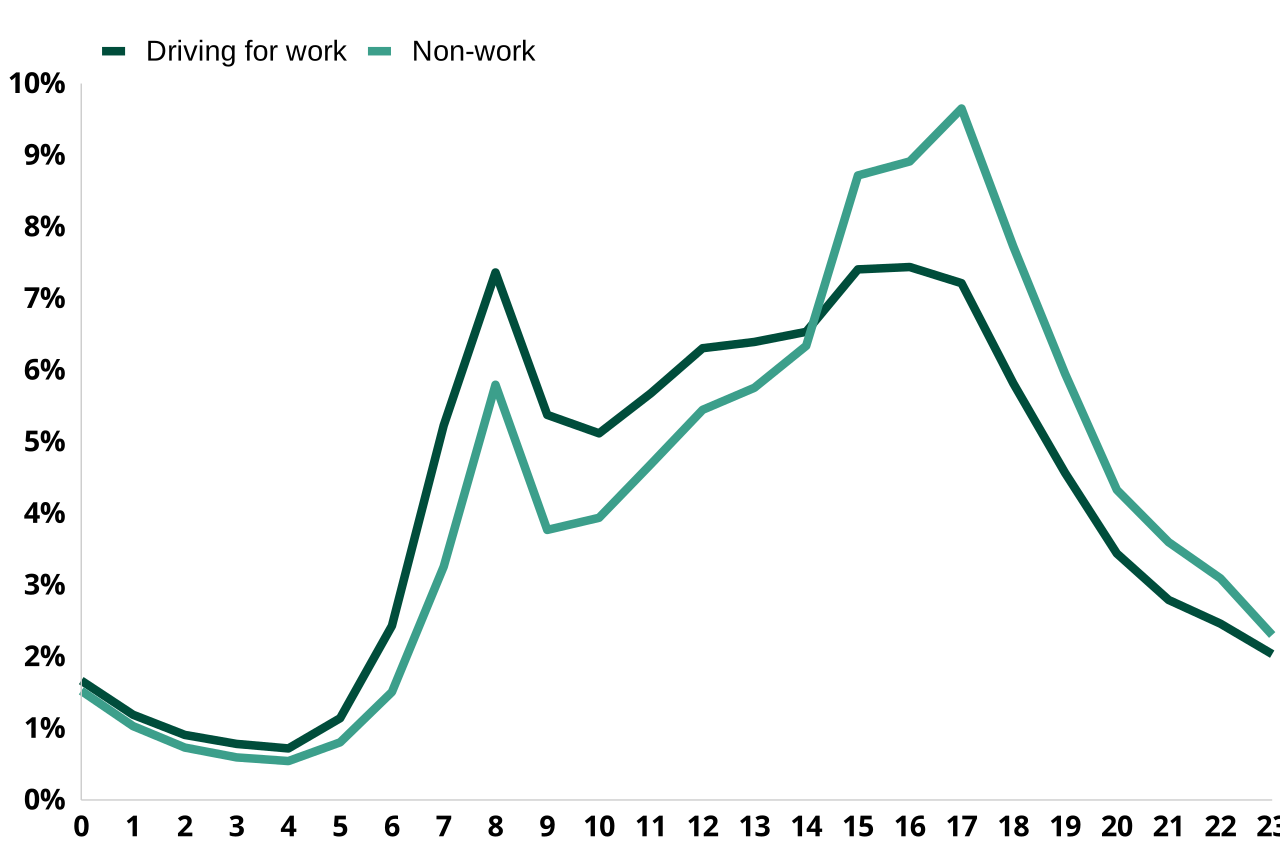
The timing of collisions differed between journeys undertaken for work and those undertaken for non-work purposes.
Driving for work collisions were more concentrated during the morning and daytime period. The proportion of work related collisions increased rapidly from around 06:00 and remained relatively high throughout the working day.
By comparison, non-work collisions were more concentrated during the afternoon and early evening. The non-work series shows a pronounced peak during the afternoon period, whereas work related collisions are distributed more evenly across the daytime hours.
The difference between the two series was largest during the morning period, when collisions involving driving for work accounted for a greater share of collisions than non-work journeys.
Figure 8: Distribution of driving for work and non-work collisions by hour of day, Great Britain, 2021 to 2025
8.3 Instructions for printing and saving
Depending on which browser you use and the type of device you use (such as a mobile or laptop) these instructions may vary.
Tablets and mobile devices normally have the option to “find in text” and “print or save” in their sharing or quick options menu of their browser, but this will vary by device model.
9. How to search
Select Ctrl and F on a Windows laptop or Command and F on a Mac
This will open a search box in the top right-hand corner of the page. Type the word you are looking for in the search bar and press enter.
Your browser will highlight the word, usually in yellow, wherever it appears on the page. Press enter to move to the next place it appears.
10. Contact details
Road safety statistics
Email roadacc.stats@dft.gov.uk