Public spending statistics: November 2022
Updated 24 November 2022

© Crown copyright 2022
This publication is licensed under the terms of the Open Government Licence v3.0 except where otherwise stated. To view this licence, visit nationalarchives.gov.uk/doc/open-government-licence/version/3 or write to the Information Policy Team, The National Archives, Kew, London TW9 4DU, or email: psi@nationalarchives.gov.uk.
Where we have identified any third party copyright information you will need to obtain permission from the copyright holders concerned.
This publication is available at https://www.gov.uk/government/statistics/public-spending-statistics-release-november-2022/public-spending-statistics-november-2022
1. About this release
This release presents updated Public Spending data for the years 2017-18 to 2021-22. All data in this release are National Statistics and are on an outturn basis. TME figures are consistent with data published by the ONS in October 2022. All data and further background detail can be found in the accompanying tables published alongside this release. We welcome any feedback at pesa.document@hmtreasury.gov.uk
2. Total expenditure (£billions)
| Expenditure | 2020-21 | 2021-22 |
|---|---|---|
| Total DEL expenditure | 565.9 | 544.8 |
| Resource departmental AME | 493.0 | 622.8 |
Budgets are divided into Departmental Expenditure Limits (DEL), which are firm plans for three or four years, and Annually Managed Expenditure (AME), covering spending which is demand-led, less predictable and more difficult to control. In the accompanying excel tables, table 1 shows the aggregate position for all departments and all types of spending, with some of the main types of spending shown separately. Table 8 shows in detail how the budgeting data is used to construct the Total Managed Expenditure (TME) figures published by the Office for National Statistics. These are based on National Accounts concepts and are used in the aggregates which underlie the government’s fiscal policy.
| Expenditure | 2020-21 | 2021-22 |
|---|---|---|
| Total Managed Expenditure (TME) | 1,106.6 | 1,047.3 |
| Total expenditure on services (TES) | 1,011.3 | 953.9 |
- TME was £1,047.3 billion in 2021-22, a decrease of 5.4 per cent on the previous year.
- TES was £953.9 billion in 2021-22, a decrease of 5.7 per cent on the previous year.
3. Total Departmental Expenditure Limits, 2021-22 (£millions)
For the full table, including years from 2017-18 onward, please refer to Table 7 in the accompanying budget tables excel.
| Departmental Group | Total DEL |
|---|---|
| Health and Social Care | 189,758 |
| Education | 75,681 |
| Home Office | 15,295 |
| Justice | 10,187 |
| Law Officers’ Departments | 682 |
| Defence | 45,929 |
| Single Intelligence Account | 3,356 |
| Foreign, Commonwealth and Development Office | 9,282 |
| DLUHC - Housing and Communities | 9,001 |
| DLUHC - Local Government | 21,262 |
| Transport | 29,728 |
| Business, Energy and Industrial Strategy | 28,354 |
| Digital, Culture, Media and Sport | 2,530 |
| Environment, Food and Rural Affairs | 5,541 |
| International Trade | 520 |
| Work and Pensions | 9,344 |
| HM Revenue and Customs | 6,185 |
| HM Treasury | 411 |
| Cabinet Office | 1,439 |
| Scotland | 42,247 |
| Wales | 19,455 |
| Northern Ireland | 15,942 |
| Small and Independent Bodies | 2,702 |
3.1 Budgeting Statistics (Tables 1 to 9)
- Total DEL expenditure (Resource DEL excluding depreciation plus Capital DEL) was £544.8 billion in 2021-22, a decrease of £21.1 billion or 3.7 per cent on the previous year in nominal terms. The largest decrease in DEL spending in nominal terms in 2021-22 was for Business, Energy and Industrial Strategy, which was down by £14.3 billion to £28.4 billion. This decrease is largely a result of expenditure related to Covid-19 measures falling in 2021-22. The largest increase in DEL spending in nominal terms in 2021-22 was for Defence, which increased by £3.6 billion to £45.9 billion.
- Total departmental expenditure (Total DEL plus resource and capital departmental AME) was £1,185.6 billion in 2021-22, an increase of £89.3 billion or 8.1 per cent on the previous year.
- Resource departmental AME was £622.8 billion in 2021-22, an increase from £493.0 billion in 2020-21. The largest increase in resource departmental AME spending in nominal terms in 2021-22 was for Business, Energy and Industrial Strategy, which was up by £122.8 billion to £114.9 billion. This mainly reflected higher provisions for the Nuclear Decommissioning Authority (NDA) in 2021-22. In the accompanying excel tables, tables 1 to 9 show central government departmental spending on a budgetary basis. These are the aggregates used by the government to plan and control expenditure. They cover departments’ own spending as well as support to local government and public corporations. They are consistent with “Estimates” voted by Parliament and broadly consistent with departmental Resource Accounts, which are based on commercial International Financial Reporting Standards (IFRS) adapted for the public sector.
4. Real terms public expenditure (£billions)
| Functions | 2020-21 | 2021-22 |
|---|---|---|
| General public services | 71.5 | 109.1 |
| Defence | 44.4 | 48.7 |
| Public order and safety | 38.7 | 42.4 |
| Economic affairs | 195.1 | 96.6 |
| Environment protection | 12.9 | 13.6 |
| Housing and community amenities | 13.6 | 15.4 |
| Health | 217.5 | 217.3 |
| Recreation, culture and religion | 12.9 | 12.9 |
| Education | 95.1 | 99.4 |
| Social protection | 297.9 | 300.4 |
In the accompanying excel tables, tables 10 to 11 present spending under the “expenditure on services” framework. This is based on National Accounts definitions and covers the whole of the public sector. It therefore has wider coverage than the budgeting framework and is also more stable over time.
4.1 Trends in functional expenditure (Tables 10, 10a and 10b)
Compared with the previous year:
- in real terms, spending in eight of the ten functions (excluding EU transactions) for 2021-22 increased whilst spending in two functions fell, compared to 2020-21.
- the largest real terms percentage increase was in general public services (52.6 per cent), mainly as a result of an increase in public sector debt interest.
- the largest real terms percentage decrease in spending was in economic affairs (-50.5 per cent), mainly due to lower expenditure on covid-19 related measures.
- spending on health shows a nominal and real terms decrease in 2021-22 (0.6 per cent in nominal terms and 0.1 per cent in real terms). This is due to higher levels of expenditure in health for 2020-21, which was largely related to covid-19 measures.
In the accompanying excel tables, tables 10, 10a and 10b show public sector expenditure on services broken down by function over a longer number of years, allowing long-term trends to be identified. Table 11 presents data broken down by economic categories such as pay or grants.
5. National Statistics
The United Kingdom Statistics Authority has designated these statistics as National Statistics, in accordance with the Statistics and Registration Service Act 2007 and signifying compliance with the Code of Practice for Official Statistics. Designation can be broadly interpreted to mean that the statistics:
- meet identified user needs
- are well explained and readily accessible
- are produced according to sound methods
- are managed impartially and objectively in the public interest
Once statistics have been designated as National Statistics it is a statutory requirement that the Code of Practice shall continue to be observed.
6. Spending frameworks used in HM Treasury spending publications
| Budgeting | Expenditure on services (TES) |
|---|---|
| This framework provides information on central government departmental budgets, which are the aggregates used by the government to plan and control expenditure. It covers departmental own spending as well as support to local government and public corporations. | This framework is used in HM Treasury publications for statistical analysis. It is based on National Accounts definitions and covers spending by the whole of the public sector. It therefore has wider coverage than the budgeting framework and is also more stable over time. |
7. Trends in public spending
7.1 Chart 1: Trends in public spending since 1998-99
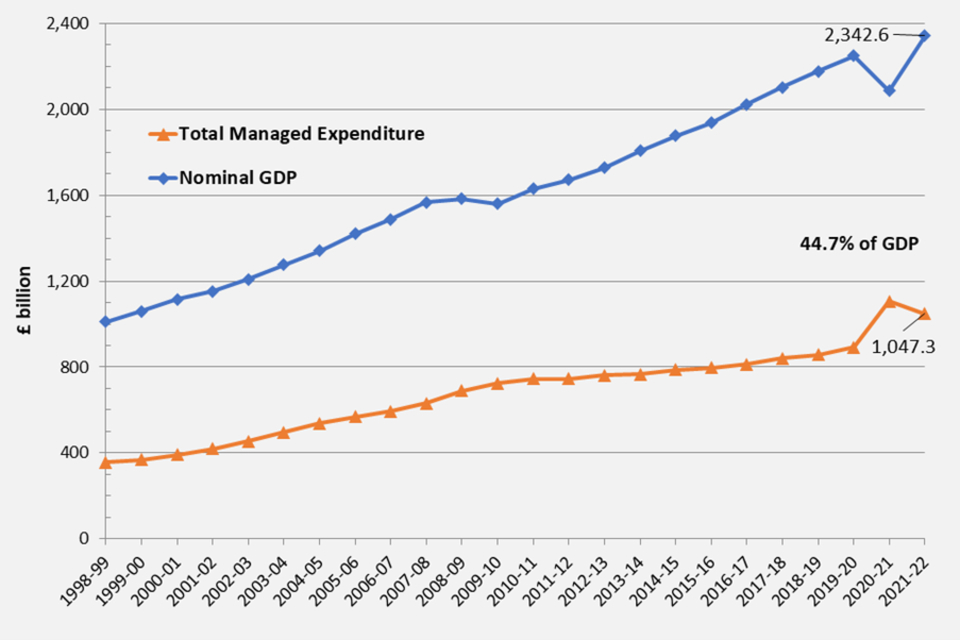
Line graph showing trends in public spending in real terms according to the UN-defined Classification of the Functions of Government (COFOG) framework.
- TME as a percentage of GDP, which shows the size of the public sector relative to the size of the whole economy, was 44.7 per cent in 2021-22, which was a decrease of 8.3 per centage points when compared to 2020-21. Figures for 2020-21 show the highest percentage (53.0 per cent) in the period covered by these tables (from 1998-99), reflecting not only increased spending, but also lower GDP as the economy entered recession during the Covid-19 pandemic.
7.2 Chart 2: Real terms trends in Public Spending
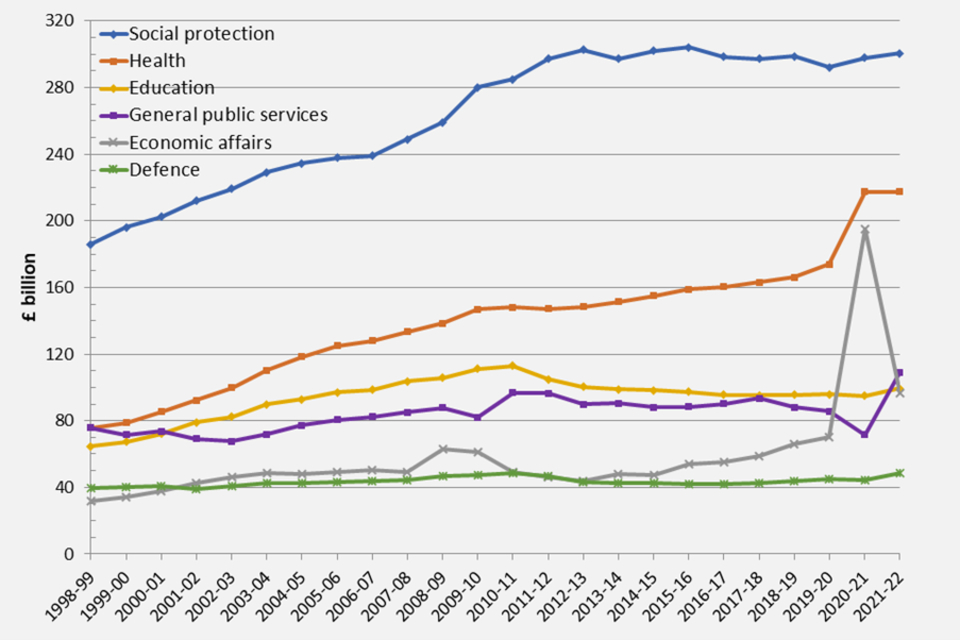
Line graph showing trends in public spending in real terms according to the UN-defined Classification of the Functions of Government (COFOG) framework.
From 2011-12 onwards the ‘grant-equivalent element of student loans’ is no longer part of the TES framework and has therefore been removed from the Education function. Therefore, figures are not directly comparable between 2010-11 and 2011-12. A full explanation of this decision can be found in PESA 2016 Annex E.
8. Revisions in this release (since the July 2022 publication)
There are no updates to departmental expenditure in this release compared to July 2022. Local government data has been updated to include new data for England, Wales and Northern Ireland.
Changes to Total Managed Expenditure (TME) and public sector debt interest in all years are due to updated ONS data. More information about these changes is available in the monthly ONS public sector finances (PSF) release.
9. Additional information about the PSS release
9.1 Upcoming revisions and changes in forthcoming releases
The next HM Treasury PSS National Statistics release will be published in February 2023. There are no expected changes to the spending frameworks for the next release.
9.2 PSS publication schedule for the coming year
| Date | Release |
|---|---|
| Feb 2023 | This release contains updates to the key Public Spending Statistics series. It includes updated data for local authorities for the previous financial year. |
| May 2023 | Contains updates to the PSS series. May is the first publication in which full outturn data for the previous financial year is published, incorporating final data for all local authorities and devolved administrations. |
| July 2023 | The July PSS release contains the first publication of departmental spending outturn for the 2022-23 financial year. Local authority data and much of the data from the devolved administrations are still provisional at this stage of the year. This is the main annual release. |
9.3 GDP deflators and money GDP
Real terms figures are the nominal figures adjusted to 2021-22 price levels using GDP deflators from the Office for National Statistics (released 30 September 2022).
| Financial year | GDP deflator at market prices (2021-22 = 100) | % per cent change on previous year | Money GDP (£millions) |
|---|---|---|---|
| 2017-18 | 90.416 | 1.67 | 2,102,925 |
| 2018-19 | 92.032 | 1.79 | 2,177,222 |
| 2019-20 | 94.425 | 2.60 | 2,249,423 |
| 2020-21 | 100.476 | 6.41 | 2,086,540 |
| 2021-22 | 100.000 | -0.47 | 2,342,564 |
GDP Deflator: Financial years 2017-18 to 2021-22 taken from ONS series L8GG in Table N.