Public spending statistics: May 2026
Published 21 May 2026

© Crown copyright 2026
This publication is licensed under the terms of the Open Government Licence v3.0 except where otherwise stated. To view this licence, visit nationalarchives.gov.uk/doc/open-government-licence/version/3 or write to the Information Policy Team, The National Archives, Kew, London TW9 4DU, or email: psi@nationalarchives.gov.uk.
Where we have identified any third party copyright information you will need to obtain permission from the copyright holders concerned.
This publication is available at https://www.gov.uk/government/statistics/public-spending-statistics-release-may-2026/public-spending-statistics-may-2026
About this release
This release presents updated Public Spending data for the years 2020-21 to 2024-25. All data in this release are accredited official statistics and are on an outturn basis. TME figures are consistent with data published by the ONS in April 2026. All data and further background detail can be found in the accompanying tables published alongside this release. We welcome any feedback at pesa.document@hmtreasury.gov.uk
Total expenditure (£billions)
| Expenditure | 2023-24 | 2024-25 |
|---|---|---|
| Total DEL expenditure | 558.9 | 595.9 |
| Resource departmental AME | 465.8 | 538.2 |
Budgets are divided into Departmental Expenditure Limits (DEL), which are firm plans for three or four years, and Annually Managed Expenditure (AME), covering spending which is demand-led, less predictable and more difficult to control. In the accompanying excel tables, table 1 shows the aggregate position for all departments and all types of spending, with some of the main types of spending shown separately. Table 7 shows in detail how the budgeting data is used to construct the Total Managed Expenditure (TME) figures published by the Office for National Statistics. These are based on National Accounts concepts and are used in the aggregates which underlie the government’s fiscal policy.
| Expenditure | 2023-24 | 2024-25 |
|---|---|---|
| Total Managed Expenditure (TME) | 1,230.7 | 1,290.6 |
| Total expenditure on services (TES) | 1,114.7 | 1,166.3 |
- TME was £1,290.6 billion in 2024-25, an increase of 4.9 per cent on the previous year.
- TES was £1,166.3 billion in 2024-25, an increase of 4.6 per cent on the previous year.
Total Departmental Expenditure Limits, 2024-25 (£millions)
For the full table, including years from 2020-21 onward, please refer to Table 6 in the accompanying budget tables excel.
| Departmental Group | Total DEL |
|---|---|
| Health and Social Care | 204,710 |
| Education | 90,409 |
| Home Office | 19,235 |
| Justice | 12,661 |
| Law Officers’ Departments | 936 |
| Defence | 60,238 |
| Single Intelligence Account | 4,461 |
| Foreign, Commonwealth and Development Office | 10,916 |
| MHCLG – Local Government | 11,330 |
| MHCLG – Housing and Communities | 12,813 |
| Culture, Media and Sport | 2,020 |
| Science, Innovation and Technology | 13,702 |
| Transport | 28,457 |
| Energy Security and Net Zero | 6,665 |
| Environment, Food and Rural Affairs | 7,245 |
| Business and Trade | 1,974 |
| Work and Pensions | 14,081 |
| HM Revenue and Customs | 5,866 |
| HM Treasury | 1,099 |
| Cabinet Office | 882 |
| Scottish Government | 45,217 |
| Welsh Government | 20,190 |
| Northern Ireland Executive | 17,625 |
| Small and Independent Bodies | 3,139 |
Budgeting Statistics (Tables 1 to 8)
- Total DEL expenditure (Resource DEL plus Capital DEL) was £595.9 billion in 2024-25, an increase of £37.0 billion or 6.6 per cent on the previous year in nominal terms. The largest increase in DEL spending in nominal terms in 2024-25 was for Health which increased by £16.1 billion, largely due to higher expenditure on the NHS. The largest decrease in DEL spending in nominal terms in 2024-25 was for Transport, which was down by £1.5 billion to £28.4 billion. This decrease is largely a result of lower expenditure on various Transport related programmes including High Speed Two and Transport for London (TfL) grants.
- Total departmental expenditure (Total DEL plus resource and capital departmental AME) was £1,200.4 billion in 2024-25, an increase of £99.4 billion or 9.0 per cent on the previous year.
- Resource departmental AME was £538.2 billion in 2024-25, an increase from £465.8 billion in 2023-24. The largest increases in resource departmental AME spending in nominal terms in 2024-25 were for Energy Security and Net Zero and Work and Pensions, which were up by £22.5 billion and £21.6 billion respectively. For Energy, Security and Net Zero, this mainly reflected the larger reduction in provisions for the Nuclear Decommissioning Authority (NDA) in 2023-24. For Work and Pensions this reflected an increase in welfare including higher expenditure on the State Pension and Universal Credit.
In the accompanying excel tables, tables 1 to 8 show central government departmental spending on a budgetary basis. These are the aggregates used by the government to plan and control expenditure. They cover departments’ own spending as well as support to local government and public corporations. They are consistent with “Estimates” voted by Parliament and broadly consistent with departmental Resource Accounts, which are based on commercial International Financial Reporting Standards (IFRS) adapted for the public sector.
Real terms public expenditure (£billions)
| Functions | 2023-24 | 2024-25 |
|---|---|---|
| General public services | 170.4 | 159.5 |
| Defence | 59.1 | 63.7 |
| Public order and safety | 50.7 | 51.7 |
| Economic affairs | 98.3 | 87.8 |
| Environment protection | 16.6 | 17.3 |
| Housing and community amenities | 21.8 | 21.8 |
| Health | 231.0 | 242.4 |
| Recreation, culture and religion | 13.5 | 13.6 |
| Education | 118.8 | 122.6 |
| Social protection | 379.7 | 387.2 |
In the accompanying excel tables, tables 9 to 10 present spending under the “expenditure on services” framework. This is based on National Accounts definitions and covers the whole of the public sector. It therefore has wider coverage than the budgeting framework and is also more stable over time.
Trends in functional expenditure (Tables 9, 9a and 9b)
Compared with the previous year:
- in real terms, spending in eight of the ten functions (excluding EU transactions) for 2024-25 increased whilst spending in two functions fell, compared to 2023-24.
- the largest real terms percentage increase was in defence (7.8 per cent), mainly due to increases in provision of defence capability.
- the largest real terms percentage decrease was in economic affairs (-10.7 per cent), mainly as a result of a decrease in enterprise and economic development for DESNZ expenditure on Energy Bills support.
- spending on health shows a nominal increase (9.2 per cent) and a real terms increase (5.0 per cent) in 2024-25.
In the accompanying excel tables, tables 9, 9a and 9b show public sector expenditure on services broken down by function over a longer number of years, allowing long-term trends to be identified. Table 10 presents data broken down by economic categories such as pay or grants.
Accredited Official Statistics are official statistics that have been independently reviewed by the Office for Statistics Regulation (OSR) and confirmed to comply with the standards of trustworthiness, quality and value in the Code of Practice for Statistics. Accredited official statistics are called National Statistics in the Statistics and Registration Service Act 2007. These accredited official statistics were independently reviewed by the Office for Statistics Regulation in November 2011. They comply with the standards of trustworthiness, quality and value in the Code of Practice for Statistics and should be labelled ‘accredited official statistics’.
Our statistical practice is regulated by the Office for Statistics Regulation (OSR). OSR sets the standards of trustworthiness, quality and value in the Code of Practice for Statistics that all producers of official statistics should adhere to. For further information, please see the explanation web page on the OSR website.
You are welcome to contact us directly with any comments about how we meet these standards. Alternatively, you can contact OSR by emailing regulation@statistics.gov.uk or via the OSR website.
Spending frameworks used in HM Treasury spending publications
| Budgeting | Expenditure on services (TES) |
|---|---|
| This framework provides information on central government departmental budgets, which are the aggregates used by the government to plan and control expenditure. It covers departmental own spending as well as support to local government and public corporations. | This framework is used in HM Treasury publications for statistical analysis. It is based on National Accounts definitions and covers spending by the whole of the public sector. It therefore has wider coverage than the budgeting framework and is also more stable over time. |
Trends in public spending
Chart 1: Trends in public spending since 2002-03
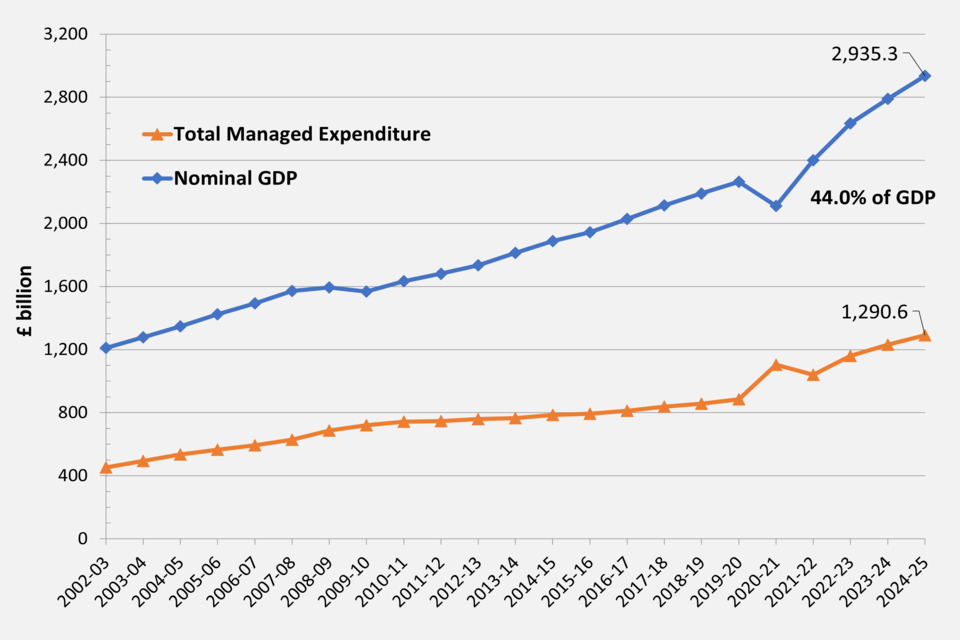
- TME as a percentage of GDP, which shows the size of the public sector relative to the size of the whole economy, was 44.0 per cent in 2024-25, which was a decrease of 0.1 per centage points when compared to 2023-24. Figures for 2020-21 show the highest percentage (52.3 per cent) in the period covered by these tables (from 2002-03), reflecting not only increased spending, but also lower GDP as the economy entered recession during the Covid-19 pandemic.
Chart 2: Real terms trends in Public Spending
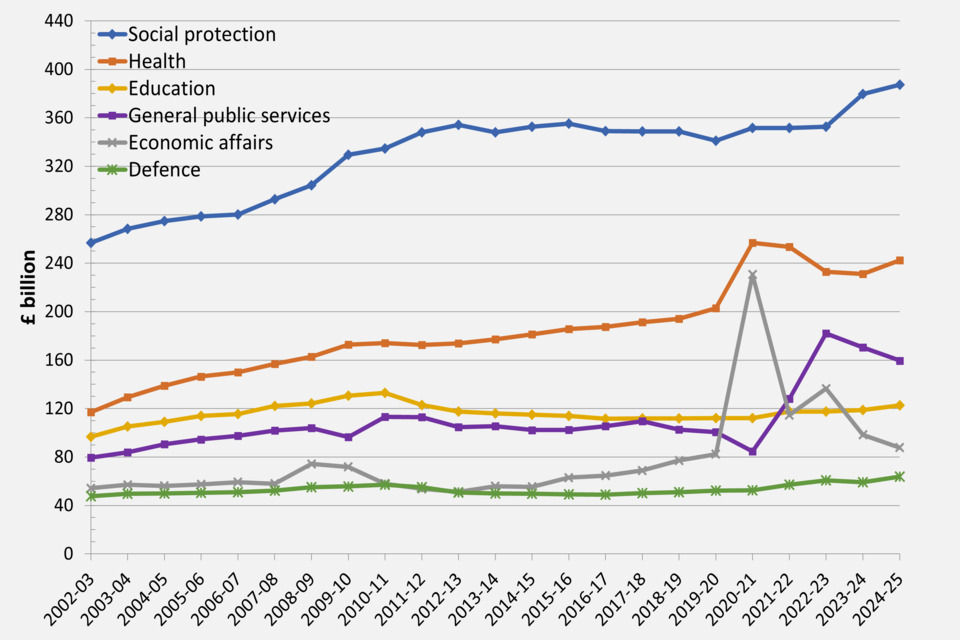
From 2011-12 onwards the ‘grant-equivalent element of student loans’ is no longer part of the TES framework and has therefore been removed from the Education function. Therefore, figures are not directly comparable between 2010-11 and 2011-12. A full explanation of this decision can be found in PESA 2016 Annex E.
Revisions in this release (since the February 2026 publication)
| Expenditure | Amount (£millions) | Comments |
|---|---|---|
| Resource DEL expenditure | -£46.7bn | These large changes reflect the ringfence which was previously within DEL (depreciation, impairments, etc) moving to AME. If comparing the May PSS figure for Resource DEL excluding Block Grant adjustments and depreciation on a like for like basis, the change would be less than £0.1bn. |
| Resource departmental AME | £44.4bn | These large changes reflect the ringfence which was previously within DEL (depreciation, impairments, etc) moving to AME. |
| Capital departmental AME | £1.2bn | Driven mainly by revisions to Culture, Media and Sport and Business and trade. |
This release includes Machinery of Government changes for budget moved from Education to Work and Pensions, and from Home Office to Ministry of Housing, Communities and Local Government. Further information about these changes will be available in Chapter 3 of PESA 2026.
Changes to Total Managed Expenditure (TME) and public sector debt interest in all years are due to updated ONS data. More information about these changes is available in the monthly ONS public sector finances (PSF) release.
Additional information about the PSS release
Upcoming revisions and changes in forthcoming releases
This is the first PSS release where the ringfence (depreciation, impairments etc) which was previously within DEL is now included within AME. Resource DEL is now presented as one total, where the sum of Table 2 (Resource DEL)[footnote 1] and Table 4 (Capital DEL) create Total DEL (Table 6). Total Departmental Expenditure (Table 7) now sums Total DEL and AME (Tables 3 and 5). This reclassification change has resulted in a reduction of Resource DEL and Total DEL, and an increase to Resource AME and Total Departmental Expenditure. Further updates to reflect the presentation of the reclassification will be introduced for PESA 2026 and the July PSS.
In the July PSS and PESA publications some changes will be made to the local government tables, with the intention of aligning them more closely to those in the central government and public sector chapters. A new table will be added presenting local government expenditure by sub-function, providing more detail to users. Local government capital expenditure will be presented on a net basis by country and function, merging the existing gross expenditure and receipts tables. Users who require the existing split of capital data will still be able to access it via the local government expenditure releases published by MHCLG and the devolved governments. Links to these are included in PSS and PESA.
PSS publication schedule for the coming year
| Date | Release |
|---|---|
| July 2026 | The July PSS release contains the first publication of departmental spending outturn for the 2025-26 financial year. Local authority data and much of the data from the devolved administrations are still provisional at this stage of the year. This is the main annual release. |
| November 2026 | As well as the PSS release, the Country and Regional Analysis (CRA) is also published in November each year. |
| February 2027 | This release contains updates to the key Public Spending Statistics series. It includes updated data for local authorities for the previous financial year. |
GDP deflators and money GDP
Real terms figures are the nominal figures adjusted to 2024-25 price levels using GDP deflators from the Office for National Statistics (released 31 March 2026).
| Financial year | GDP deflator at market prices (2024-25 = 100) | % per cent change on previous year | Money GDP (£millions) |
|---|---|---|---|
| 2020-21 | 85.100 | 5.23 | 2,109,996 |
| 2021-22 | 85.304 | 0.24 | 2,400,398 |
| 2022-23 | 91.300 | 7.03 | 2,634,336 |
| 2023-24 | 96.112 | 5.27 | 2,790,164 |
| 2024-25 | 100.000 | 4.05 | 2,935,342 |
GDP Deflator: Financial years 2020-21 to 2024-25 taken from ONS series L8GG in Table N.
-
The Scottish Government total for RDEL excludes the Block Grant Adjustment from the TDEL calculation shown in table 6. ↩