Public Health Outcomes Framework: commentary, November 2026
Published 3 November 2026
Applies to England

© Crown copyright 2026
This publication is licensed under the terms of the Open Government Licence v3.0 except where otherwise stated. To view this licence, visit nationalarchives.gov.uk/doc/open-government-licence/version/3 or write to the Information Policy Team, The National Archives, Kew, London TW9 4DU, or email: psi@nationalarchives.gov.uk.
Where we have identified any third party copyright information you will need to obtain permission from the copyright holders concerned.
This publication is available at https://www.gov.uk/government/statistics/public-health-outcomes-framework-november-2026-data-update/public-health-outcomes-framework-commentary-november-2026
Background
The Public Health Outcomes Framework (PHOF) gives an overview of public health outcomes at national and local level. Local councils can use the PHOF interactive web tool in Fingertips to access the data and assess progress in comparison to national averages and their peers.
New in this update
This update includes new data for 34 indicators. The commentary concentrates on inequalities in healthy life expectancy and loneliness. A complete list of indicators that have been updated is included in the PHOF indicator details table.
Summary of selected updated indicators
Inequality in healthy life expectancy at birth, A02c
The indicator of inequality in healthy life expectancy for regions and local councils has been updated for the first time in 10 years. This is because it is based on data from the census, which only takes place every 10 years.
The health state life expectancy estimates for Middle layer Super Output Areas (MSOAs), England and Wales: 2019 to 2023 have been published by the Office for National Statistics (ONS). These were ranked by level of deprivation to estimate the extent of inequality in healthy life expectancy within English regions, county councils and unitary authorities (upper-tier local authorities). The slope index of inequality was used to represent the range in years of healthy life expectancy across the social gradient within areas, from most to least deprived.
For regions, there was a clear north-south divide in the results, with the greatest inequality in the north of England. The slope index of inequality for male healthy life expectancy ranged from 18.3 years in the North West to 11.2 years in the South West. These regions also had the largest and smallest inequality for female healthy life expectancy (19.1 and 10.8 years).
Middlesbrough was the local council with the largest inequality for both sexes. The gap between most and least deprived was 22.4 years for male and 22.1 years for female healthy life expectancy in this area. The largest inequalities within local councils were not, however, all in the north of England. Kensington and Chelsea in London had the second highest male (21.8 years) and fourth highest female gap in healthy life expectancy (20.2 years). By contrast, the areas with the smallest inequality were also London boroughs. For both sexes, the 2 areas with the smallest gaps were Newham (2.7 years, male and 2.9 years, female) and Hackney (2.8 years, male and 3.5 years, female). Inequality is small within these areas as healthy life expectancy is generally low across their MSOAs.
Loneliness: adults who feel lonely often or always, B19
Loneliness can affect anyone, at any time. When people feel lonely often or always, this is referred to as chronic loneliness. Chronic loneliness can have a serious effect on someone’s wellbeing.
The overall percentage of people aged 16 and over in England who reported feeling lonely often or always in 2023 to 2025 was similar to that in 2022 to 2024 (6.9% compared with 7.0%).
Chronic loneliness remained higher for women (7.5%) than men (6.1%) in 2023 to 2025. ONS advises in Measuring loneliness: guidance for use of the national indicators surveys that some groups, such as older men, may under-report loneliness when asked.
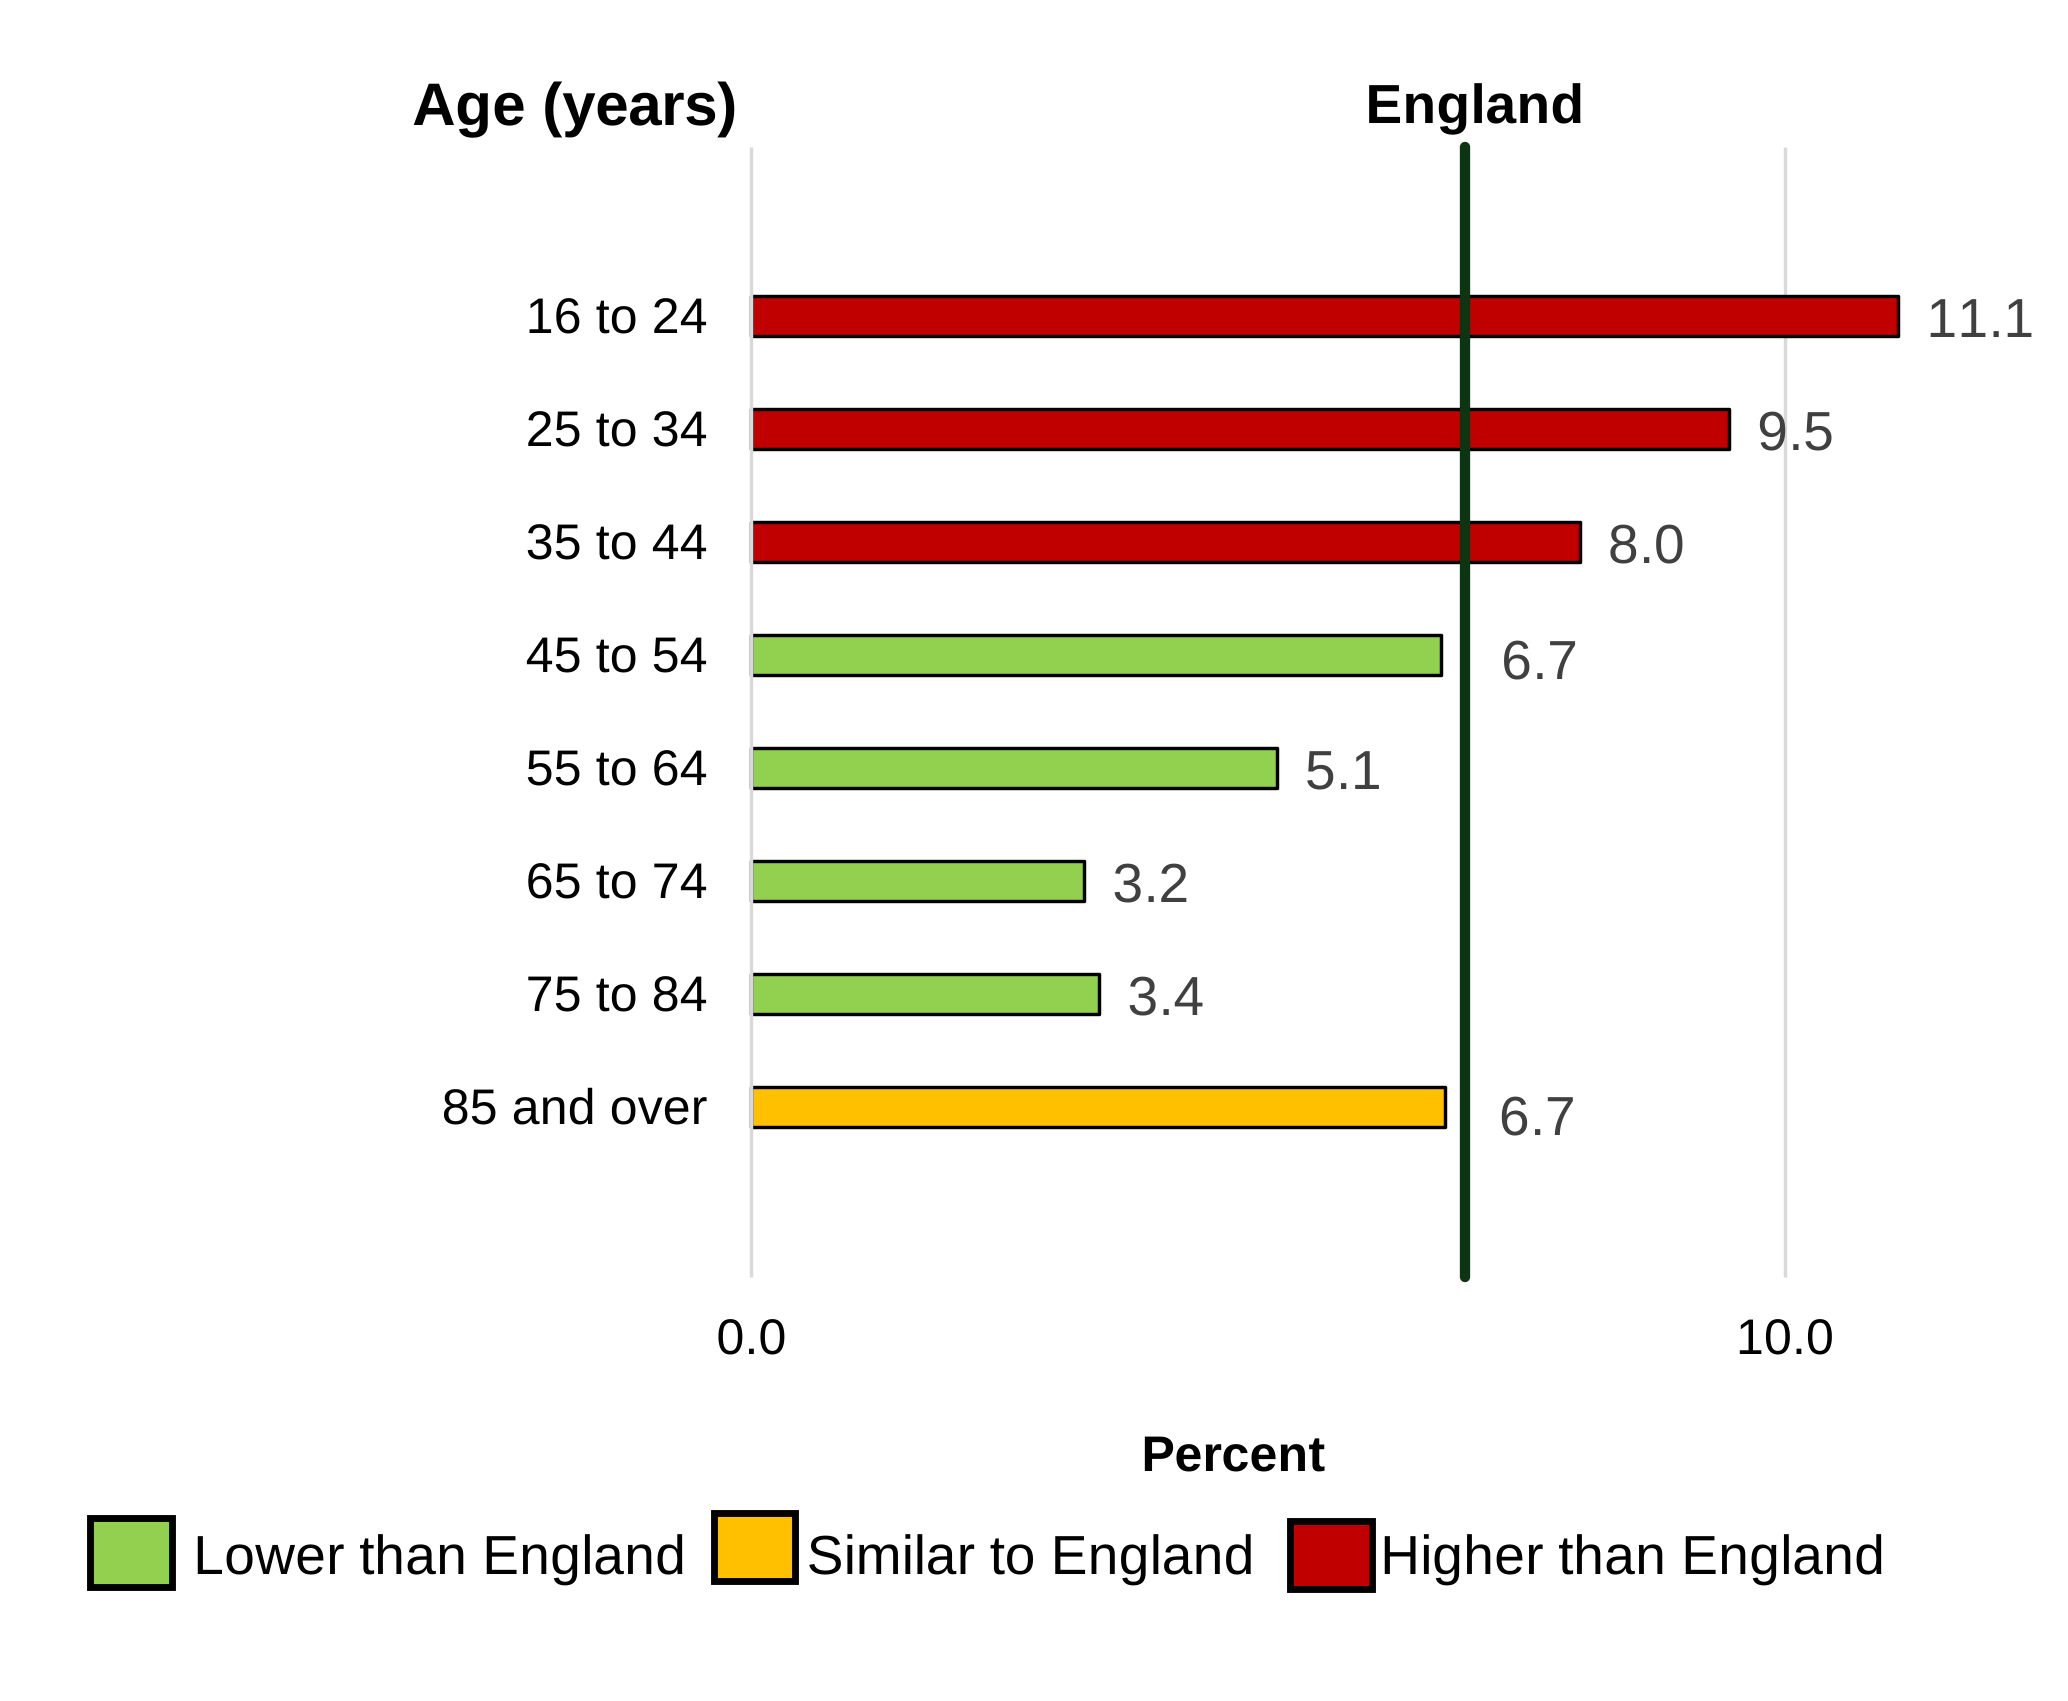
Chronic loneliness was highest in the youngest age group, aged 16 to 24 years. In this group, the rate was 3 times higher at 11.1% than the lowest rate of 3.2% in people aged 65 to 74 years (see figure 1).
Figure 1: chronic loneliness by age group, England, 2023 to 2025
Source: OHID, based on Adult Active Lives Survey data from Sport England
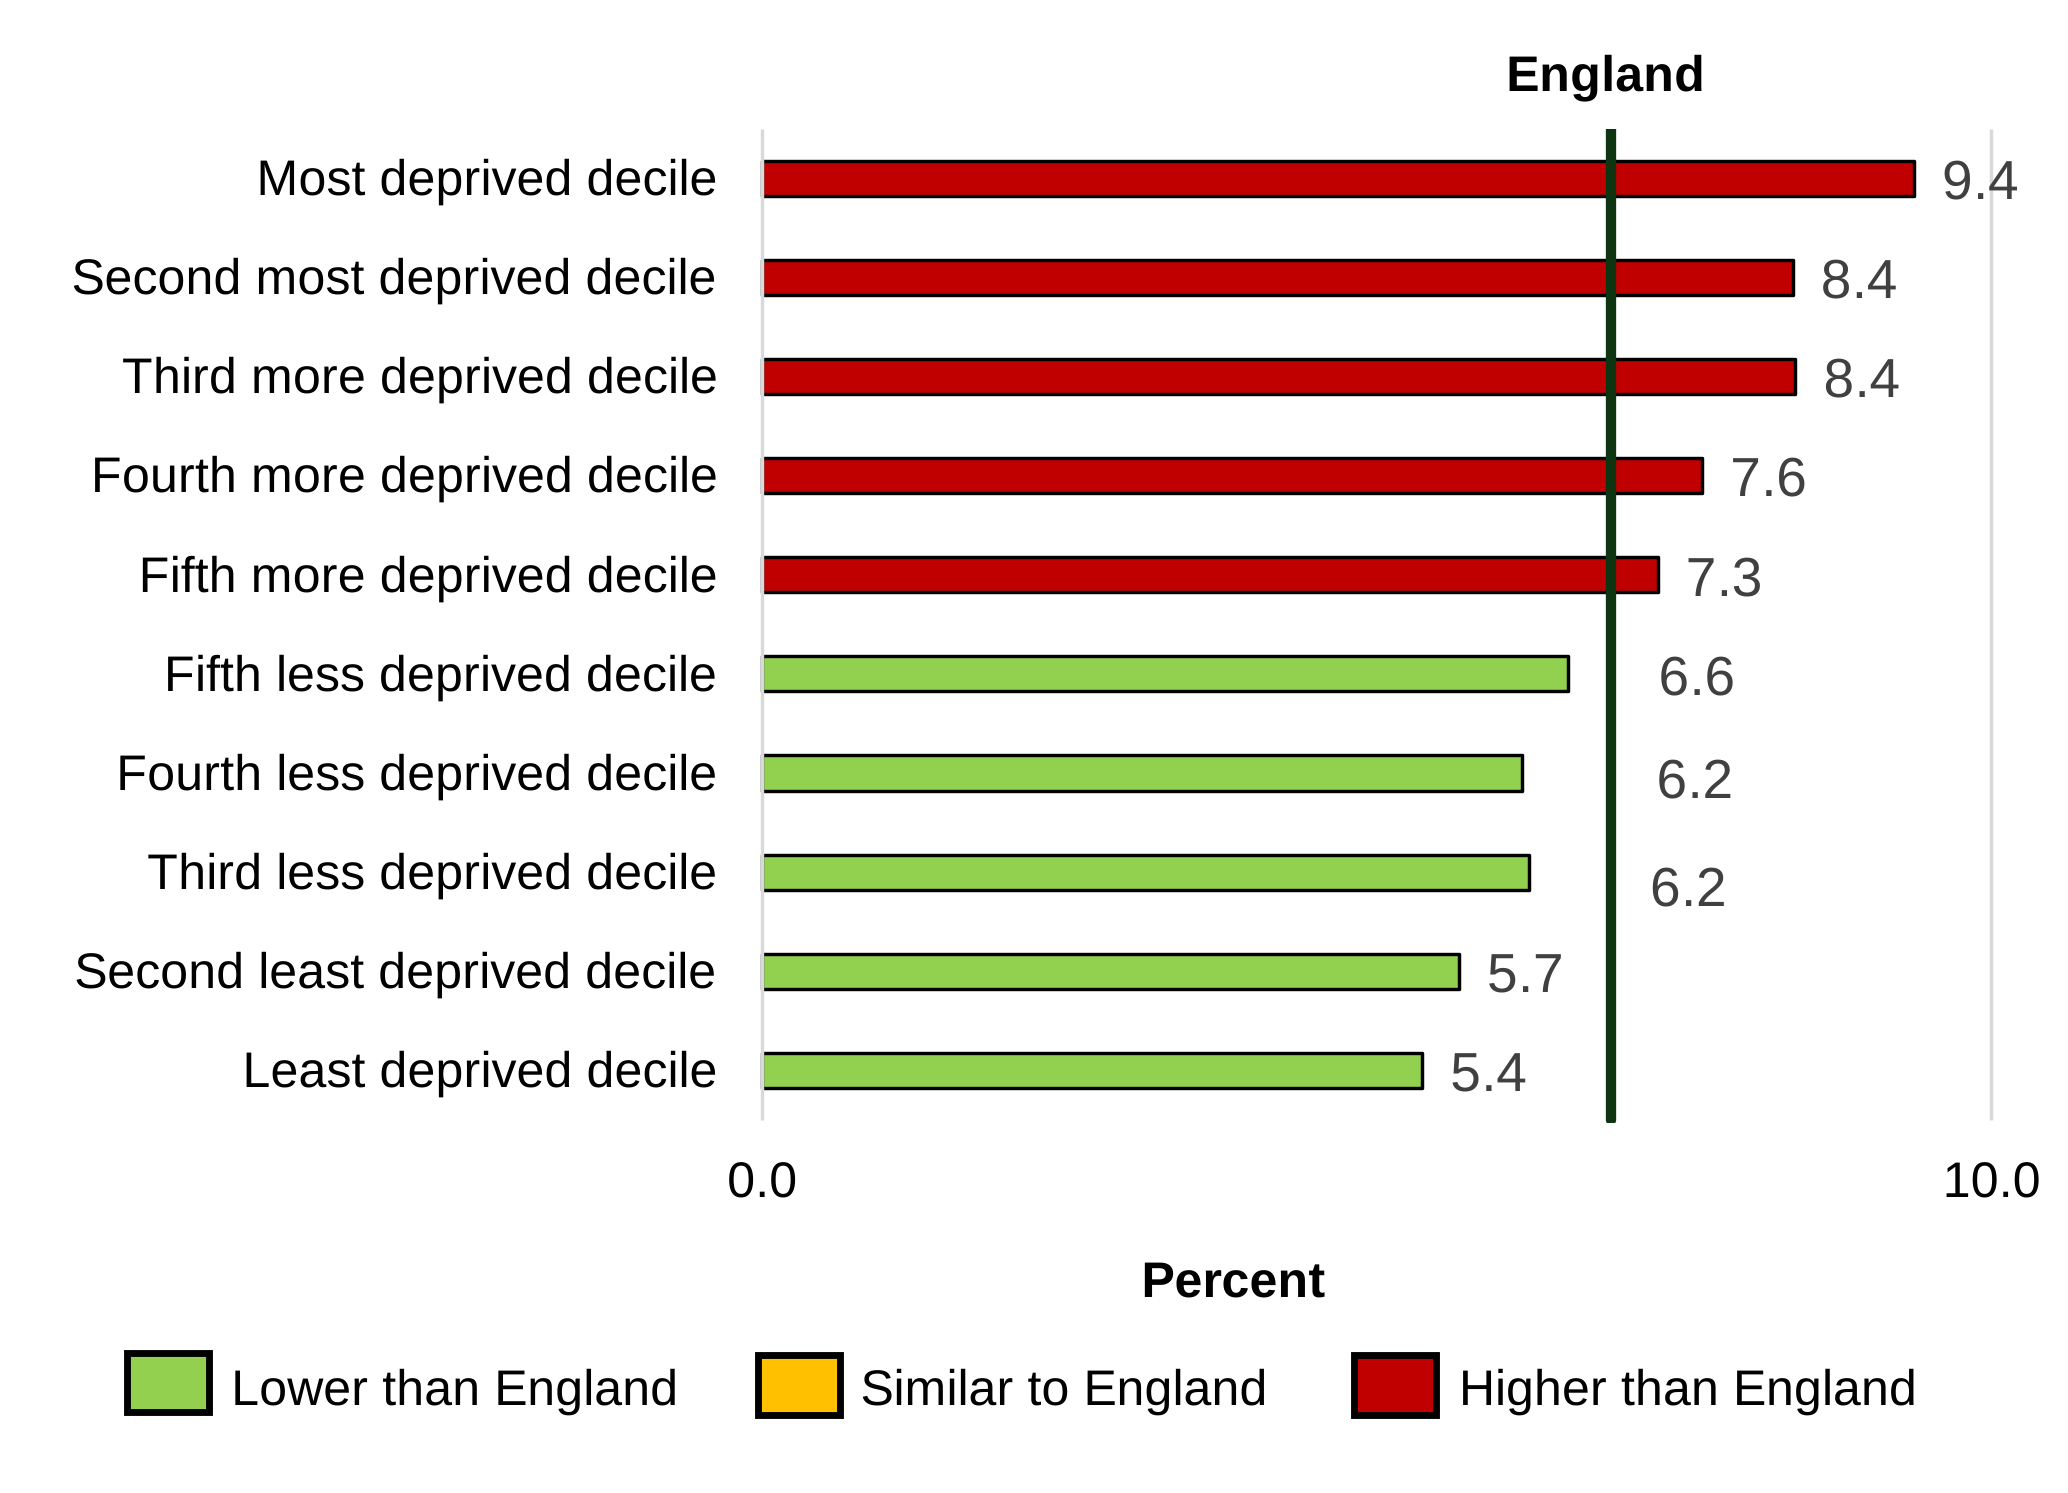
People living in the most deprived areas were almost twice as likely to report being lonely often or always compared to those in the least deprived areas (9.4% in the most compared with 5.4% in the least) (see figure 2).
Figure 2: chronic loneliness by upper-tier local authority deprivation decile, England, 2023 to 2025
Source: OHID, based on Adult Active Lives Survey data from Sport England
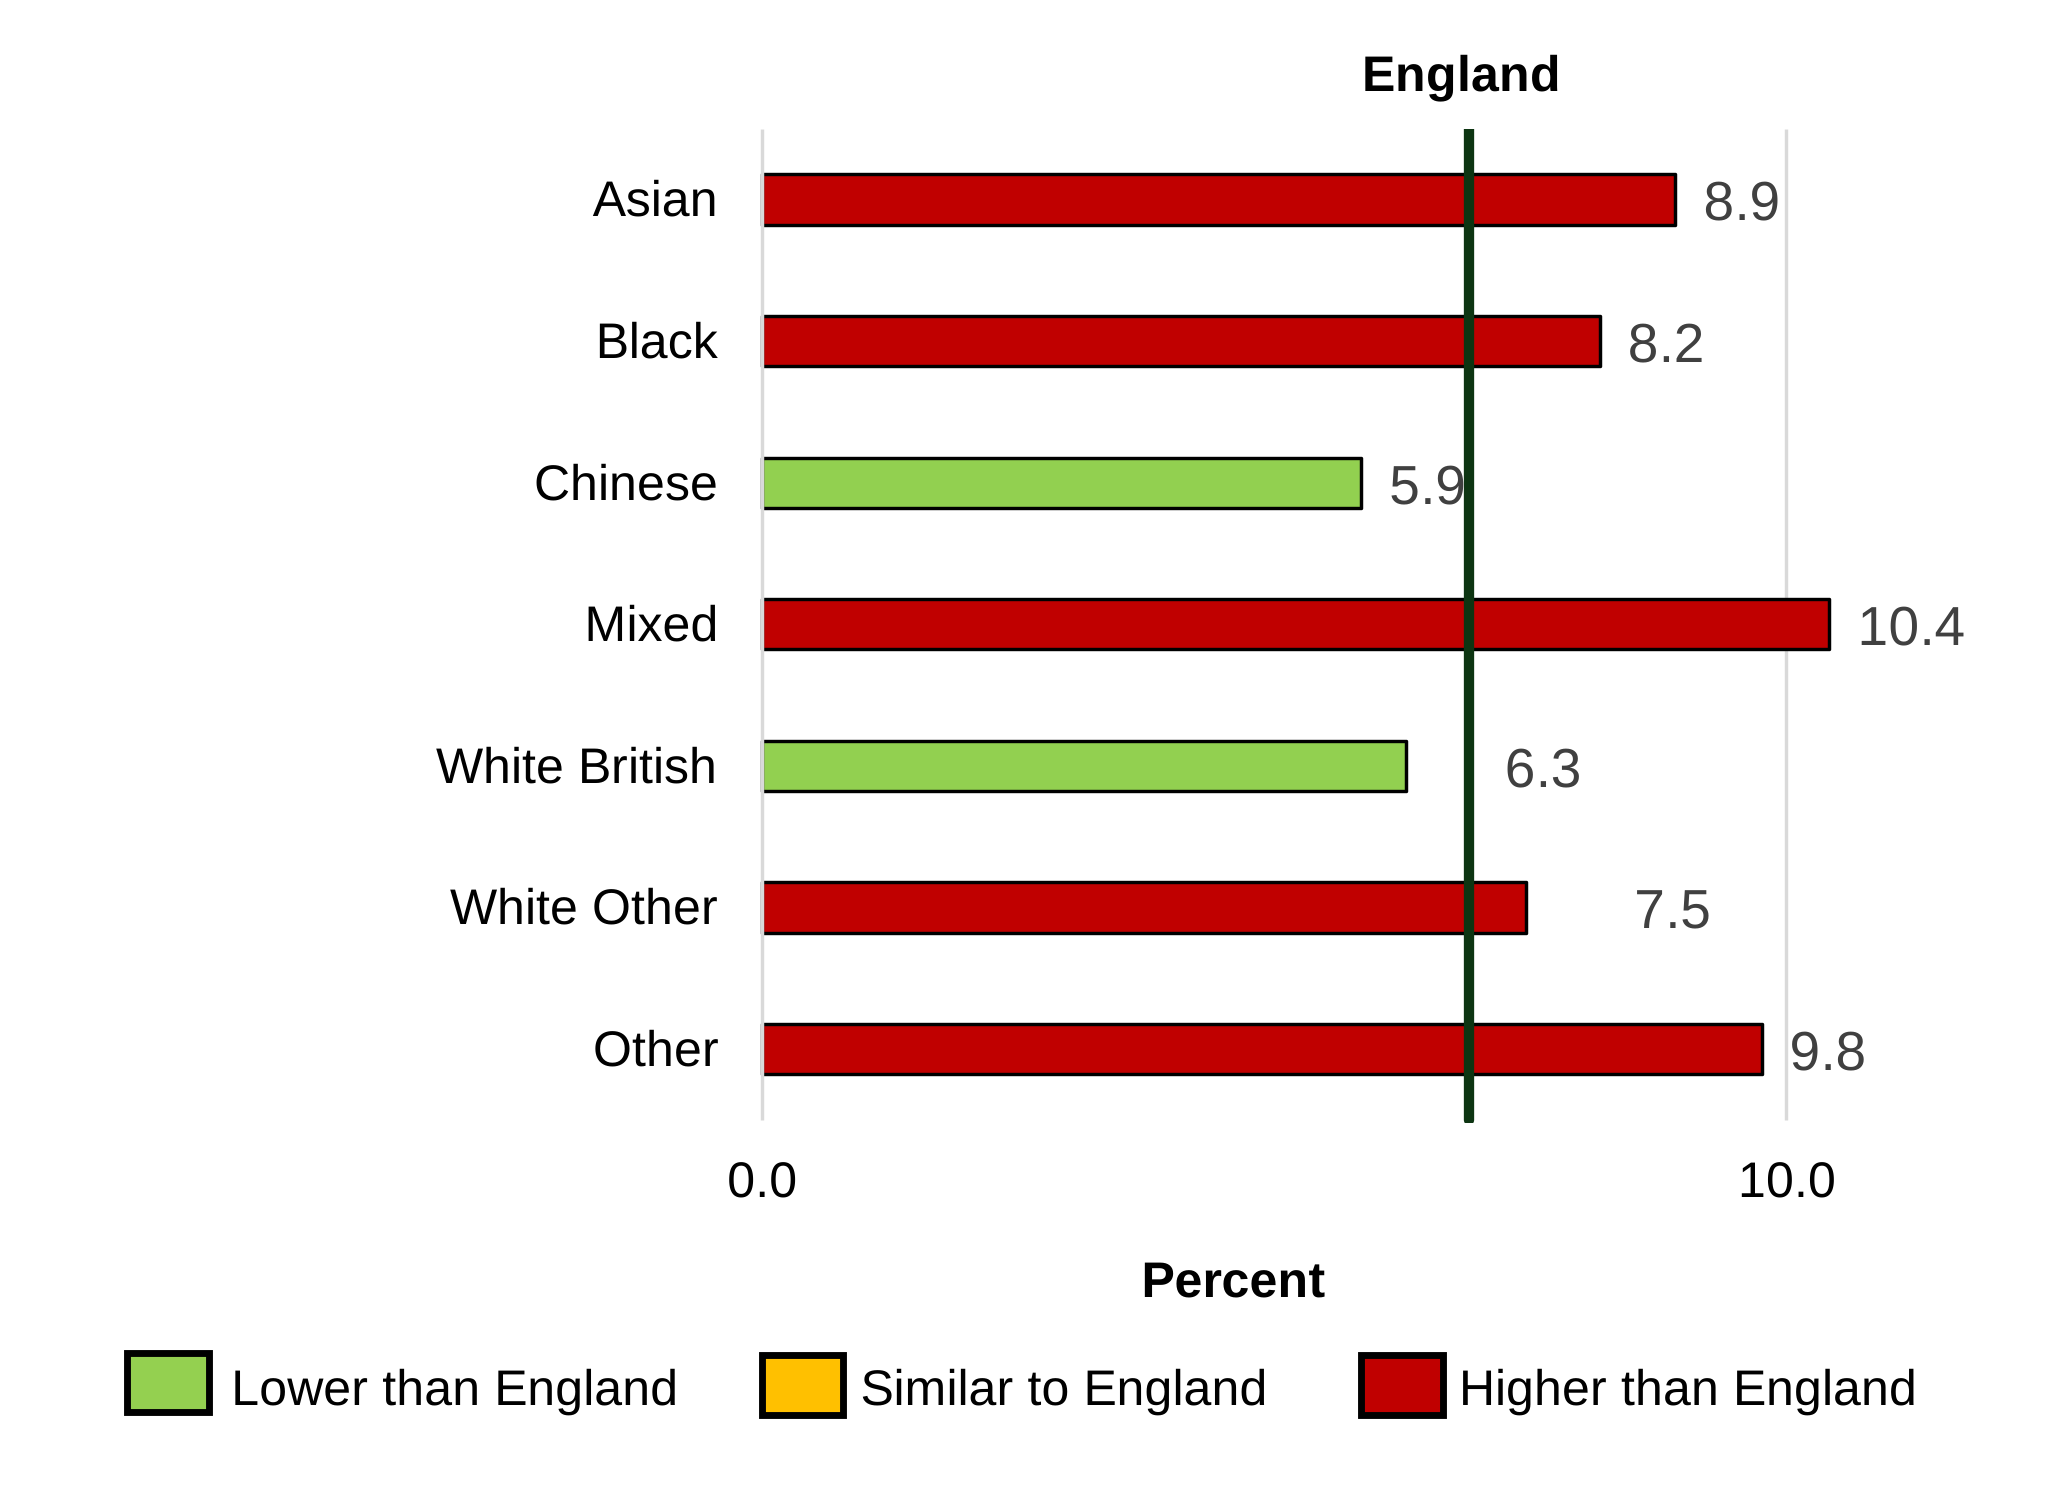
Chronic loneliness was higher for people who identified as having Mixed (10.4%) and other (9.8%) ethnicity. People who gave their ethnicity as Chinese reported the lowest levels of chronic loneliness (5.9%) (see figure 3).
Figure 3: chronic loneliness by reported ethnicity, England, 2023 to 2025
Source: OHID, based on Adult Active Lives Survey data from Sport England
Chronic loneliness was 4 times higher among people who had a disability (16.5%) than those who had no disability (3.8%).
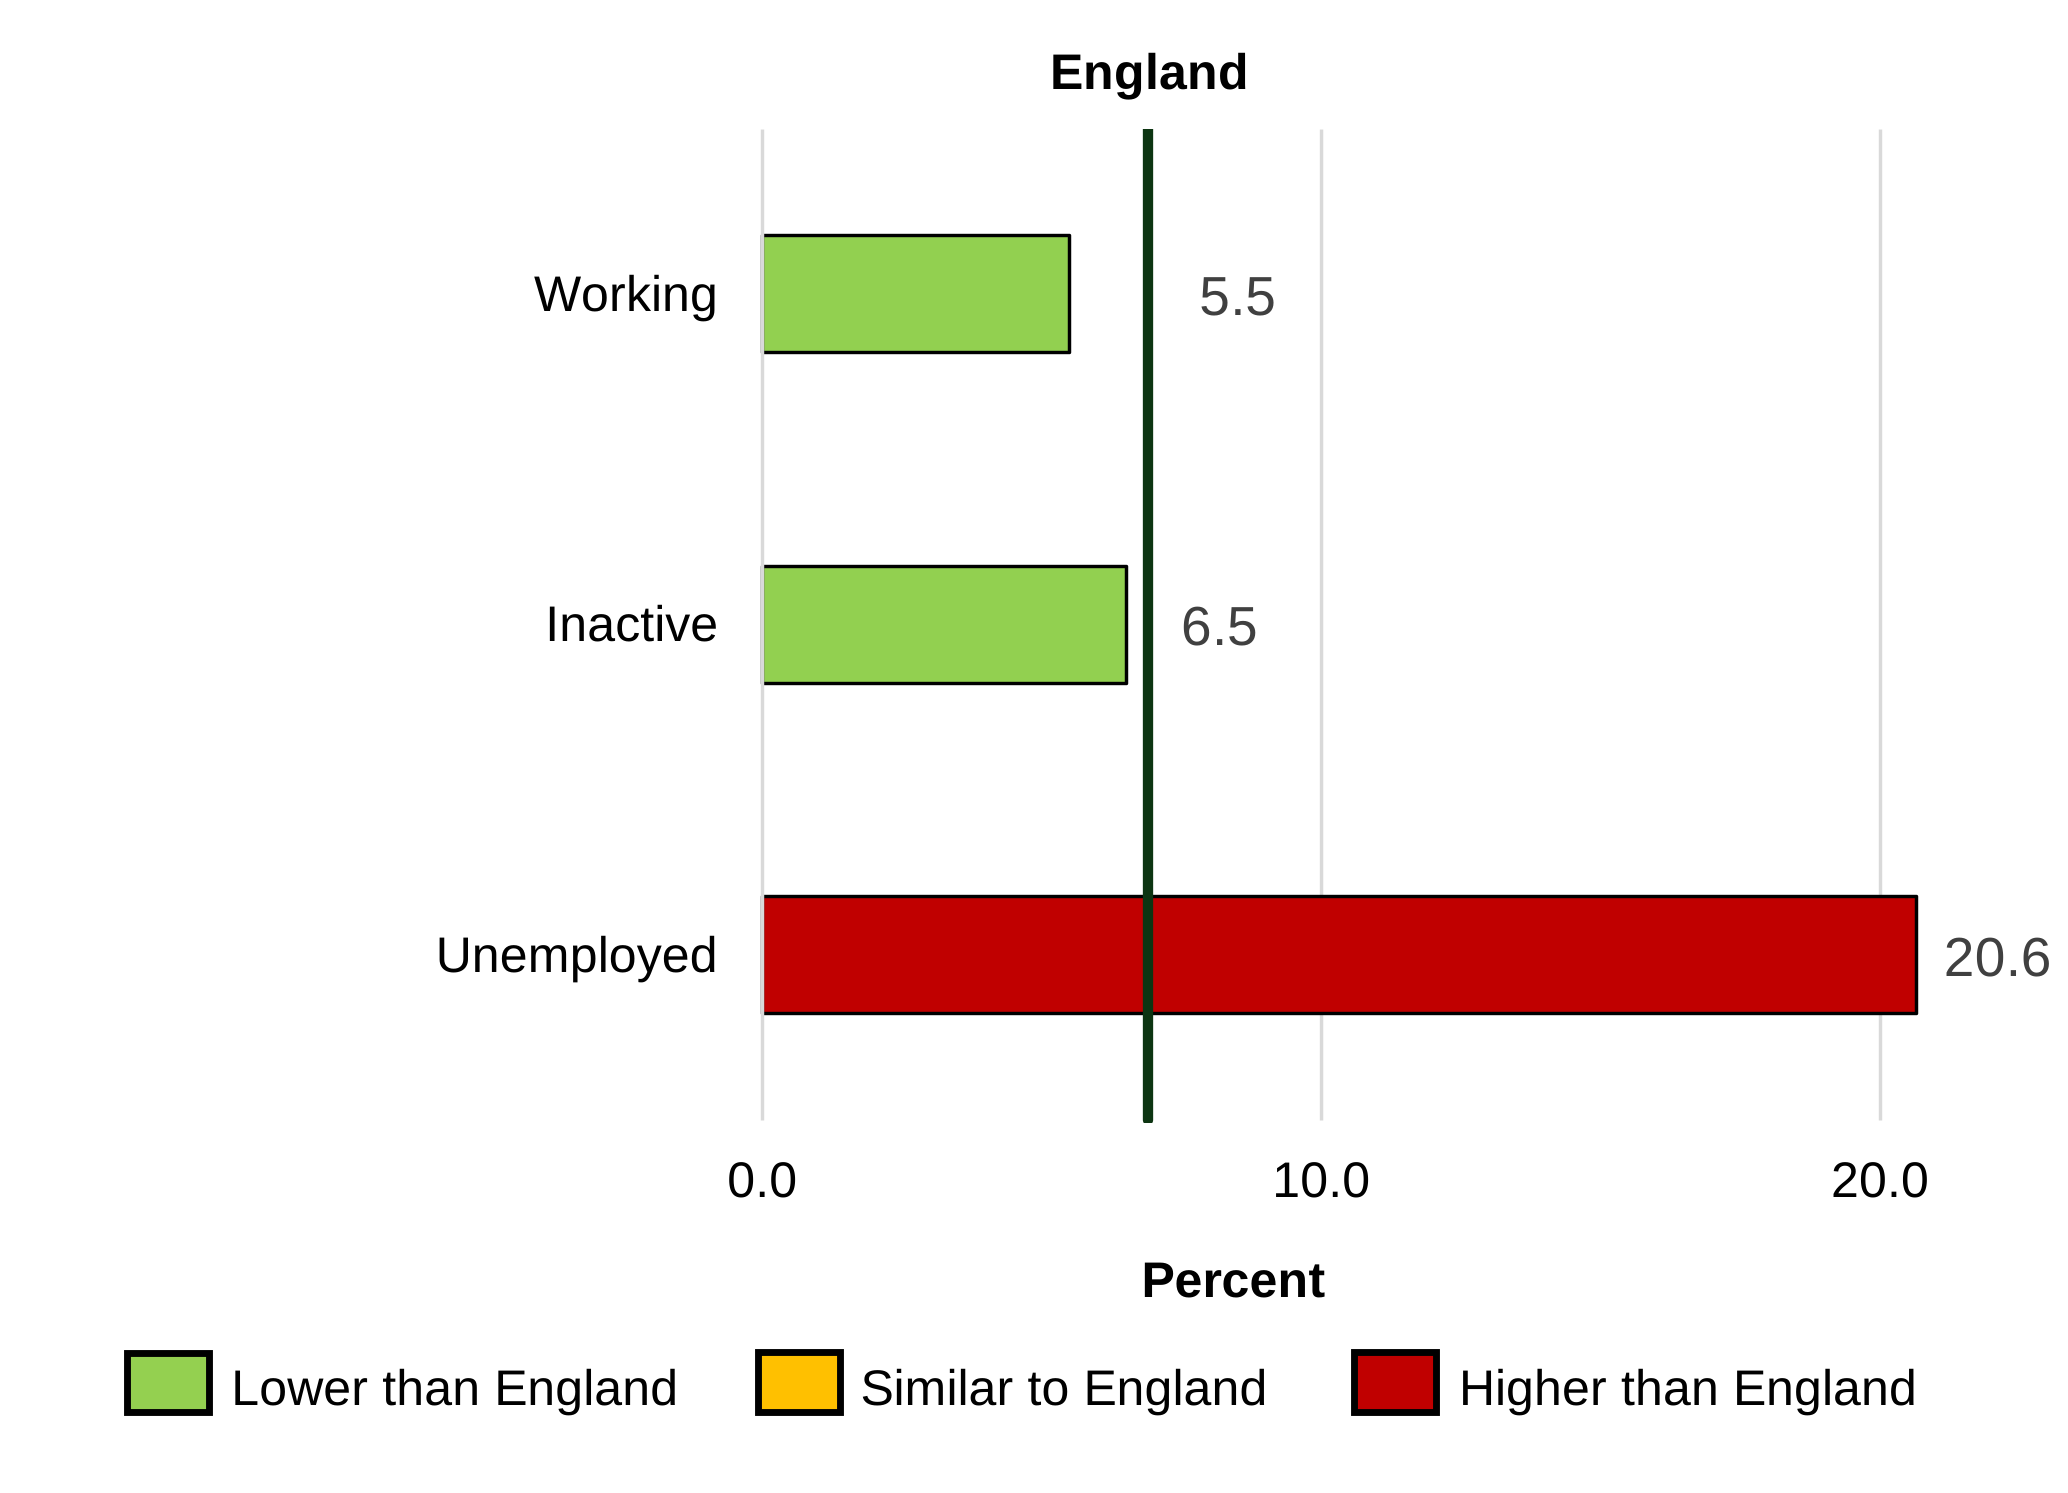
Chronic loneliness was higher for people who were unemployed (20.6%) than those who were working (5.5%). Chronic loneliness was lower among people who were not in employment nor looking for work such as those who have retired (defined as ‘occupationally inactive’) at 6.5% than people who were unemployed (see figure 4).
Figure 4: chronic loneliness by employment status, England, 2023 to 2025
Source: OHID, based on Adult Active Lives Survey data from Sport England
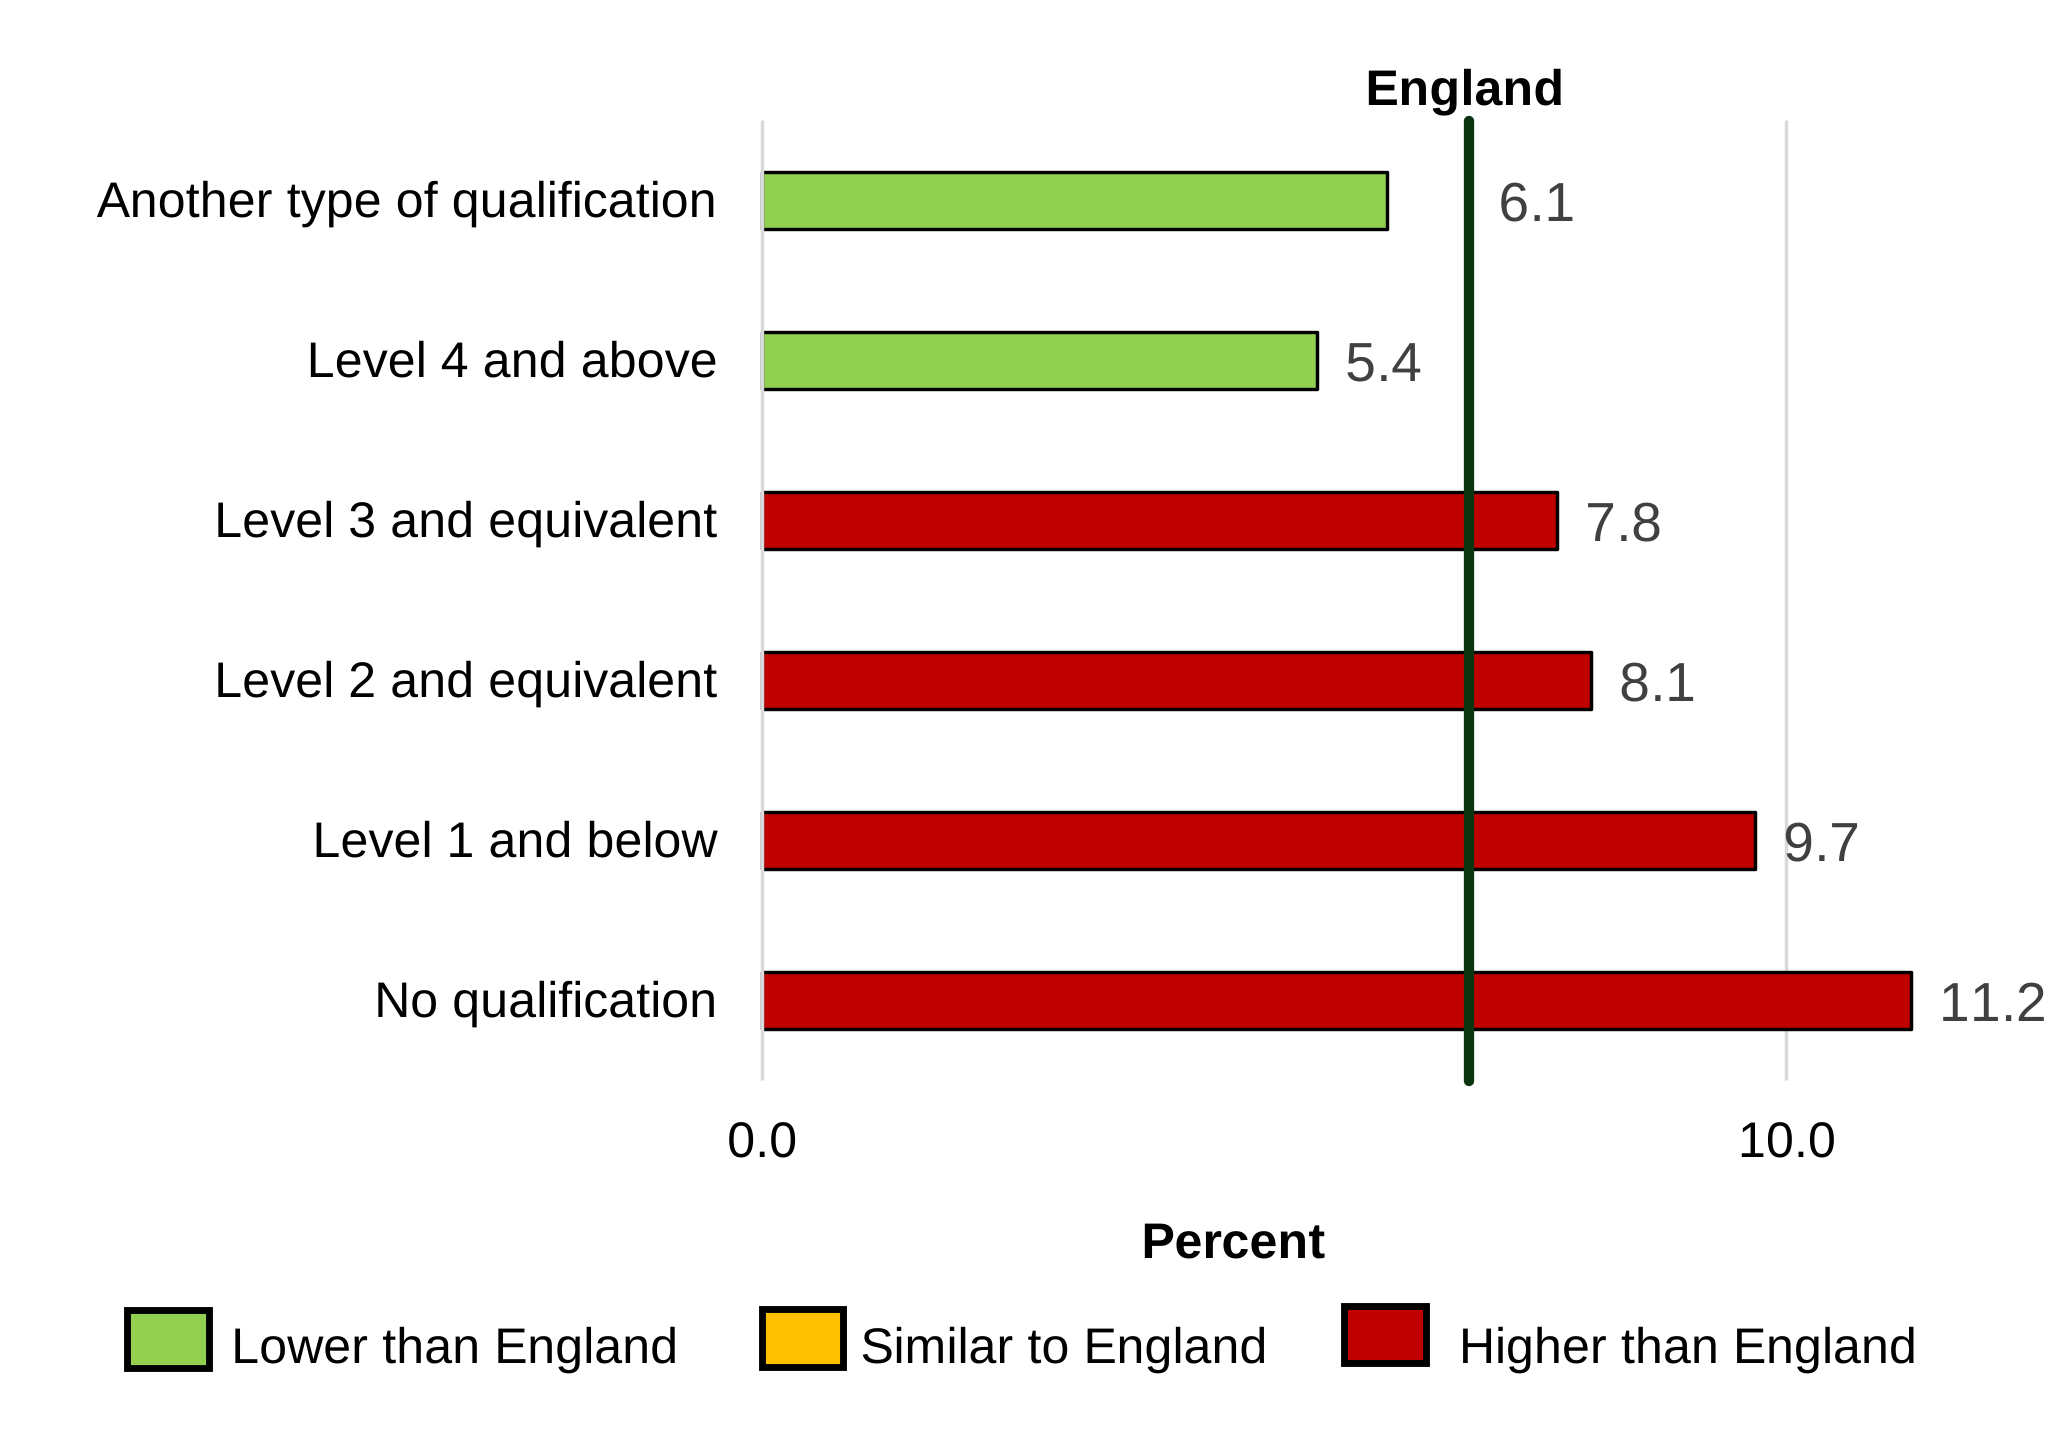
Higher education levels were associated with reduced loneliness. People with no qualifications (11.2%) were twice as likely to report chronic loneliness than people with qualifications at level 4 and above (5.4%) (see figure 5).
Figure 5: chronic loneliness by level of education, England, 2023 to 2025
Source: OHID, based on Adult Active Lives Survey data from Sport England
Note: a full list of qualifications in England, Wales and Northern is described in what qualification levels mean.
Further information
The PHOF includes data for all indicators that have been updated.
The following releases include commentaries with further details about the children’s 0 to 5 years public health indicators that have been updated in this release:
- Breastfeeding at 6 to 8 weeks after birth: April 2025 to March 2026 (annual 2025 to 2026)
- Child development outcomes at 2 to 2 and a half years: April 2025 to March 2026 (annual 2025 to 2026)
- Health visitor service delivery metrics: April 2025 to March 2026 (annual 2025 to 2026)
The National Child Measurement Programme 2025 to 2026 school year release includes a commentary with further details about the child obesity indicators that have been updated in this release.
If you have any queries about this publication, email pha-ohid@dhsc.gov.uk.
The next planned update is in February 2027.