Public Health Outcomes Framework: commentary November 2020
Updated 3 November 2020

© Crown copyright 2020
This publication is licensed under the terms of the Open Government Licence v3.0 except where otherwise stated. To view this licence, visit nationalarchives.gov.uk/doc/open-government-licence/version/3 or write to the Information Policy Team, The National Archives, Kew, London TW9 4DU, or email: psi@nationalarchives.gov.uk.
Where we have identified any third party copyright information you will need to obtain permission from the copyright holders concerned.
This publication is available at https://www.gov.uk/government/statistics/public-health-outcomes-framework-november-2020-data-update/public-health-outcomes-framework-commentary-november-2020
Public Health Outcomes Framework statistical summary November 2020
New in this update
The latest update includes data for 42 indicators, of which 6 have new definitions:
- B01b – Children in absolute low income families (under 16)
- E03 - Mortality rate from causes considered preventable (2019 definition)
- E04b - Under 75 mortality rate from cardiovascular diseases considered preventable (2019 definition)
- E05b - Under 75 mortality rate from cancer considered preventable (2019 definition)
- E06b - Under 75 mortality rate from liver disease considered preventable (2019 definition)
- E07b - Under 75 mortality rate from respiratory disease considered preventable (2019 definition)
This summary provides the main messages from indicators updated with data new to the public domain. For a complete list of indicators that have been updated please see Public Health Outcomes Framework: indicator updates
Summary of selected new and updated indicators
B01b Children in relative low income families (under 16s) and Children in absolute low income families (under 16s)
These indicators replace the previous Public Health Outcomes Framework indicator, 1.01ii – Children in low income families (under 16s).
The Marmot Review (2010) suggests there is evidence that childhood poverty leads to premature mortality and poor health outcomes for adults. Reducing the numbers of children who experience poverty should improve these adult health outcomes and increase healthy life expectancy.
In 2018/19 there were 1.98 million children under 16 (18.4%) living in relative low income and 1.64 million children under 16 (15.3%) in absolute low income across England. This was an increase on the 1.60 million children (15.5%) living in relative low income in 2014/15, and a small decrease on the 1.61 million children (15.6%) that were living in absolute low income (Figure 1). At a local level the proportion of children aged under 16 living in low income families varies greatly, ranging from 6% to 38% across Districts and Unitary Authorities for relative low income and from 4% to 33% for absolute low income.
Figure 1: Percentage of children under 16 living in low income families, England, 2014/15 to 2018/19
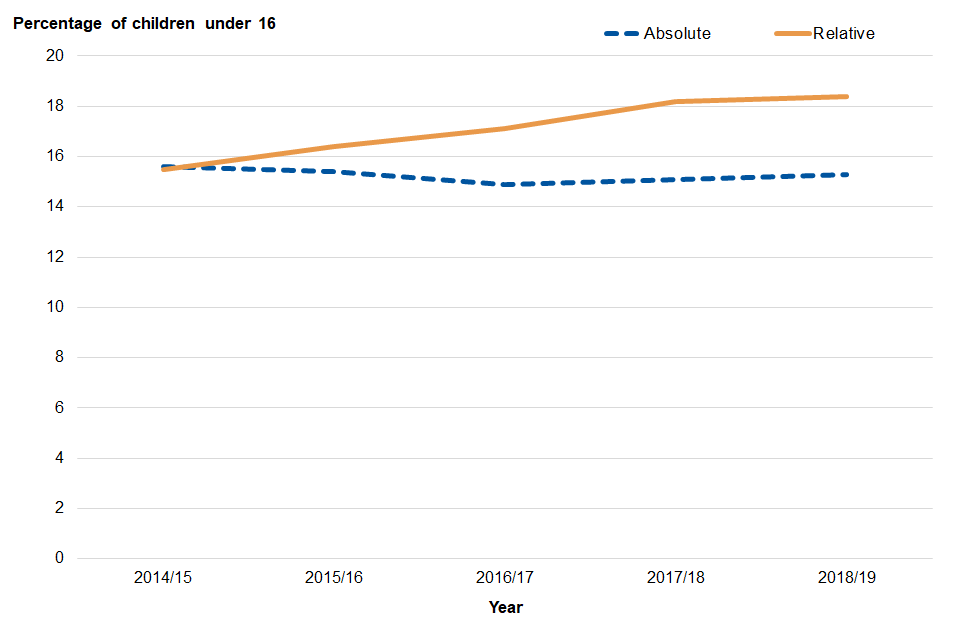
Relative low income is defined as a family in low income Before Housing Costs (BHC) in the reference year. The measure sets a threshold as 60% of the UK average (median) income and moves each year as average income changes. It is useful for comparing the situation in local areas and measuring the number and proportion of individuals who are currently in low income compared to the current median income.
Absolute low income is defined as a family in low income Before Housing Costs (BHC) in the reference year in comparison with incomes in 2010/11. The measure takes the 60 per cent of median income threshold from 2010/11 and then fixes this in real terms (i.e. the line moves with inflation). It is useful for tracking changes over time in relation to a fixed reference point and is designed to assess how low incomes are faring with reference to inflation.
Changes to mortality rates by cause
A new time period, 2017 to 2019, has been added for 11 of the indicators relating to mortality.
Disease specific mortality indicators
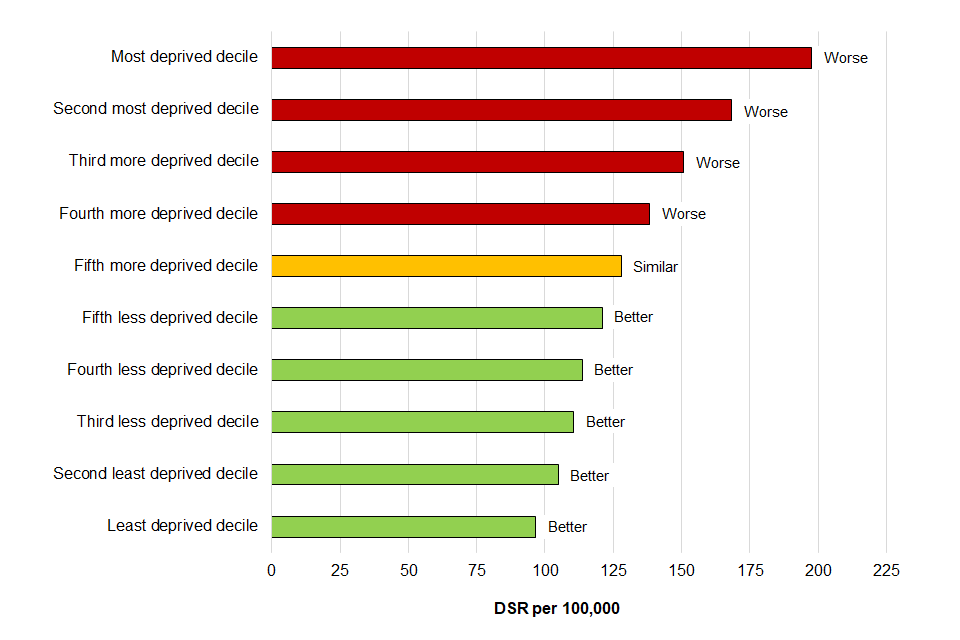
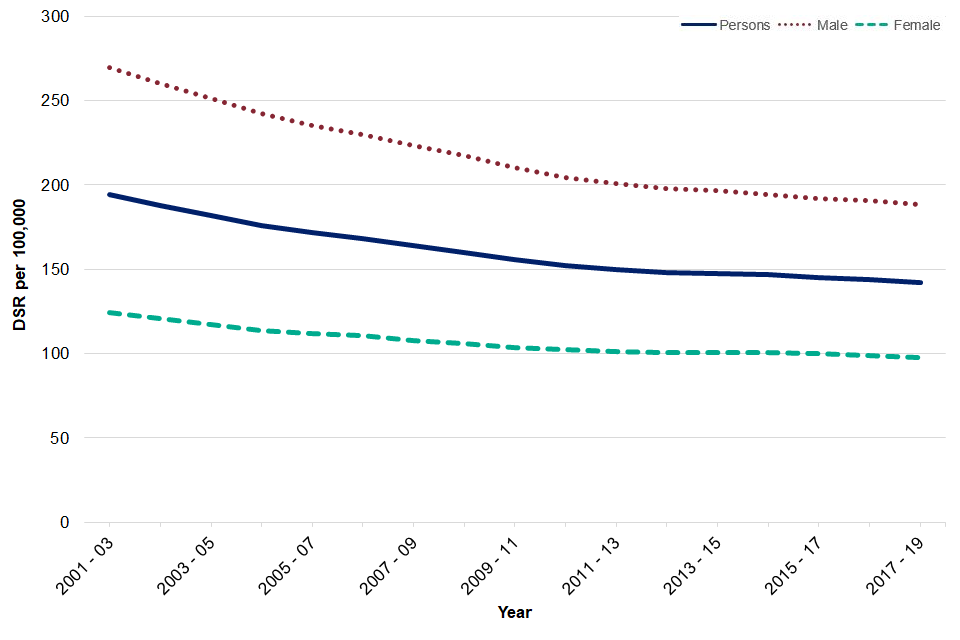
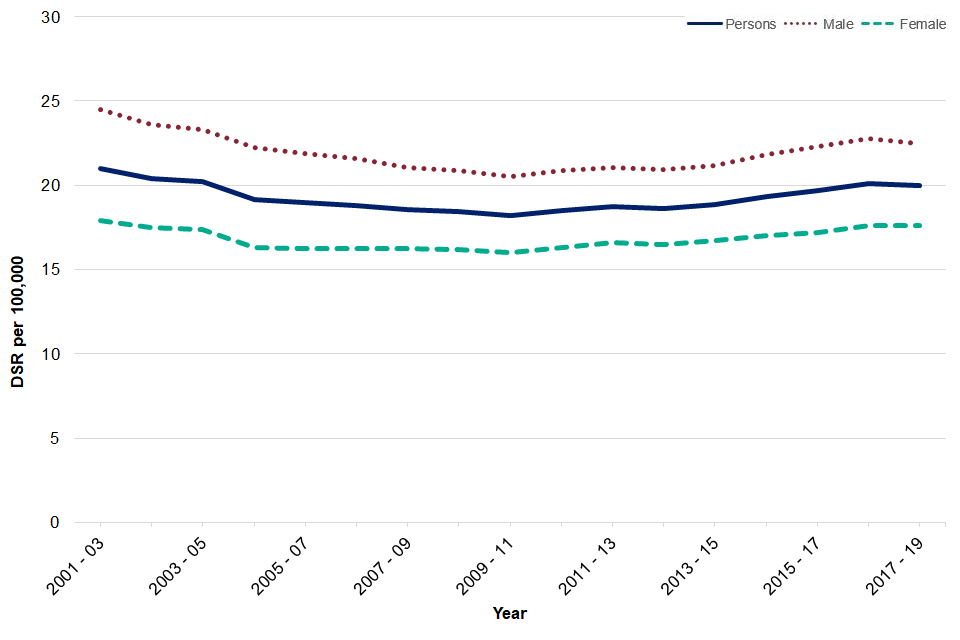
Compared to the previous time period (2016 to 2018), the under 75 mortality rate from cardiovascular disease (CVD) and cancer decreased significantly, with around 102,225 and 187,314 deaths recorded respectively. CVD and cancer mortality rates have been decreasing year on year in England (Figures 2a and 2b), however rates in the most deprived areas in England are significantly higher than those in the least deprived areas with CVD mortality almost 4 times higher in the most deprived areas and cancer mortality twice as high (Figures 3a and 3b).
Figure 2a: Mortality rates from CVD England, from 2001 to 2003 to 2017 to 2019
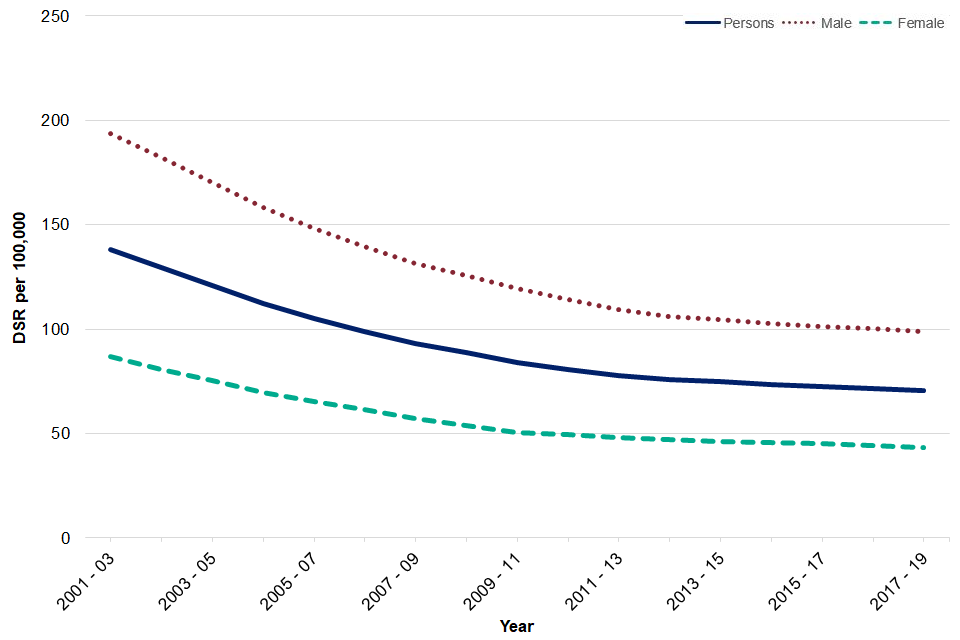
Figure 2b: Mortality rates from cancer, England, from 2001 to 2003 to 2017 to 2019
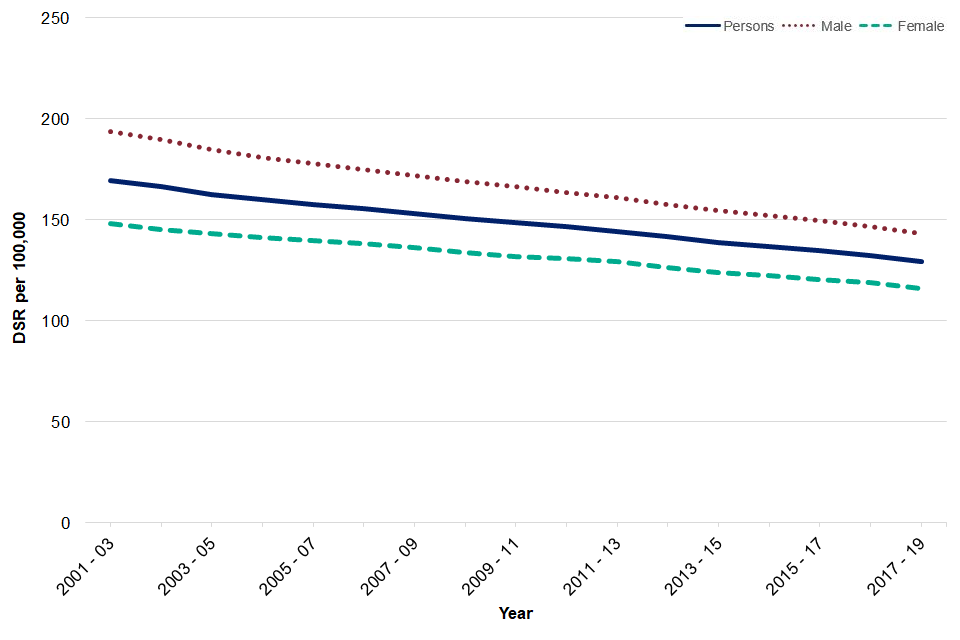
Figure 3a: Mortality rates from CVD by deprivation decile, compared to England, 2017 to 2019
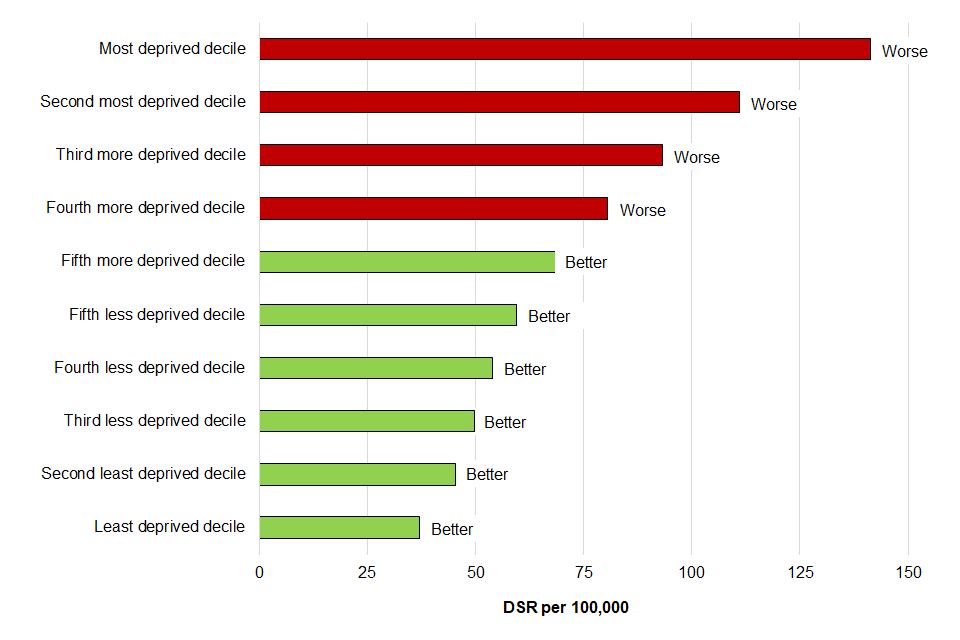
Figure 3b: Mortality rates from cancer by deprivation decile, compared to England, 2017 to 2019
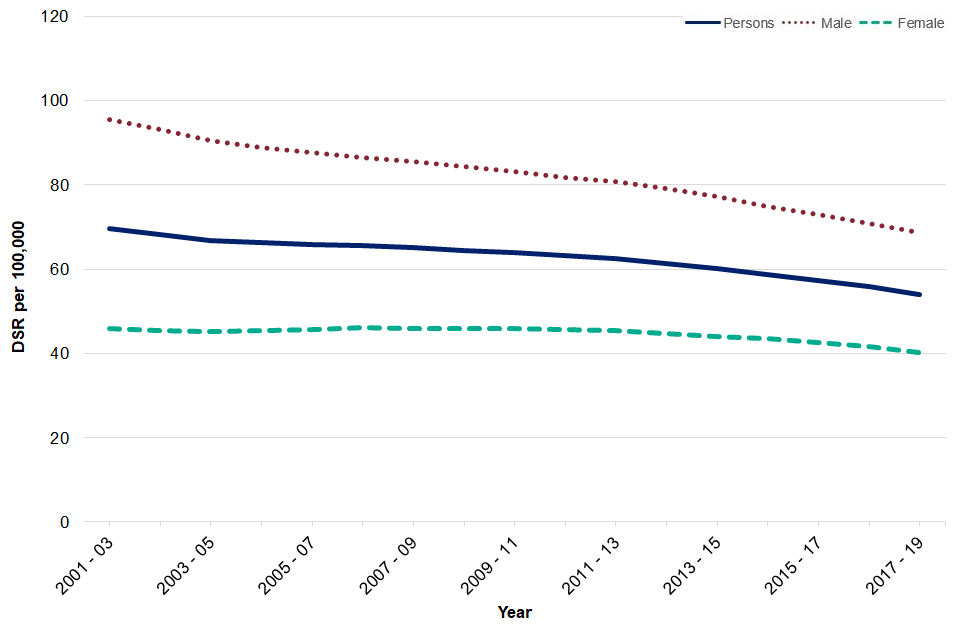
Rates did not change significantly for the other disease specific death rates including liver disease, respiratory disease and mortality from a range of specified communicable diseases including influenza. Infant mortality rates also did not see a significant change between 2016 to 2018 and 2017 to 2019 in England, however rates have shown an increasing trend in recent years (Figure 4).
Figure 4a: Mortality rates from liver disease, England, from 2001 to 2003, to 2017 to 2019
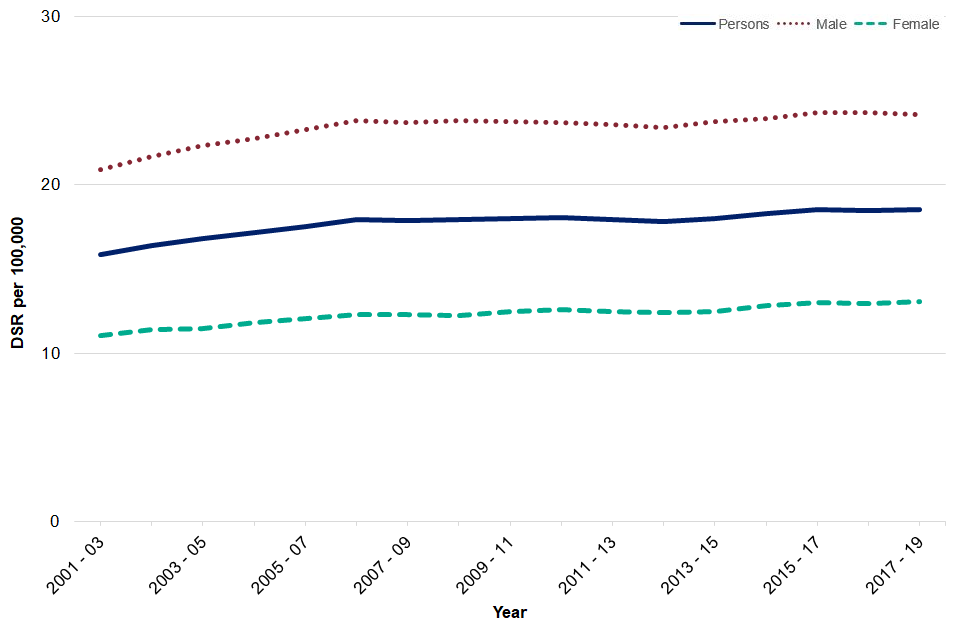
Figure 4b: Mortality rates from respiratory diseases, England, from 2001 to 2003 to 2017 to 2019
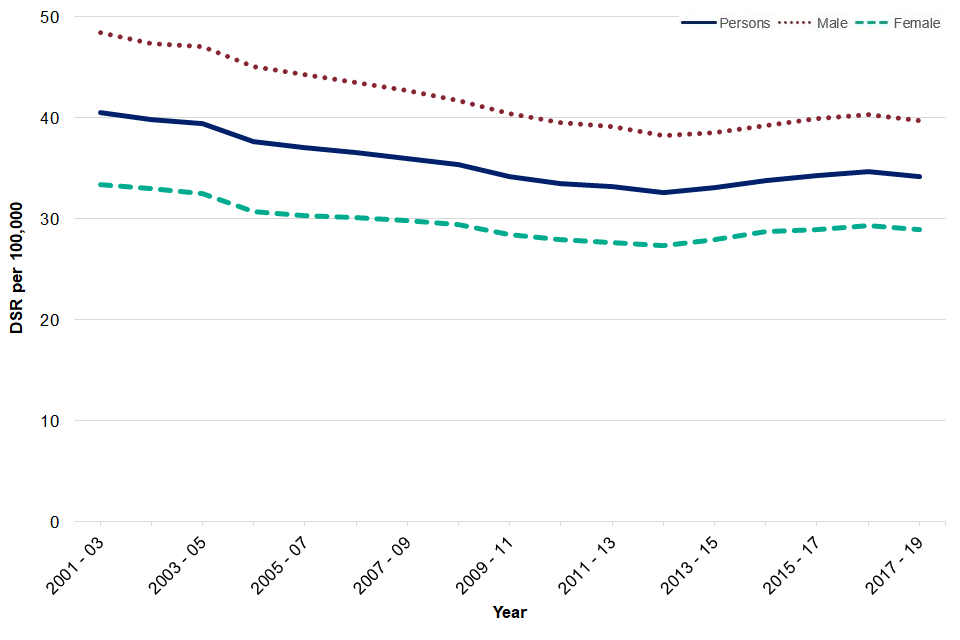
Figure 4c: Mortality rates from a range of specified communicable diseases including influenza, England, from 2001 to 2003 to 2017 to 2019
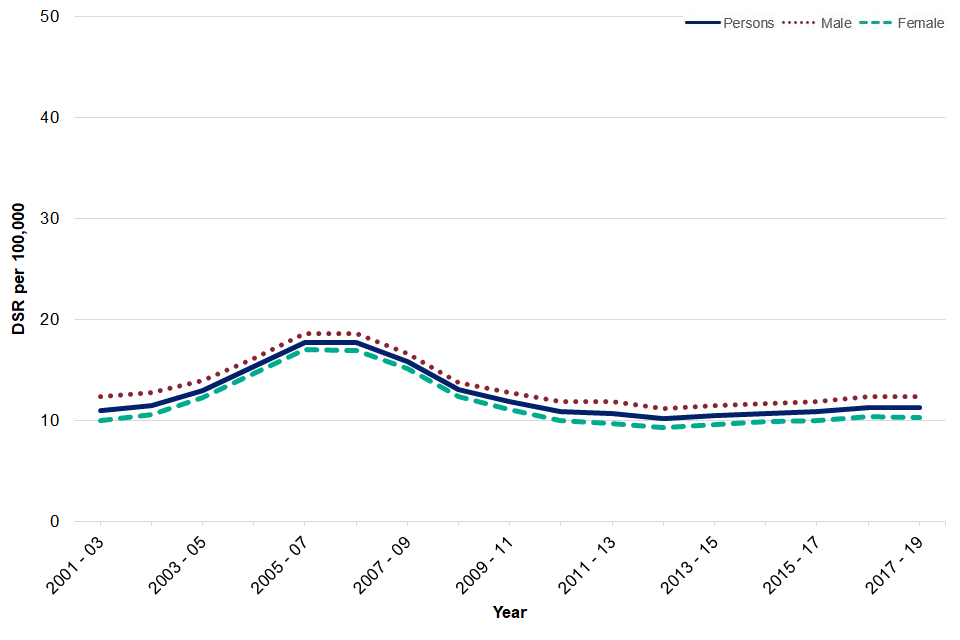
Figure 4d: Mortality rates from infant mortality, England, from 2001 to 2003 to 2017 to 2019
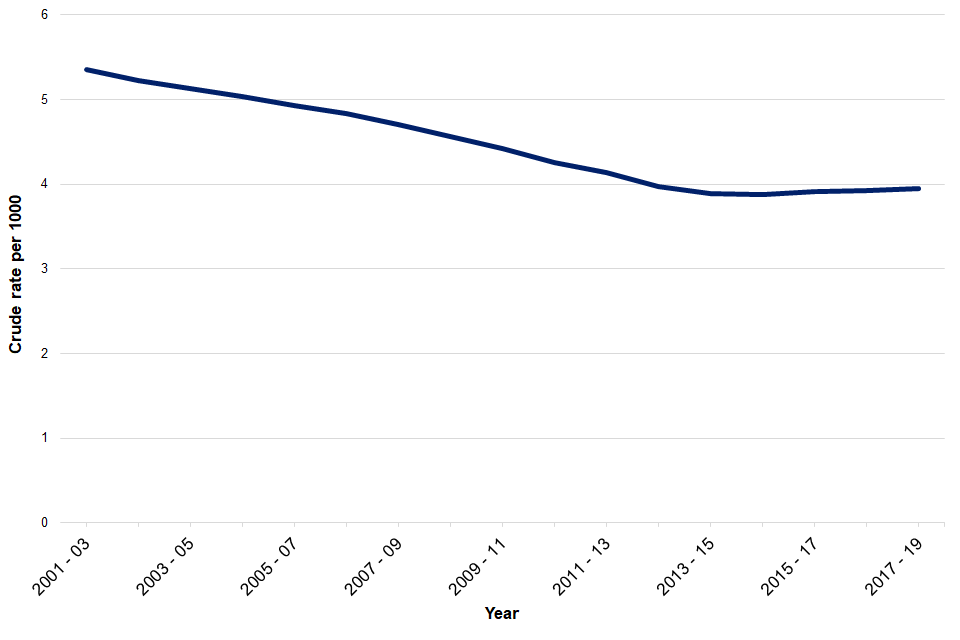
As can also be seen in Figure 4, mortality rates are higher for males compared to females for all the indicators. Rates show a declining trend for most of these indicators over the period 2001 to 2003 to 2017 to 2019, with the exception being liver disease and specified communicable diseases including influenza.
Preventable mortality indicators
A definition change has affected the five preventable mortality indicators. In 2017, the Organisation for Economic Co-operation and Development (OECD) was set up to review the definitions of avoidable mortality used internationally with a remit to create a harmonised definition. The group proposed a new definition of avoidable mortality in 2019, The new definition has been implemented from year 2001 onwards.
Under 75 mortality from all causes considered preventable have been declining year on year in England. There were just over 207,000 deaths in England considered preventable in 2017 to 2019, a significant decrease compared to 2016 to 2018. The mortality rate in 2017 to 2019 is 142 deaths per 100,000 population (Figure 5).
Figure 5: Mortality rates from all causes considered preventable, England, from 2001 to 2003 to 2017 to 2019
Under 75 CVD and cancer mortality considered preventable have both decreased significantly between 2016 to 2018 and 2017 to 2019. The rate in CVD preventable mortality has declined from 28.8 deaths to 28.2 deaths per 100,000 and the cancer preventable mortality rate has declined from 55.8 deaths to 54.1 deaths per 100,000 (Figures 6a and 6b).
Figure 6a: Mortality rates from CVD considered preventable, England, from 2001 to 2003 to 2017 to 2019
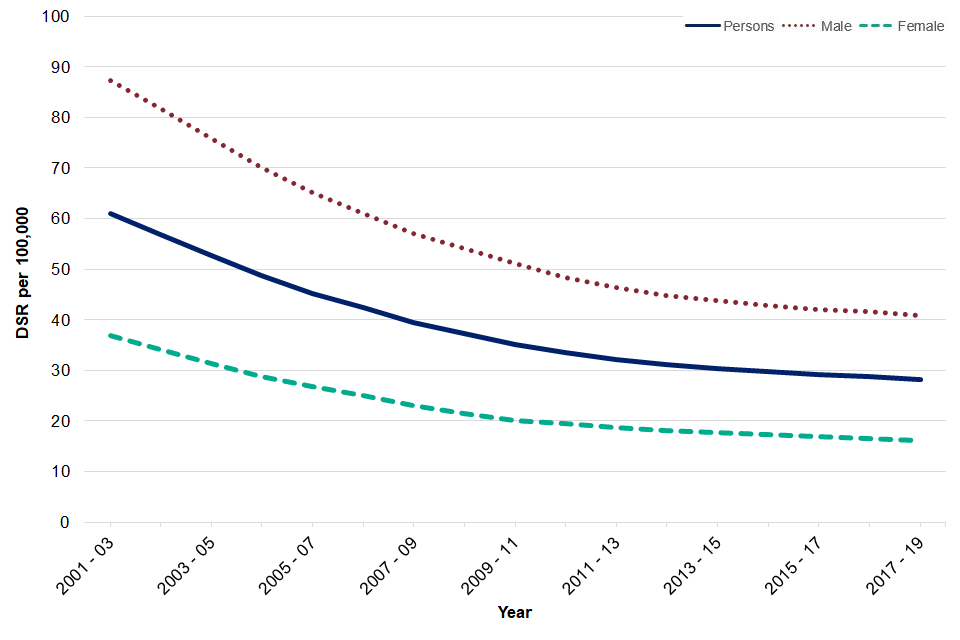
Figure 6b: Mortality rates from cancer considered preventable, England, from 2001 to 2003 to 2017 to 2019
Under 75 liver disease and respiratory disease mortality considered preventable have not shown a statistically significant change between 2016 to 2018 and 2017 to 2019 (Figures 7a and 7b).
Figure 7a: Mortality rates from liver disease considered preventable, England, from 2001 to 2003 to 2017 to 2019
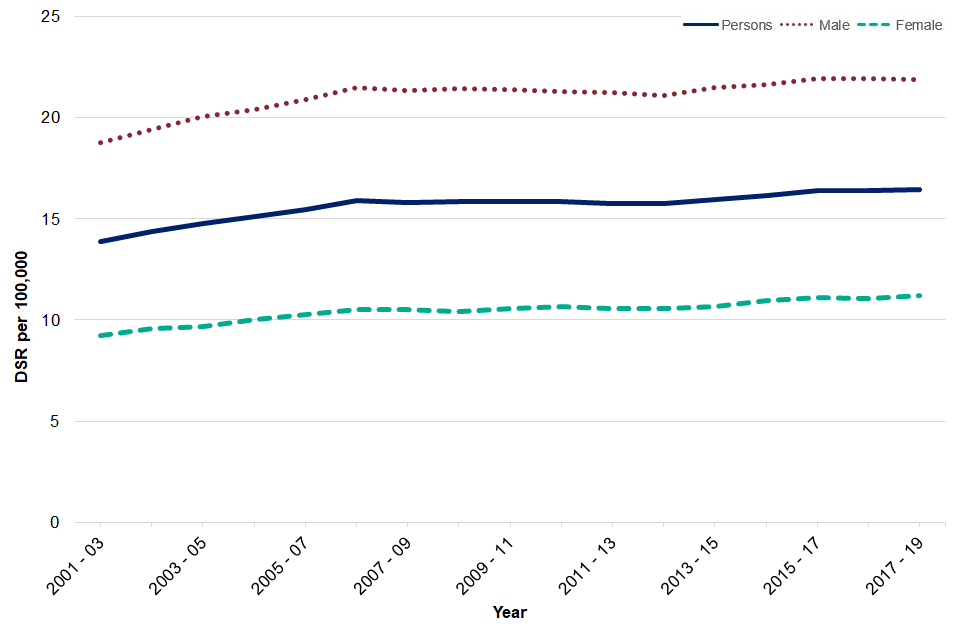
Figure 7b: Mortality rates from respiratory disease considered preventable, England, from 2001 to 2003 to 2017 to 2019
Excess Winter Deaths index
The excess winter deaths index (EWDI) is measured as the ratio of extra deaths from all causes that occur in the winter months compared with the expected number of deaths, based on the average of the number of non-winter deaths.
We have also added a new time period for the EWDI, August 2018 to July 2019, which decreased significantly compared to the previous time point. There were just over 23,000 excess winter deaths for all ages (EWDI 15.1%), 10,923 of which were in the 85 and over age group (EWDI 18.2%). These indicators have shown variability over time and can be influenced by factors such as temperature, flu season, flu vaccine effectiveness and uptake.
Unlike the mortality indicators described earlier, the ratio of excess winter deaths tends to be higher for females compared to males (Figures 8a and 8b).
Figure 8a: Excess winter deaths, England, August 2001 - July 2002 to August 2017 – July 2018, all ages split by sex
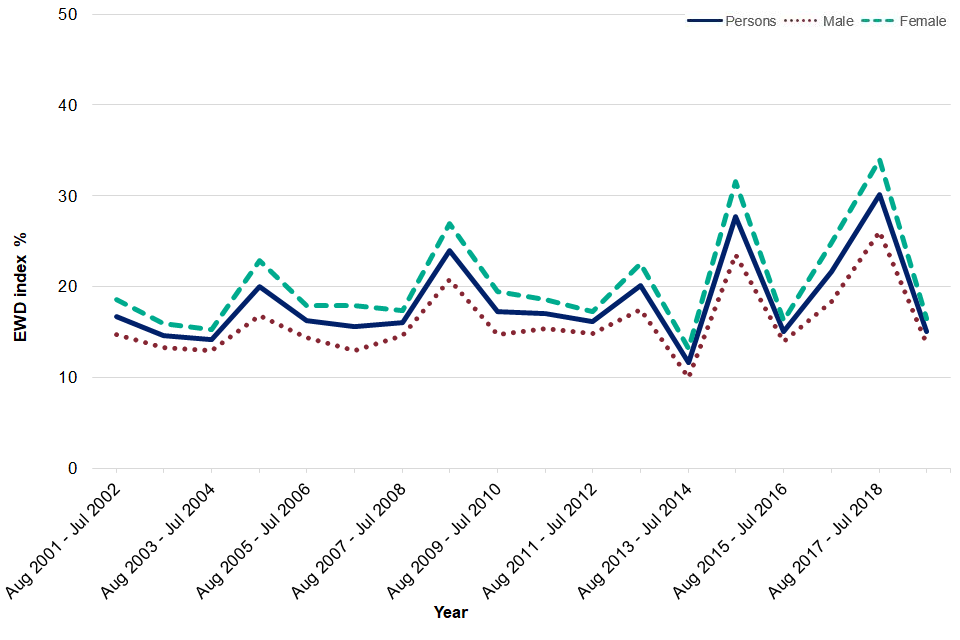
Figure 8b: Excess winter deaths, England, August 2001 - July 2002 to August 2017 – July 2018, 85+ years split by sex

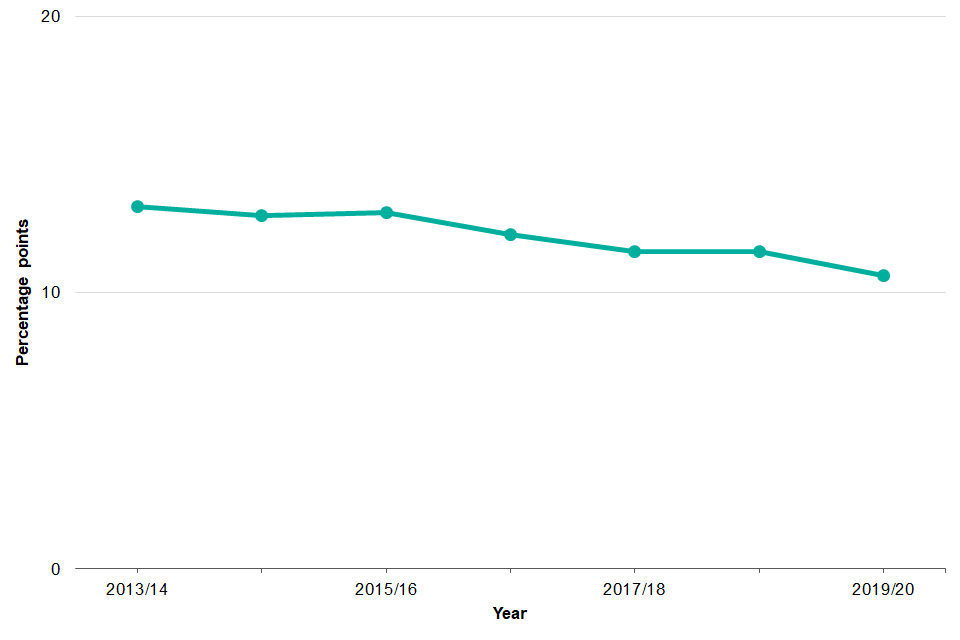
B08a - Gap in the employment rate between those with a long-term health condition and the overall employment rate
The review “Is work good for your health and wellbeing” (2006) concluded that work was generally good for both physical and mental health and wellbeing, where appropriate for the individual. The strategy for public health takes a life course approach and this indicator provides a good indication of the impact limiting long-term illness has on employment among those in the “working well” life stage.
The indicator is constructed by calculating the percentage point gap between the percentage of respondents in the Labour Force Survey who have a long-term condition who are classified as employed (aged 16 to 64) and the percentage of all respondents in the Labour Force Survey classed as employed (aged 16 to 64).
In England, this gap in employment rate decreased by 3.5 percentage points between 2013/14 and 2019/20 (Figure 9).
Figure 9: Gap in employment rate between those with a long-term health condition and the overall employment rate, England, 2013/14-2019/20
Background and further information
The Public Health Outcomes Framework sets out a high-level overview of public health outcomes, at national and local level, supported by a broad set of indicators. An interactive web tool makes the PHOF data available publicly. This allows local authorities to assess progress in comparison to national averages and their peers, and develop their work plans accordingly.
View the Public Health Outcomes Framework
Responsible statistician, product lead: Kathryn Morgan. For queries relating to this publication contact PHOF.Enquiries@phe.gov.uk
The next planned update is February 2021.