Public Health Outcomes Framework: commentary, May 2022
Updated 13 May 2022
Applies to England

© Crown copyright 2022
This publication is licensed under the terms of the Open Government Licence v3.0 except where otherwise stated. To view this licence, visit nationalarchives.gov.uk/doc/open-government-licence/version/3 or write to the Information Policy Team, The National Archives, Kew, London TW9 4DU, or email: psi@nationalarchives.gov.uk.
Where we have identified any third party copyright information you will need to obtain permission from the copyright holders concerned.
This publication is available at https://www.gov.uk/government/statistics/public-health-outcomes-framework-may-2022-data-update/public-health-outcomes-framework-commentary-may-2022
1. Background
The Public Health Outcomes Framework sets out a high-level overview of public health outcomes, at national and local level, supported by a broad set of indicators. An interactive web tool makes the PHOF data available publicly. This allows local authorities to assess progress in comparison to national averages and their peers, and develop their work plans accordingly.
2. New in this update
The latest update includes data for 18 indicators. This summary provides the main messages from indicators updated with data new to the public domain. For a complete list of indicators that have been updated please see Public Health Outcomes Framework: indicator updates.
3. Summary of selected updated indicators
3.1 A01a - Healthy life expectancy
Healthy life expectancy shows the years a person can expect to live in good health (rather than with a disability or in poor health). The healthy life expectancy indicators in the PHOF provide a high-level summary of the health of the population.
Healthy life expectancy at birth was 63.1 years for males and 63.9 years for females in 2018 to 2020 (Figure 1). At age 65, it was 10.5 years for males and 11.3 years for females (Figure 2).
Figure 1: trends in Healthy life expectancy at birth, England, 2009 to 2011 to 2018 to 2020
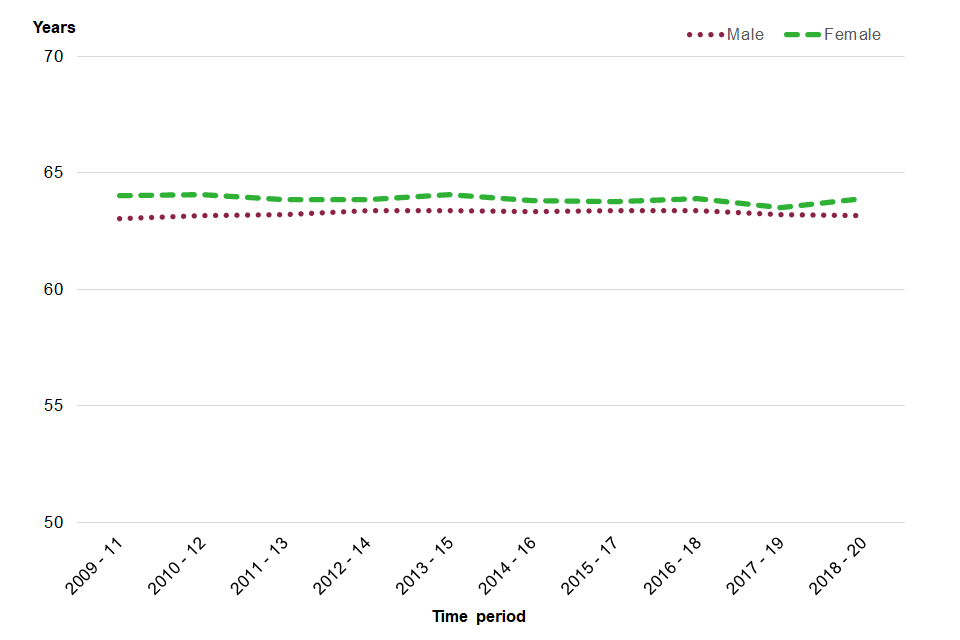
Please note that for Figure 1 the y axis does not start at 0, but at 50 years.
Figure 2: trends in Healthy life expectancy at age 65, England, 2009 to 2011 to 2018 to 2020
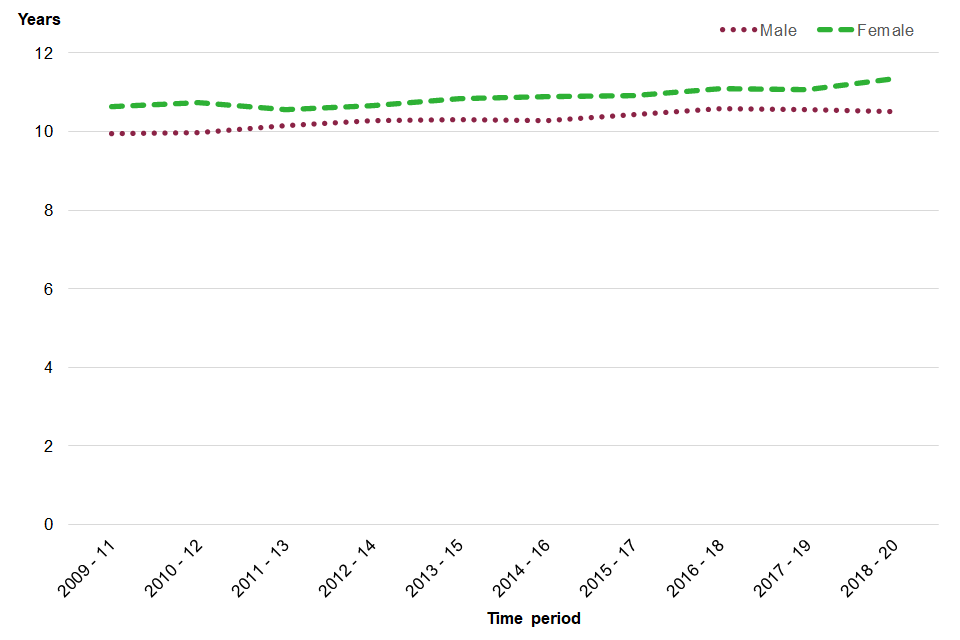
There were no significant changes in healthy life expectancy compared with the previous period. Healthy life expectancy at birth within England plateaued for both sexes between 2009 to 2011 and 2018 to 2020, whilst healthy life expectancy at 65 increased for both sexes between 2009 to 2011 and 2018 to 2020.
3.2 C16 - Percentage of adults (18+) classified as overweight or obese
Excess weight (overweight or obese) is recognised as a major determinant of premature mortality and avoidable ill-health.
In 2020 to 2021, 63.5% of adults 18 years and over in England were classified as overweight or obese. In 2020 to 2021 there was a significant increase in the proportion of adults with excess weight compared to with 2019 to 2020 (62.8%).
The percentage of adults classified as overweight or obese ranged from 56.0% in London to 69.7% in the North East. The East of England and the North East, both reported a statistically significant increase in the percentage of adults who were classified as overweight or obese compared with 2019 to 2020.
Figure 3: percentage of adults (18 years and over) classified as overweight or obese, England, between 2015 to 2016 and 2020 to 2021
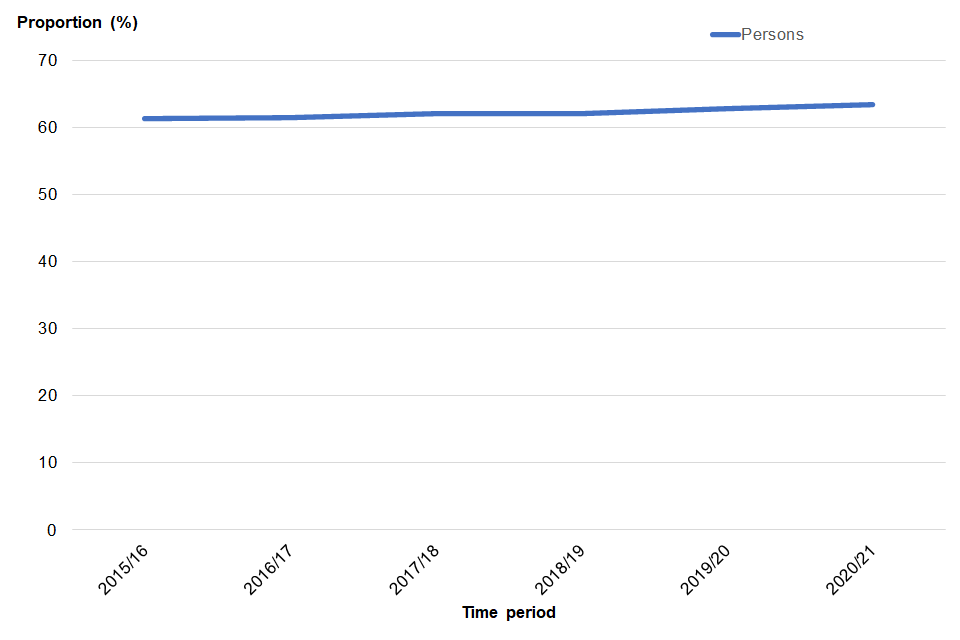
The data for this indicator has been updated and the back series revised. This was required as the adjustments applied to the self-reported height and weight data have been updated by researchers at University College of London, further details are available in the metadata for this indicator. There has also been an update to the age standardisation for this indicator. Direct age standardisation now uses the European Standard Population, which replaces the ONS mid-year population estimates for England 2016 which were previously used for this data. These changes did not change the overall value for England in 2019 to 2020, and it remained at 62.8%.
3.3 D01 - Fraction of mortality attributable to particulate air pollution (new method)
Poor air quality is a significant public health issue. The burden of air pollution in the UK in 2013 was estimated to be equivalent to approximately 28,000 to 36,000 deaths at typical ages and an associated loss of population life of 328,000 to 416,000 life years lost (Committee on the Medical Effects of Air Pollutants, (COMEAP), 2018). The inclusion of this indicator in the PHOF highlights the importance of good air quality to health.
The method used to estimate the indicator values is based on recommendations made by the Committee on the Medical Effects of Air Pollutants. Concentrations of total PM2.5, referred to as fine particulate matter, are now used as the basis for the air pollution data for this indicator. Modelled concentrations of the anthropogenic component of PM2.5 (human-made only) are no longer used because of the uncertainty associated with the assignment to anthropogenic and non-anthropogenic sources, and because non-anthropogenic sources make only a small contribution to total concentrations.
The new indicator is defined as the fraction of annual all-cause adult mortality attributable to particulate air pollution (concentrations of total PM2.5). It can be viewed as the mortality burden associated with long-term exposure to particulate air pollution at current levels, expressed as the percentage of annual deaths from all causes in those aged 30 and over. A time series with this new definition is available back to 2018. Please note that caution is needed when interpreting trends. For more details on this and the new method, see the Definitions for this indicator in the profile.
3.4 Preventable sight loss (indicators E12a, E12b, E12c and E12d)
These indicators are included in the framework to ensure that avoidable sight loss is recognised as a critical and modifiable public health issue. Prevention of sight loss will help people maintain independent lives as far as possible and reduce the need for social care support, which would be necessary if sight was lost permanently. Certifications of visual impairment (CVI) for these indicators are provided by the Certifications Office of Moorfields Eye Hospital, who are contracted by Department of Health and Social Care and the Royal College of Ophthalmologists to be responsible for certifications. Preventable sight loss is measured by 4 indicators that cover sight loss certifications from all causes (preventable and non-preventable) and the 3 most common causes of preventable sight loss:
- age-related macular degeneration (ages 65 and over)
- glaucoma (ages 40 and over)
- diabetic eye disease (ages 12 and over)
Due to the COVID-19 pandemic, fewer certifications were recorded by Moorfields Eye Hospital for the year 2020 to 2021 compared to previous years, therefore data for this period should be interpreted with caution.
The latest data are for 2020 to 2021, measured as a crude rate of new certifications per 100,000 population. The rate shows a decrease compared with the previous time period for sight loss due to age-related macular degeneration (AMD), glaucoma and diabetic eye disease, and the overall rate of new sight loss certifications (which includes both preventable and non-preventable causes of sight loss).
In England in 2020 to 2021 there were:
- 8,581 new CVIs due to AMD, which was a rate of 82 per 100,000 population aged 65 and over
- 2,613 new CVIs due to glaucoma, which was a rate of 9.2 per 100,000 population aged 40 and over
- 447 new CVIs due to diabetic eye disease, which was a rate of 0.9 100,000 population aged 12 and over
- 16,499 new sight loss certifications, which was a rate of 29.2 per 100,000 population
Figure 4: trends in sight loss certifications in England, 2010 to 2011 to 2020 to 2021
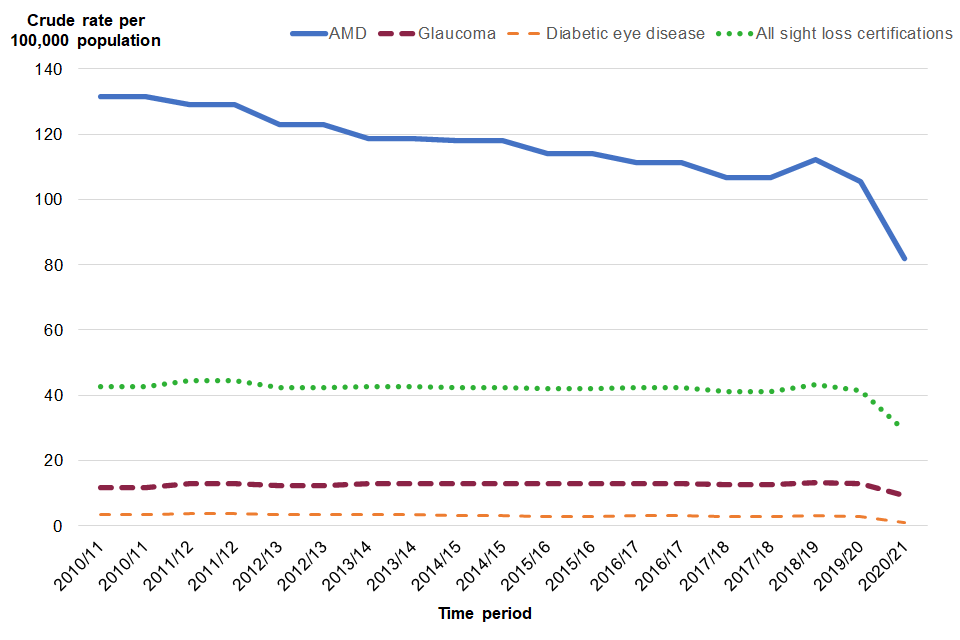
Recent trend analysis based on the 5 most recent time points, shows that the rate of new certifications of AMD and new sight loss certifications has significantly decreased, whilst for the other 2 indicators there has been no significant change over this longer period (Figure 5). It should be noted that sight loss certification is voluntary so true rates may be higher than this analysis shows.
4. References
COMEAP (2018) Associations of long-term average concentrations of nitrogen dioxide with mortality.
View the Public Health Outcomes Framework
Responsible statistician, product lead: Kathryn Morgan.
For queries relating to this publication contact PHOF.Enquiries@phe.gov.uk
The next planned update is August 2022.