Public Health Outcomes Framework: statistical commentary, February 2020
Updated 6 February 2020

© Crown copyright 2020
This publication is licensed under the terms of the Open Government Licence v3.0 except where otherwise stated. To view this licence, visit nationalarchives.gov.uk/doc/open-government-licence/version/3 or write to the Information Policy Team, The National Archives, Kew, London TW9 4DU, or email: psi@nationalarchives.gov.uk.
Where we have identified any third party copyright information you will need to obtain permission from the copyright holders concerned.
This publication is available at https://www.gov.uk/government/statistics/public-health-outcomes-framework-february-2020-data-update/public-health-outcomes-framework-statistical-commentary-february-2020
1. New in this update
New data has been added to the Public Health Outcomes Framework (PHOF) on the Fingertips platform. The latest update includes data for 55 indicators, 5 of which are new to the Framework:
- C10 - Percentage of physically active children and young people
- D03d - Population vaccination coverage - Meningococcal group B (MenB) (1 year)
- D03e - Population vaccination coverage - Rotavirus (1 year)
- D03i - Population vaccination coverage - MenB booster (2 years)
- D04a - Population vaccination coverage - diphtheria, tetanus, pertussis, polio (DTaP/IPV) (5 years old)
This summary provides the main messages from the range of updated indicators. For a complete list of indicators that have been updated please see Public Health Outcomes Framework: indicator updates
2. Summary of selected updated indicators
2.1 Life expectancy and inequality in life expectancy
Life expectancy by local authority in England for the period 2016 to 2018 was released by ONS in December 2019. This showed small increases in male and female life expectancy, further detail can be found in the ONS release here.
This PHOF release includes updated data on inequality in life expectancy for England, regions and local authorities. Inequality in life expectancy, by deprivation level, in the PHOF is estimated using a summary measure called the slope index of inequality (SII). The higher the value of the SII, the greater the inequality within an area. The further information section includes a detailed user guide.
Inequality in life expectancy at birth was 9.5 years for males and 7.5 years for females at birth in 2016 to 2018. At age 65, the values are 5.0 years for males and 4.6 years for females. At each age group there was a slight widening of the inequality of 0.1 years. These changes were not significant compared with the previous period but continue the trend of widening inequality in life expectancy at birth within England since 2010 to 2012.
Figure 1: trends in inequality in life expectancy at birth and 65 in males and females
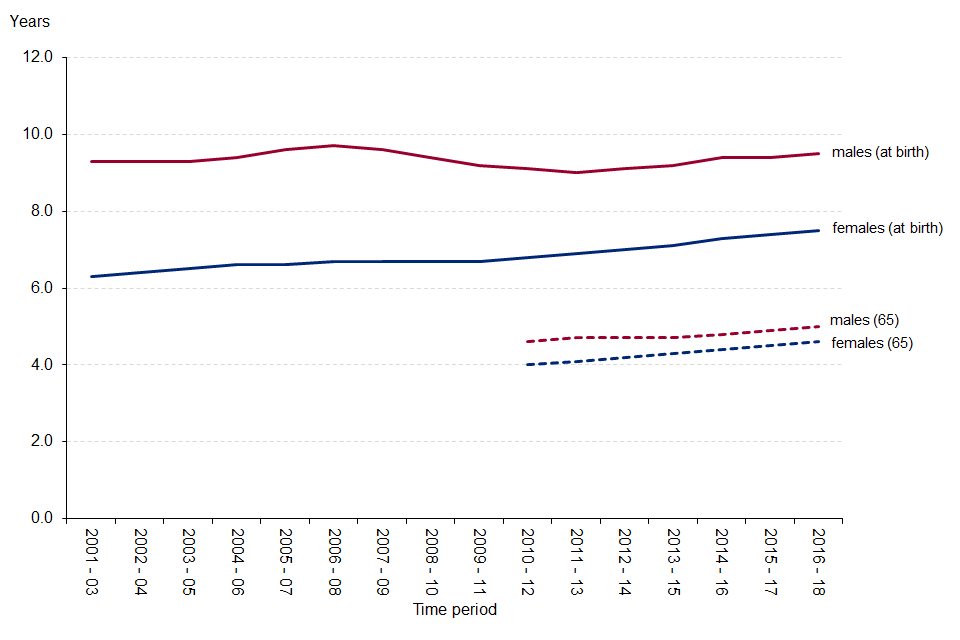
Figure 1: trends in inequality in life expectancy at birth and 65 in males and females
2.2 Hospital admissions for unintentional and deliberate injuries in children and young people
Injuries are a leading cause of hospitalisation and represent a major cause of premature mortality for children and young people. They are also a source of long-term health issues.
The crude rates of admission for unintentional or deliberate injuries for children aged 0 to 4 and 0 to14 in England were 123.1 and 96.1 per 10,000 population respectively in the financial year 2018 to 2019. Neither were significant changes compared with the previous period, but the longer-term trend over the last 5 periods shows a continued decrease.
For young people aged 15 to 24, the latest figure for England of 136.9 per 10,000 population in financial year 2018 to 2019 was a significant increase from the previous period. The longer-term trend has not changed significantly over the last 5 periods.
Figure 2: hospital admission rate for unintentional and deliberate injuries in children and young people
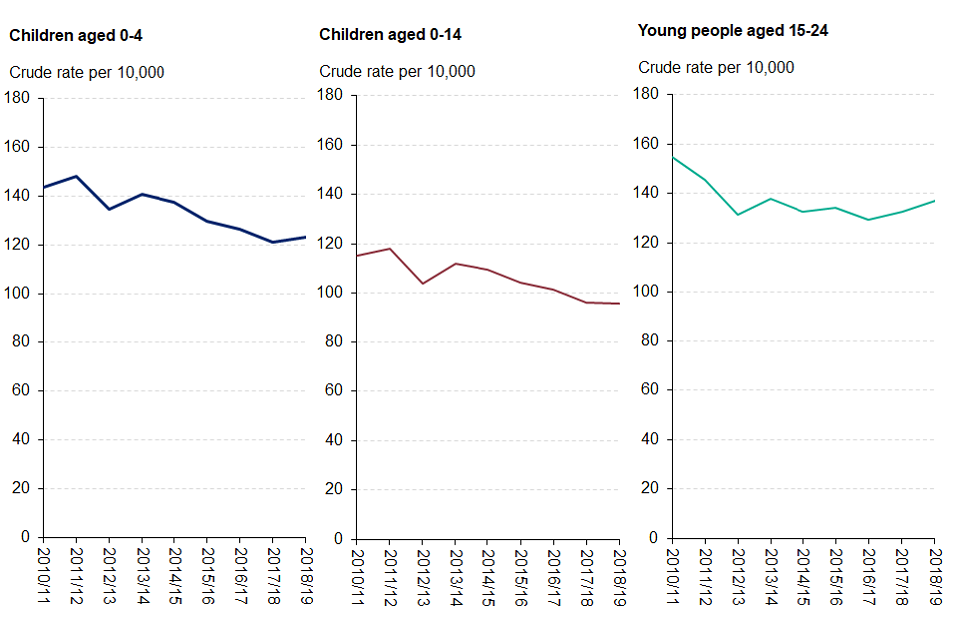
Figure 2: hospital admission rate for unintentional and deliberate injuries in children and young people
2.3 Emergency hospital admissions for intentional self-harm
This indicator measures self-harm events severe enough to warrant hospital admission (approx. 99% of hospital admissions for intentional self-harm are emergencies). These hospital admissions are being used as a proxy of the prevalence of severe self-harm, but only account for a small proportion of the health and wellbeing burden of self-harm.
The emergency admission rate in England for intentional self-harm was 193.4 per 100,000 population in the financial year 2018 to 2019 (108,803 emergency admissions), a significant increase on the previous period. The rate has stayed relatively consistent since the financial year 2010 to 2011 with a peak value of 205.9 in 2013 to 2014 and a minimum of 185.3 in 2016 to 2017.
Figure 3: emergency admission rate for intentional self-harm
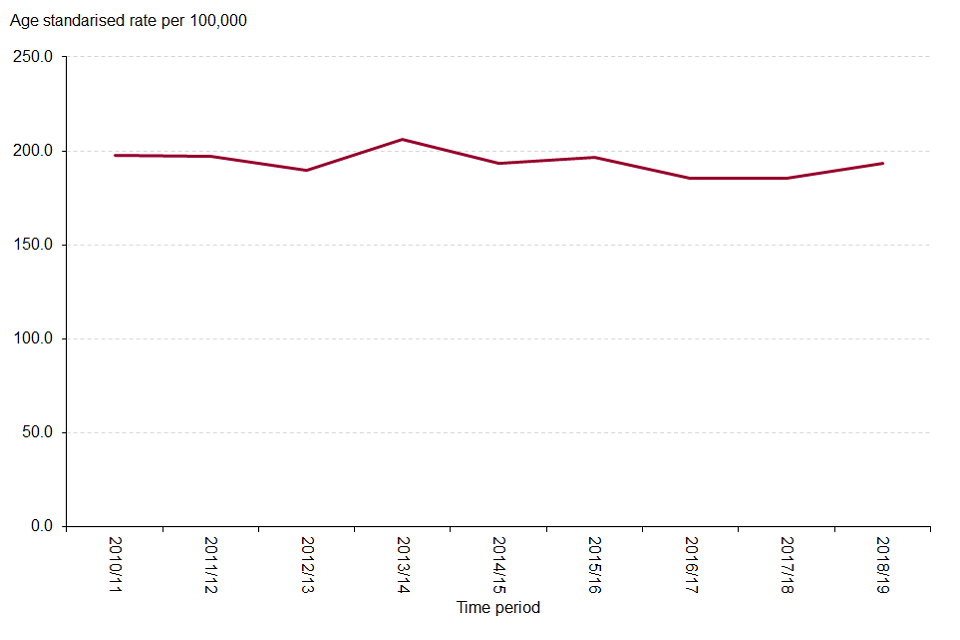
Figure 3: emergency admission rate for intentional self-harm
2.4 Hospital admissions for violence, including sexual violence
This indicator measures the number of emergency hospital admissions for violence which only accounts for a small proportion of total cases of violence as it only includes those severe enough to warrant admission to hospital. The PHOF includes two further indicators on violent crime based on police recorded crime data.
The admission rate in England for violence was 44.9 per 100,000 population in financial period 2016 to 2019 (76,255 hospital admissions over the three-year period), a significant increase on the previous period. The rate in England had been reducing year on year from a peak of 61.7 per 100,000 in 2009 to 2012.
Figure 4: Hospital admissions rate for violence, including sexual violence
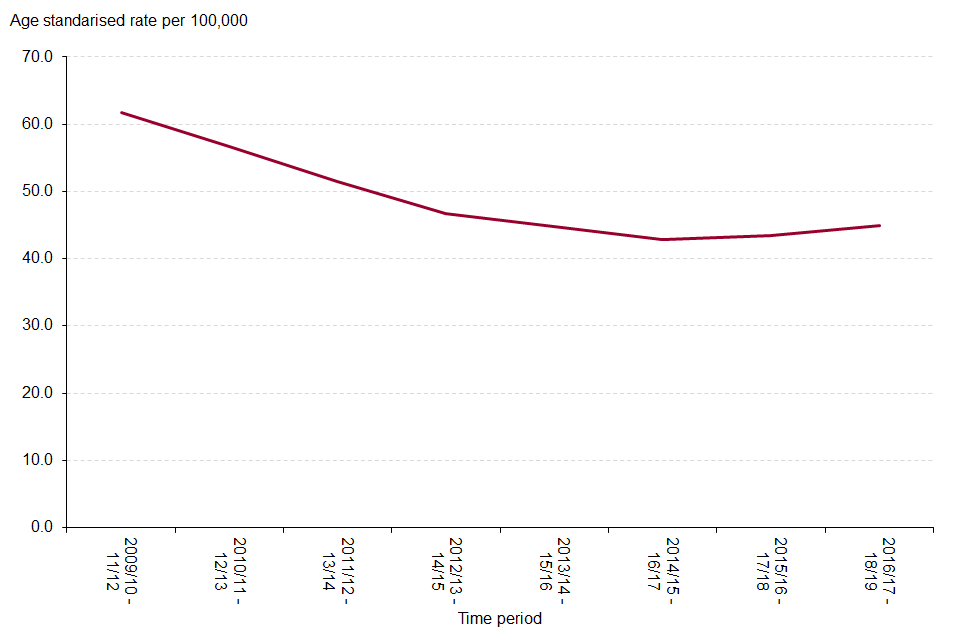
Figure 4: Hospital admissions rate for violence, including sexual violence
2.5 Emergency admissions for falls and hip fractures
Falls are the largest cause of emergency hospital admissions for older people, and significantly impact on long term outcomes. Hip fracture is a debilitating condition and has been demonstrated to have an immediate impact on an individual’s independence [footnote 1]. Both these causes of hospital admission can lead to people moving from their own home to long-term nursing or residential care.
The rates of emergency hospital admission due to falls in the financial year 2018 to 2019 increased in 2 of the 3 age groups included in the PHOF (65 years and over and 80 years and over), for those aged 65 years and over the rate was 2,198 per 100,000 (226,567 hospital admissions). Conversely, emergency admission rates for hip fractures decreased significantly across all 3 age groups, during the same period. The rate was 558.4 per 100,000 (57,675 hip fractures) in those aged 65 years and over. The rate for females is consistently higher than that for males for both falls and hip fractures.
Figure 5: Emergency admission rate for hip fractures and falls in males, females and persons aged 65 years and over
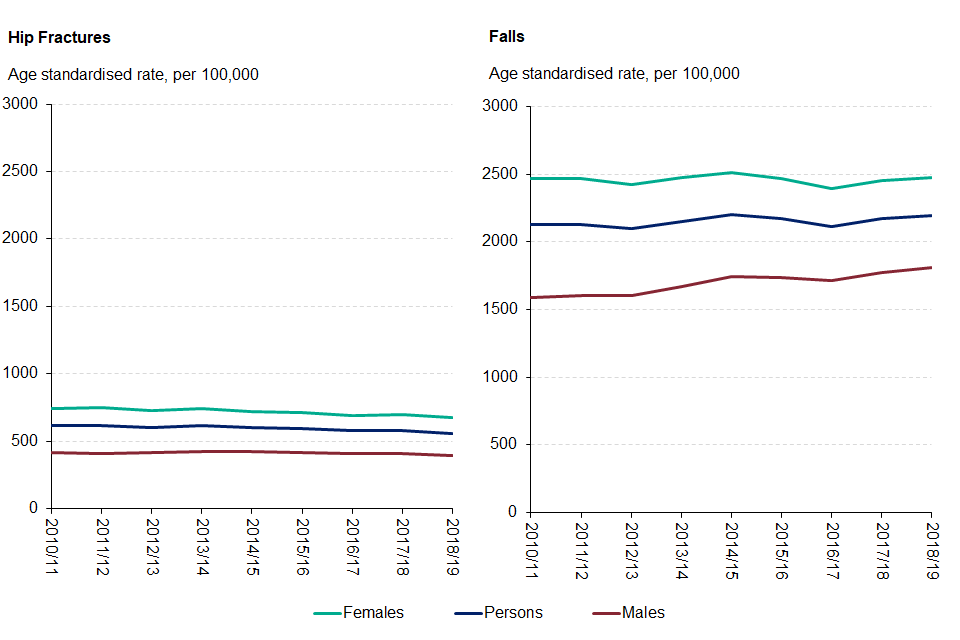
Figure 5: Emergency admission rate for hip fractures and falls in males, females and persons aged 65 years and over
2.6 Gap in employment rates between those with a learning disability, those in contact with secondary mental health services and the overall population
These indicators provide an indication of the impact learning disabilities and mental health conditions have on employment. The overall employment rate (in those aged 16 to 64) in England in the financial year 2018 to 2019 was 75.6% (source: annual population survey, 2018 to 2019, available from www.nomisweb.co.uk).
In the financial year 2018 to 2019, the gap in the employment rate for those in contact with secondary mental health services and the overall employment rate was 67.6 percentage points, this has narrowed since 2017 to 2018 (68.2 percentage points). The gap in the employment rate between those with a learning disability and the overall employment rate was 69.7 percentage points, this has widened since 2017 to 2018 (69.2 percentage points).
3. Notes
Change to definition of deprivation deciles used to calculate inequality in life expectancy.
For 2016 to 2018, the 2019 version of the index of multiple deprivation (IMD) was used to allocate small areas to deprivation deciles as the approach is to use the version of IMD which most closely aligns with the time period of the data. The 2015 version of IMD had previously been used for 2010 to 2012 up to 2015 to 2017. A summary of the impact of this change has been produced and can be downloaded from the further information section of the PHOF.
It is important to be aware that SII values should not be compared across different geographies. The SII for England takes account of the full range of deprivation and mortality across the whole country. This does not provide a suitable benchmark with which to compare local authority results, which include the range of deprivation and mortality within much smaller geographies.
4. Background and further information
The Public Health Outcomes Framework sets out a high-level overview of public health outcomes, at national and local level, supported by a broad set of indicators. An interactive web tool makes the PHOF data available publicly. This allows local authorities to assess progress in comparison to national averages and their peers, and develop their work plans accordingly.
View the Public Health Outcomes Framework
Responsible statistician, product lead: James Westwood. For queries relating to this publication contact PHOF.Enquiries@phe.gov.uk
The next planned update is May 2020.
5. References
-
National Hip Fracture Database (NHFD), National Hip Fracture Database National report 2013. Available at: http://www.nhfd.co.uk/20/hipfractureR.nsf/luMenuDefinitions/CA920122A244F2ED802579C900553993/$file/NHFD%20Report%202013.pdf?OpenElement last Accessed 30/01/2020 ↩