Police workforce, England and Wales: 31 March 2021 second edition
Updated 30 March 2022
Applies to England and Wales

© Crown copyright 2022
This publication is licensed under the terms of the Open Government Licence v3.0 except where otherwise stated. To view this licence, visit nationalarchives.gov.uk/doc/open-government-licence/version/3 or write to the Information Policy Team, The National Archives, Kew, London TW9 4DU, or email: psi@nationalarchives.gov.uk.
Where we have identified any third party copyright information you will need to obtain permission from the copyright holders concerned.
This publication is available at https://www.gov.uk/government/statistics/police-workforce-england-and-wales-31-march-2021/police-workforce-england-and-wales-31-march-2021
Frequency of release: Biannual
Forthcoming releases: Home Office statistics release calendar
Home Office responsible statistician: John Flatley
Press enquiries: pressoffice@homeoffice.gov.uk
Telephone: 0300 123 3535
Public enquiries: crimeandpolicestats@homeoffice.gov.uk
This release is an end-year update of the Police workforce, England and Wales publication series, containing information on police workers in post on 31 March 2021. This release also provides more detailed information on police workers, such as gender, ethnicity and age breakdowns, as well as roles that officers perform.
While this bulletin contains information on workers as at 31 March 2021, a second statistical bulletin on ‘police officer uplift quarterly update to June 2021’ has also been published alongside this release. This second release provides information on progress with the recruitment of an additional 20,000 officers in England and Wales as at June 2021.
135,301 full-time equivalent (FTE) officers were in post as at 31 March 2021 in the 43 territorial police forces in England and Wales.
-
this was an increase of 5% on March 2020 (up 6,191 FTEs from 129,110 officers) and the largest year on year change since the year ending March 2004 (when comparable records began)
-
excluding transfers, 12,127 new police officers (FTE) joined the 43 territorial police forces in England and Wales in the year ending March 2021
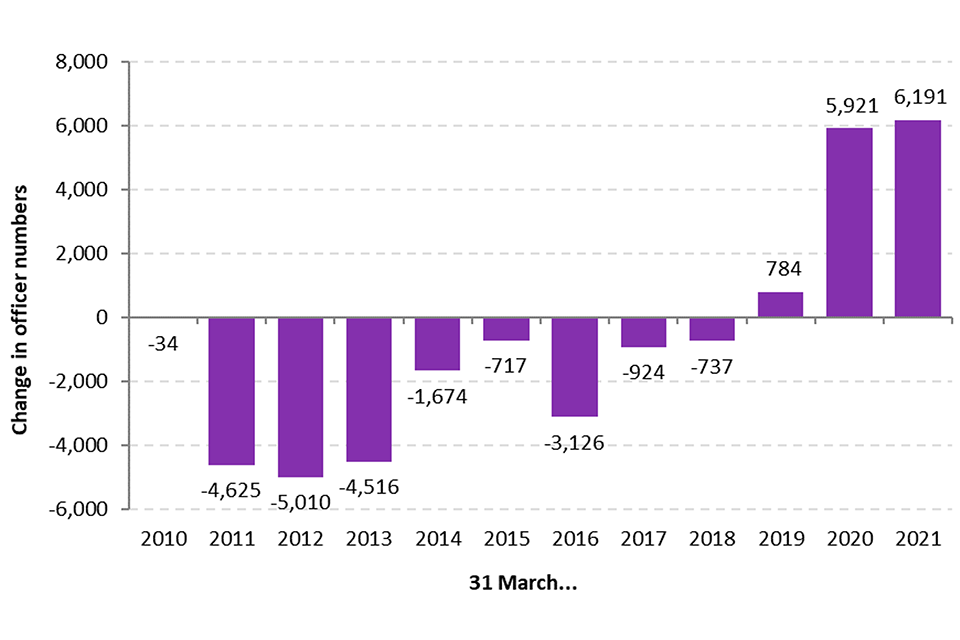
Figure 1: Year on year change in officer numbers (FTE)
- the total workforce (officers, staff, Police Community Support Officers and designated officers) was at 220,519 FTE on the same date, an increase of 5% on the previous year
2 Introduction
2.1 General introduction
This release contains statistics on the numbers of police officers, police staff, Police Community Support Officers (PCSOs), designated officers [footnote 1], special constables and Police Support Volunteers (PSVs) in post on 31 March 2021. The statistics cover all the 43 territorial police forces in England and Wales. Also, data from the British Transport Police (BTP), and from the National Crime Agency (NCA) are provided in the accompanying data tables, though their figures are largely excluded from analysis within this report and do not count towards the England and Wales total (which relates to the 43 territorial forces only).
Unless otherwise stated, total workforce figures quoted in the bulletin include those on career breaks or other forms of long term absence, as well as those seconded into police forces from other forces or central services. It excludes those seconded out from forces to central services. The workforce figures in this release are all presented on a full-time equivalent (FTE) basis unless indicated otherwise. The accompanying data tables provide the same information on a headcount basis.
The user guide to Police Workforce Statistics contains further information, including a glossary, conventions used, and other background information. It contains further information on the quality and limitations of the various datasets, and the ways in which the Home Office engages with users of the statistics.
The data in this release, as well as headcount figures, can be found in the ‘Police workforce, England and Wales, 31 March 2021 tables.
2.2 New content in this release
As part of the initiative to improve data on the police workforce and to align the monthly data collected for the police uplift programme with these statistics, a number of changes have been made to the data collection template, particularly around the collection of data on protected characteristics.
The Home Office, the NPCC and the College of Policing have been collaborating in developing a National Standard for Workforce Data. These Data Standards draw on existing harmonised standards set out by the Government Statistical Service and aim to bring more standardisation within policing for the collection of data on protected characteristics (and some other demographic information). The variables currently covered by the Standards are: Ethnicity, Age, Religion or Belief, Disability, Sexual orientation, Gender, Sex, and Gender Reassignment. A full breakdown of the standards can be found in the user guide.
Information on their protected characteristics is self-reported by officers on police force HR systems. Recent changes to police force HR systems to align with the new Data Standards have allowed all staff the opportunity to review existing records and declare further information on protected characteristics. However, many officers are yet to update their profiles and, as such, data are not currently complete.
Since data on gender and ethnicity have been collected for longer, the data are more complete and reliable, so this bulletin focusses on these protected characteristics only. However, since the quarter ending June 2021, experimental statistics are included in an annex to the ‘police officer uplift statistics’ (which are published quarterly) to provide information on the proportion of officers broken down by sexual orientation, age and disability status.
The Home Office and NPCC continue to work with police forces to improve the quality of data collected on protected characteristics. It is expected that this will result in more complete data for officers and new recruits, as well as updated records for those officers in post where a characteristic was previously not stated.
2.4 National Statistics Status
The Office for Statistics Regulation (the regulatory arm of the UK Statistics Authority) has confirmed the continued designation of these statistics as National Statistics. This means that these statistics meet the highest standards of trustworthiness, impartiality, quality and public value, and are fully compliant with the Code of Practice for Statistics.
Given the known issues around the quality of the data, statistics in this release on ‘Length of service’ are designated as Official Statistics, and not National Statistics. Further information can be found in the relevant section (4.7).
Revisions to this bulletin
Following the first publication of this release, and during quality assurance checks for the publication of the quarterly ‘police officer uplift statistics’, analysts found an error in the code used to produce data on the age of the police workforce. The code had inadvertently placed all police workers with an age of 56 years in the “not stated” category. This release has therefore been revised, and a summary of revisions can be found in Table A below.
Table A: Revisions made since first publication
| Force | Metric | First publication (headcount) | Revised (headcount) | Difference (headcount) |
|---|---|---|---|---|
| All – England and Wales1 | All workers - Aged over 55 | 19,273 | 22,675 | 3,402 |
| All – England and Wales1 | All workers - Age not stated | 3,651 | 249 | -3,402 |
Notes:
- Excludes British Transport Police.
At a national level, the number of workers with a “not stated” age has reduced by 3,402, and these officers have now been correctly placed in the “over 55” age group. Prior to the revision the age of the worker was recorded as “not stated” in 1.5% of cases. Following the revision the age of the worker is “not stated” in just 0.1% of cases. Relevant sections of Chapter 6 have been updated to reflect this revision, as have the following:
Furthermore, while no revisions have been made to the data, analysts spotted an error with the formula in Table H1 and Table H4, which meant the totals were not summing as they should. This has now also been updated.
3 Headline workforce figures
Key results
-
as at 31 March 2021 there were 220,519 FTE police workers (including staff) employed by the territorial forces in England and Wales, an increase of 5% on the previous year
-
in addition, there were 5,077 FTE National Crime Agency (NCA) officers in England and Wales - NCA officers include both those warranted with the powers of a police constable or other powers, as well as civilians involved in the investigation of serious and organised crime (non-warranted officers)
-
as at 31 March 2021, there were 135,301 (FTE) officers in the 43 territorial police forces in England and Wales, a 5% increase from 129,110 officers the year earlier and the largest number of officers since as at 31 March 2011 (when there were 139,110 officers) but below the peak as at 31 March 2009 (when there were 143,769 officers)
-
following the government’s pledge in 2019 to recruit an additional 20,000 officers by March 2023, there has been a 10% increase in the number of police officers from 123,189 as at 31 March 2019
3.1 Total police workforce
As at 31 March 2021, there were 220,519 FTE workers employed by the 43 territorial police forces in England and Wales (Table 3.1), an increase of 9,831, or 5%, compared with a year earlier (when there were 210,689 workers).
Table 3.1: Police workforce, as at 31 March 2021, England and Wales
| Rank | 2020 | 2021 | Percentage change (%) |
|---|---|---|---|
| Chief Officer1 | 231 | 236 | 2.2 |
| Superintendent (includes chiefs) | 1,252 | 1,277 | 2.0 |
| Chief Inspector | 1,732 | 1,846 | 6.6 |
| Inspector | 5,654 | 5,941 | 5.1 |
| Sergeant | 18,826 | 19,211 | 2.0 |
| Constable | 101,415 | 106,790 | 5.3 |
| Total police officer ranks | 129,110 | 135,301 | 4.8 |
| Police staff and designated officers | 72,331 | 75,934 | 5.0 |
| Police community support officer | 9,248 | 9,284 | 0.4 |
| Total police workforce | 210,689 | 220,519 | 4.7 |
| Special constabulary2 | 9,571 | 9,174 | -4.1 |
| Police support volunteers2 | 8,272 | 8,014 | -3.1 |
Source: Home Office, Workforce Open Data Table
Notes:
- Includes assistant chief constables, deputy chief constables and chief constables, and their equivalents in the Metropolitan Police and City of London Police. These police officers were previously referred to as Association of Chief Police Officer (ACPO) ranks; however on 1 April 2015 ACPO was replaced by the National Police Chiefs’ Council (NPCC).
- Special constables and police support volunteers do not have contracted working hours so their numbers are provided on a headcount rather than a FTE basis.
There were small increases in most worker types compared with the previous year, except among special constables and Police Support Volunteers, whose numbers fell by 4% and 3% respectively. The largest volume increase was in police officers (which increased by 6,191 FTE) and reflects the drive to recruit an additional 20,000 police officers by March 2023. Some of these new recruits may have joined following experience as a special constable or PCSO, which may explain some of the falls in those categories.
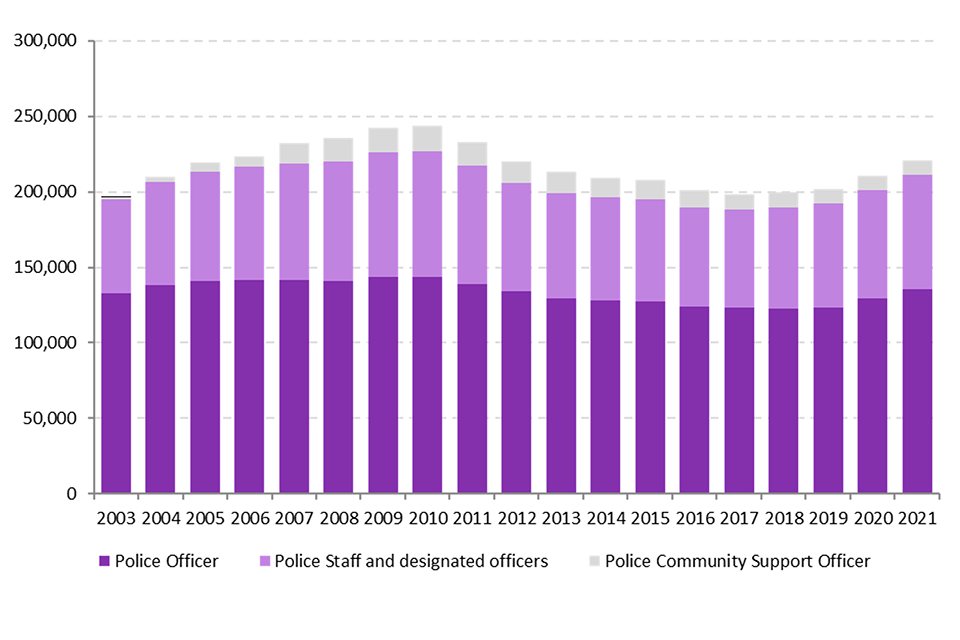
Figure 3.1 shows the long-term trend in the police workforce numbers, broken down by worker type. Workforce numbers had been increasing to 2010, then decreased in each year before reaching a low-point in 2017. In the last four years the previous downward trend has reversed, and the latest figures show a total workforce increase of 5% compared with the previous year.
Figure 3.1: Police workforce, by worker type, as at 31 March 2003 to 31 March 2021, England and Wales1
Source: Home Office, Table H3
Notes:
- Some forces are unable to provide data on some types of designated officers separately. In these cases, designated officers have been counted under police staff.
In addition to the 220,519 police workers, there were 9,174 special constables (headcount) in the 43 police forces in England and Wales on 31 March 2021, and 8,014 Police Support Volunteers (PSVs). Special constables and PSVs do not have contracted working hours so their numbers are provided on a headcount rather than an FTE basis.
3.2 Police officers
There were 135,301 full-time equivalent (FTE) police officers in the 43 police forces as at 31 March 2021 (137,690 in headcount terms). This was the highest number of officers since 31 March 2011. However, the latest figures are still 6% lower than the peak in 2009, when there were 143,769 police officers, representing a total decrease of 8,467 FTEs.
While not included in the headline figures, the British Transport Police employed 2,902 FTE police officers in England and Wales.
On 5 September 2019 the Prime Minister announced the government commitment to recruit an additional 20,000 police officers in England and Wales by 31 March 2023. The first phase of this pledge was to recruit up to 6,000 additional officers by the end of March 2021. Officer numbers grew 5% in the year to 31 March 2021, the second consecutive period following this announcement of the largest year on year growth since the year ending March 2004. Statistics on the progress towards this recruitment target, as well as the methodology for counting additional officers, is published separately in the quarterly ‘police officer uplift statistics’.
Figure 3.2 shows the number of police officers in the 43 territorial forces increased by 6,191 full-time equivalents (5%) compared with a year earlier. This was the third consecutive annual increase after a previous downward trend since 2010. This equated to an increase of 6,114 in headcount terms, which was also a 5% increase on the headcount as at 31 March 2020 (from 131,576 to 137,690).
Figure 3.2: Change in the number of police officers (FTE), as at 31 March 2010 to 31 March 2021, compared with the previous 12 months, England and Wales
Source: Home Office, Table H3
3.3 Other police worker and volunteers
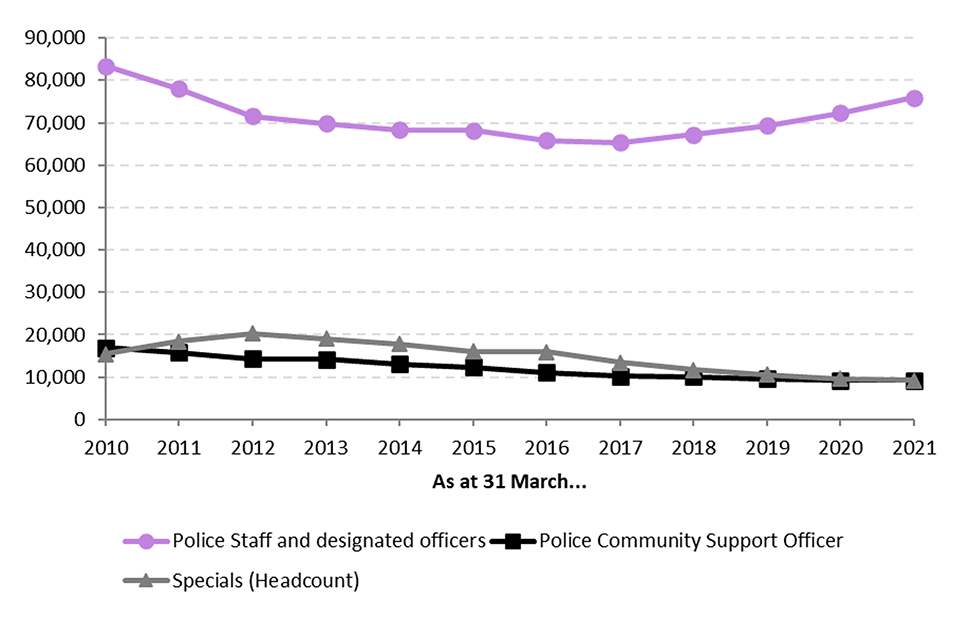
Figure 3.3 shows the trend in the number of other police workers and volunteers over the last 10 years. Between 2010 and 2017, the number of police staff numbers and designated officer numbers had been falling. However, the number of Police Community Support Officers (PCSOs) rose slightly as at the year 31 March 2021 after falling each year since 2010. There were 9,284 PCSOs in the latest year (up 0.4% on the same point in 2020). In contrast, the number of special constables continued to fall to 9,174 (down 4%) from 9,571 the previous year.
Figure 3.3 Police staff and designated officers, Police Community Support Officers, and special constables, 31 March 2010 to 31 March 2021, England and Wales
Source: Home Office, Table H3
4 Promotions, joiners and leavers
Key results
In the year ending 31 March 2021:
-
12,127 full-time equivalent (FTE) police officers joined the 43 police forces in England and Wales (excluding transfers)
-
this volume of joiners is 756 below levels seen the previous year, but is the second highest number since comparable data collection began in the year ending March 2007
-
6,018 police officers (FTE) left the 43 territorial police forces (excluding transfers), accounting for 4.7% of officers employed by the forces at the start of the year
-
this was the lowest number of annual leavers (excluding transfers) since the year ending 31 March 2010
-
3,343 police officers received a promotion in 43 police forces in England and Wales accounting for 2.4% of all officers
This chapter presents statistics on the number of promotions, joiners and leavers in the police, as well as information on the length of service of current police officers.
Data on promotions are based on the number of officers promoted during the financial year and are on a headcount basis. Data are collected by the rank to which an officer is promoted. Officers on temporary promotion and those promoted on transfer from another police force are not included.
Data on joiners and leavers are based on the number of workers who joined and left the force during the financial year and are based on full-time equivalents (FTEs). Joiner rates are calculated by dividing the number of joiners during the financial year by the total number of workers as at the end of the year (i.e. 31st March). This indicates how many of those employed by the force at the end of the year joined during the year.
Wastage rates are calculated by dividing the number of leavers during the financial year by the total number of workers at the end of the previous year (i.e. as at 31 March). This indicates how many of those employed at the start of the current year left during the year.
These wastage rates are a good indication of turnover within the police but not a precise one as individual workers cannot be tracked. Some workers may join and leave the force during the same year and will only be captured in the denominator (i.e. those employed at the end of the previous year). This is particularly for those worker types with higher turnover, such as special constables.
There are several routes via which officers can join or leave the police:
Joiners
Standard direct recruit: Individuals joining the police for the first time, including via Direct Entry, Fast Track and Police Now schemes. This also includes Police Community Support Officers and other police staff who are joining as a police officer.
Re-joining: Individuals who have previously left the forces, but have since re-joined.
Previously special constable: Individuals who are joining as a police officer having previously been a special constable.
Transfer: Individuals joining from one of the other 43 territorial police forces in England and Wales, or another non-Home Office force (e.g. the British Transport Police).
Leavers
Death Those who have died, either on active duty or otherwise.
Dismissal or contract termination: Individuals who have been required to resign, made compulsorily redundant, or have had their contract terminated. While these figures will include dismissals for misconduct, they are not exclusively misconduct cases, as they also include redundancies and contract terminations.
Medical retirement: Individuals who have retired on ill health grounds.
Normal retirement: Individuals who have retired, not on ill health grounds.
Transfer: Individuals leaving to join one of the other 43 territorial police forces in England and Wales, or a non-Home Office force (e.g. the British Transport Police).
Voluntary resignation: Individuals who resign or leave under voluntary exit schemes. Special constables, who leave to join the regular constabulary, or have been inactive for more than 12 months, are included here.
Further information on the types of police officer joiner and leaver can be found in the user guide.
4.1 Promotions
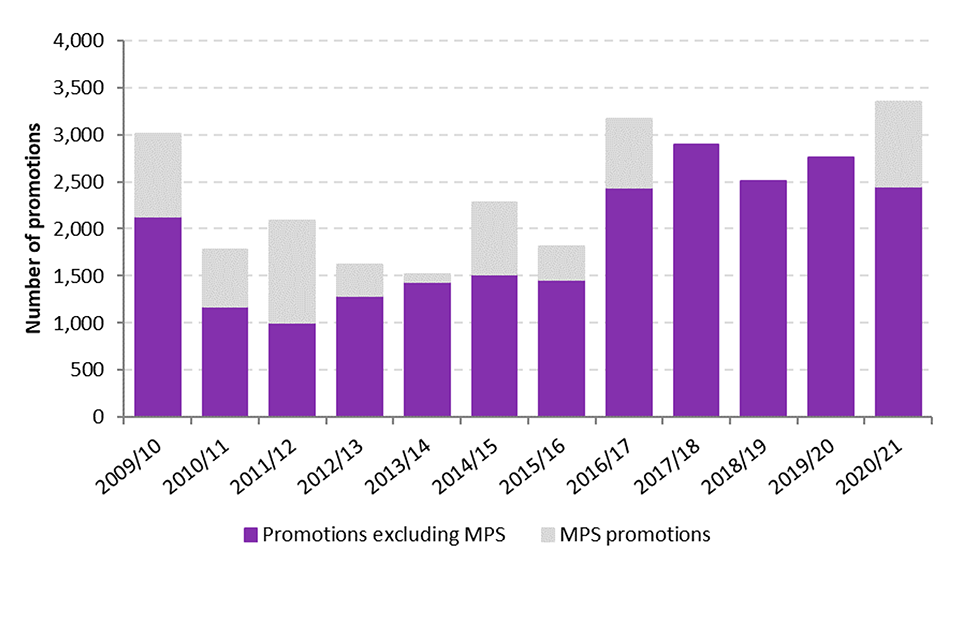
In the year ending 31 March 2021, 3,343 police officers received a promotion in the 43 police forces in England and Wales. This number of promotions accounted for 2.4% of all officers. Excluding the Metropolitan Police Service, who were unable to provide data on promotions last year, there was a decrease of 11.0% in police officer promotions recorded compared with the year ending 31 March 2020.
As in previous years, most promotions were seen at lower ranks, such as constables promoted to sergeants (accounting for 55% of all promotions). As expected, fewer promotions were seen in higher ranks, such as chief superintendents promoted to chief officers (0.6%). This reflects the hierarchical structure of the police workforce with fewer opportunities for promotion at the top of the pyramid.
Figure 4.1: Police officer promotions (headcount), years ending 31 March 2010 to 2021, England and Wales1,2
Source: Home Office, Table P1
Notes:
- Officers on temporary promotion and those promoted on transfer from another police force are not included in these statistics.
- The years ending 31 March 2018, 2019 and 2020 exclude the Metropolitan Police Service, who were unable to provide data. However, MPS promotions data is therefore shown in grey where available.
Further information on the ethnicity and gender of police officer promotions can be found in chapter 6.
4.2 Joiners
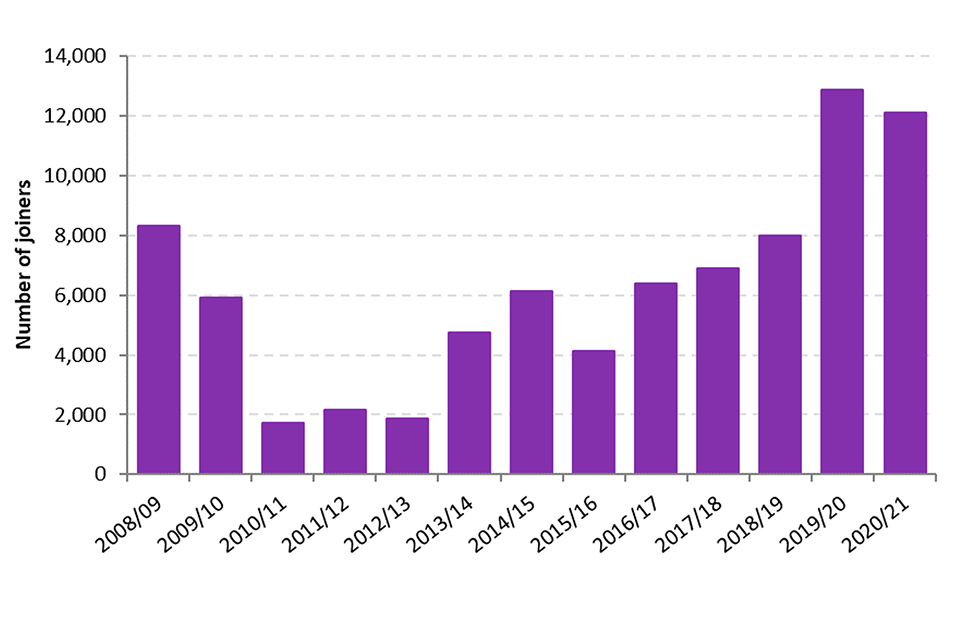
In the year ending 31 March 2021, 12,127 full-time equivalent (FTE) police officers joined the 43 police forces in England and Wales (excluding transfers). This volume of joiners was 756 below levels seen the previous year (a 5.9% decrease). However it was the second highest number since data collection began in the year ending 31 March 2003.
Most of this increase in joining officers can be attributed to the government pledge to recruit an additional 20,000 police officers in England and Wales by 31 March 2023. Further details on new recruits since the announcement of the recruitment drive can be found in the quarterly ‘police officer uplift statistics’.
Figure 4.2: Police officer joiners1, years ending 31 March 2010 to 2021, England and Wales
Source: Home Office, Joiners Open Data Table
Notes:
- Excludes those transferring in from other police forces.
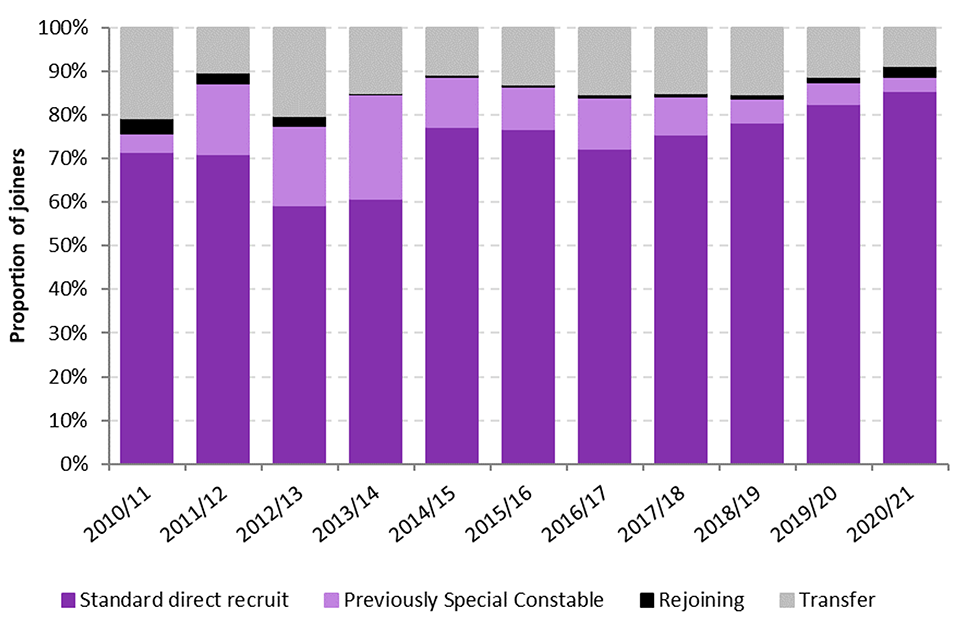
Between the years ending 31 March 2010 and 2019, the majority (fluctuating between 60-80% each year) of officer joiners (including transfers) had been new recruits joining for the first time (Figure 4.3). In the year ending 31 March 2021, 85% of officer joiners (including transfers) were standard direct recruits, the highest percentage since data collection began, and reflecting the campaign to recruit 20,000 additional officers by March 2023.
Figure 4.3: Police officer joiners (FTE), by route of entry, year sending 31 March 2010 to 2021, England and Wales
Source: Home Office, Joiners Open Data Table
4.3 Other worker types
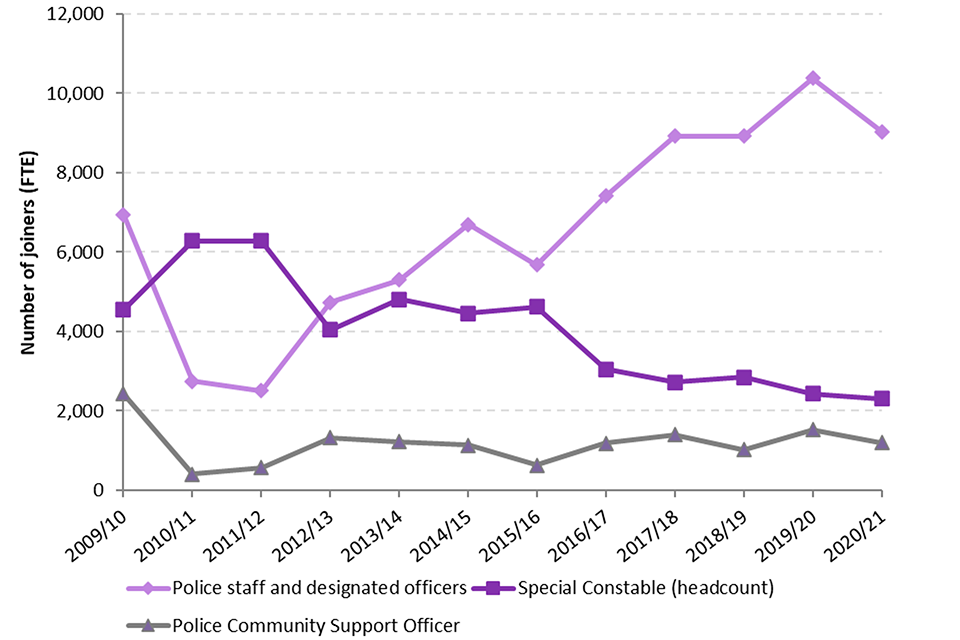
The number of PCSO joiners fell sharply between the years ending 31 March 2009 and 2011 and has remained at relatively low levels since (Figure 4.4). Excluding transfers, the number of Police staff and designated officer joiners fell by 13% in the year ending 31 March 2021 when compared with the previous year, though remained relatively high compared with previous years. This followed an upward trend seen after two particularly low years of recruitment in the years ending 31 March 2011 and 2012. Those years also saw low numbers of police officers and PCSO joiners and reflected generally low recruitment levels at that time. However, the number of new special constable joiners was relatively high during the same period. However, the number of new special constable joiners has steadily declined in recent years.
Figure 4.4: Other police worker joiners1, years ending 31 March 2009 to 2021, England and Wales
Source: Home Office, Joiners Open Data Table
Notes:
- Excludes those transferring in from other police forces.
4.4 Leavers
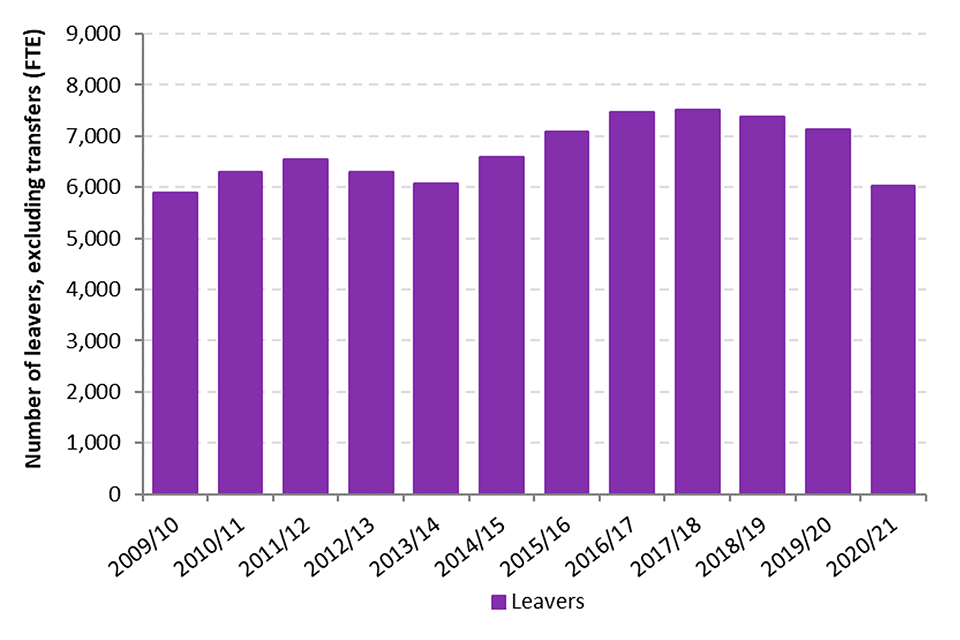
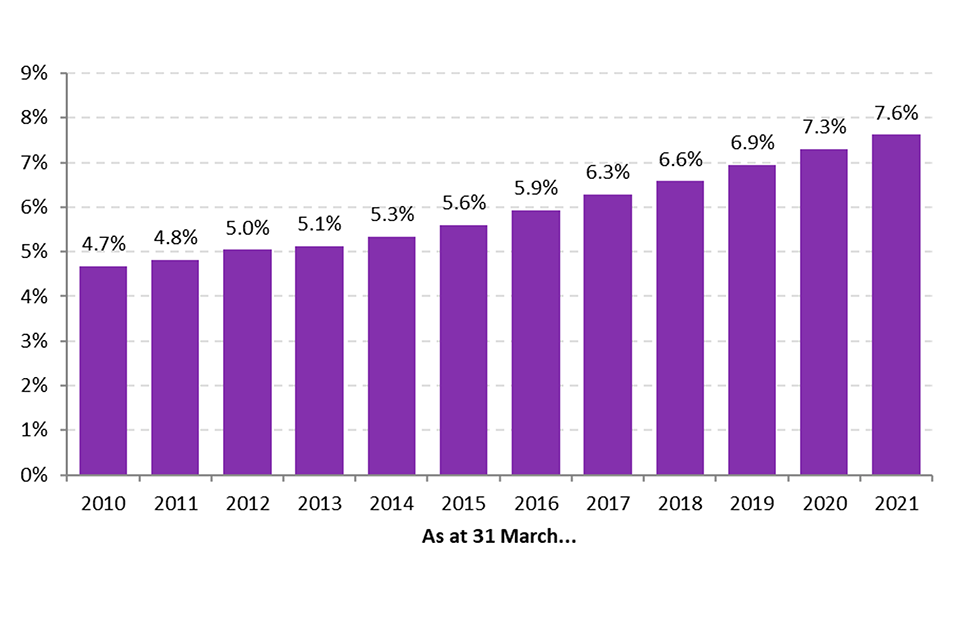
In the year ending 31 March 2021, 6,018 full-time equivalent (FTE) police officers left the 43 territorial police forces (excluding transfers) (Figure 4.5), accounting for 4.7% of officers employed by the forces at the start of the year (Figure 4.6).
Compared with the previous year there was a fall of 15.7% in the number of officers leaving the service (down 1,123 FTE officers from 7,141). This was the lowest number of police officer leavers since the year ending 31 March 2010 was recorded. This was the third year running that the numbers of officers joining the service exceeded the number of officers leaving.
Figure 4.5: Police officer leavers (excluding transfers), years ending 31 March 2010 to 2021, England and Wales
Source: Home Office, Leavers Open Data Table
Figure 4.6: Police officer wastage rate (excluding transfers)1, years ending 31 March 2010 to 2021, England and Wales
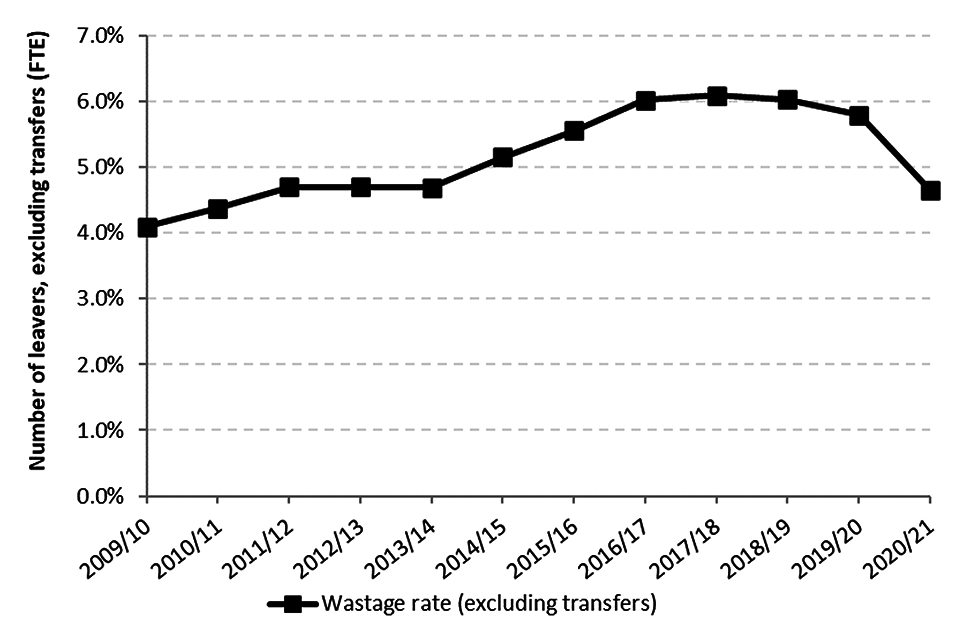
Source: Home Office, Leavers Open Data Table
Notes:
- Wastage rates are calculated by dividing the total number of leavers (excluding transfers) during the financial year by the total number of workers as at 31 March of the previous year.
The number of officers leaving the police, in each of the last five years, is shown in Table 4.1 by reason for departure.
Table 4.1: Police officer leavers, by route of exit, years ending 31 March 2017 to 2021, England and Wales
| Year ending 31 March: | 2017 | 2018 | 2019 | 2020 | 2021 |
|---|---|---|---|---|---|
| Normal retirement | 4,507 | 4,747 | 4,492 | 4,169 | 3,429 |
| Voluntary resignation | 2,035 | 1,995 | 2,175 | 2,363 | 1,996 |
| Transfer | 1,093 | 1,068 | 1,339 | 1,405 | 1,024 |
| Medical retirement | 587 | 500 | 514 | 377 | 357 |
| Dismissal | 289 | 211 | 161 | 163 | 169 |
| Death | 57 | 51 | 46 | 69 | 67 |
The majority of those leaving the service do so via normal retirement, which has typically accounted for around 50% to 60% of leavers annually (Figure 4.7).
Figure 4.7: Police officer leavers, by route of exit, years ending 31 March 2010 to 2021, England and Wales
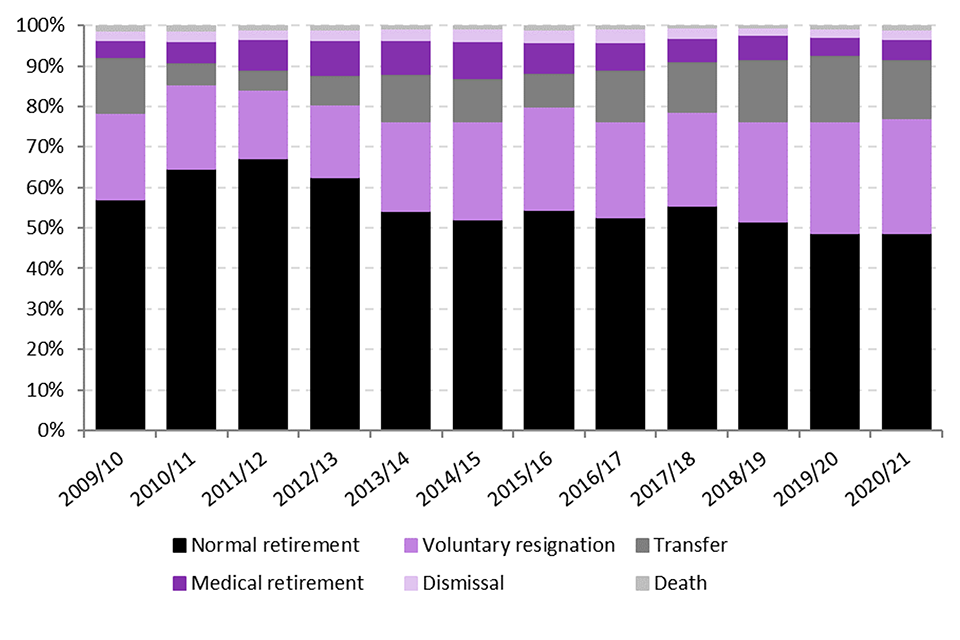
Source: Home Office, Leavers Open Data Table
Further Information on the ethnicity and gender of police joiners and leavers can be found in chapter 6.
4.5 Other worker types
The number of full-time equivalent police staff (including designated officers), and PCSOs leaving the service across the 43 police forces in England and Wales has decreased in the latest year (Figure 4.8). Similarly, the number (headcount) of special constables leaving the service has also decreased in the latest year.
The number of police staff and designated officers leavers saw the largest decline, falling by 1,684 FTEs since the year ending 31 March 2020.
Figure 4.8: Other police worker leavers1, years ending 31 March 2010 to 2021, England and Wales
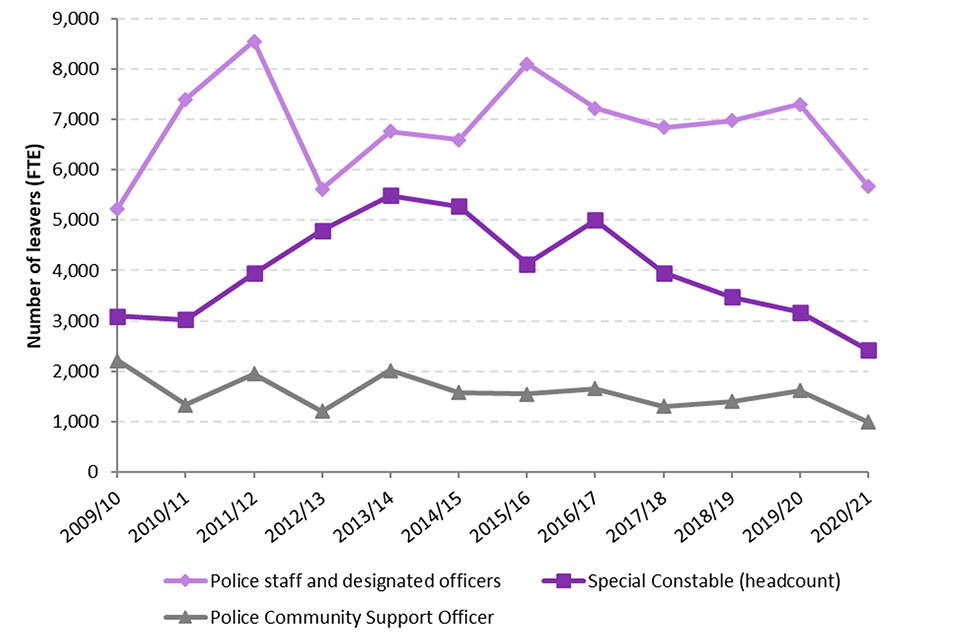
Source: Home Office, Leavers Open Data Table
Notes:
- Excludes those transferring out to other police forces.
In the year ending 31 March 2021, of the paid police worker types (i.e. excluding special constables), PCSOs had the highest wastage rate (excluding transfers), at 10.6% (Figure 4.9). This declined when compared with the previous year where a wastage rate of 16.9% was recorded.
Excluding transfers police staff and designated officers combined had a wastage rate of 7.8%, a 2.7 percentage point decrease on the previous year. The wastage rate for special constables was particularly high, at 25.2%. However, this will partly reflect the fact that some leave the special constabulary to take paid roles within the force.
Wastage rates for police staff, PCSOs and special constables were all at their lowest rates since the year ending 31 March 2013.
Figure 4.9: Wastage rates by police worker type (excluding transfers)1, year ending 31 March 2021, England and Wales
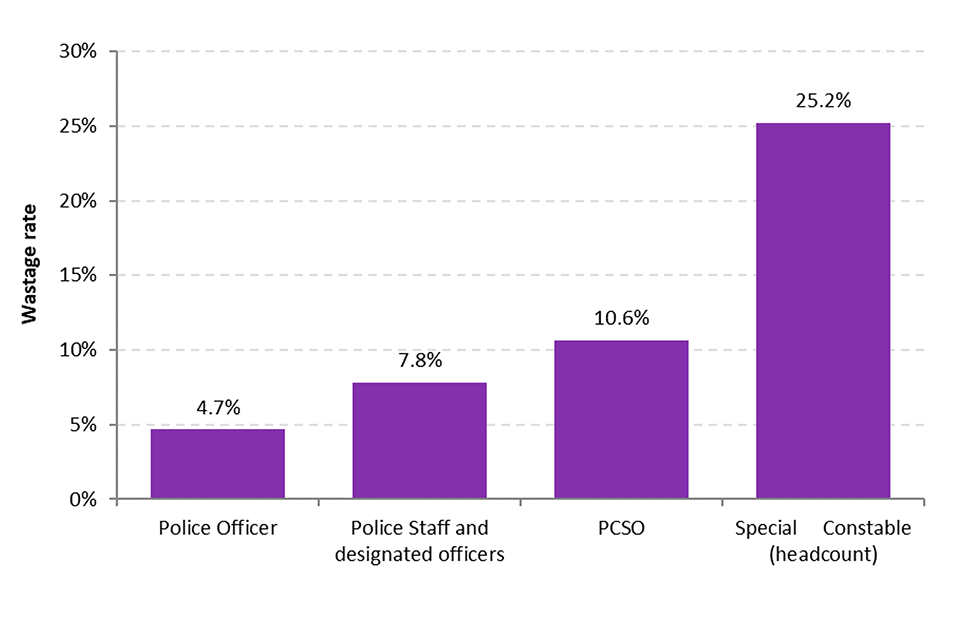
Source: Home Office, Leavers Open Data Table
Notes:
- Wastage rates are calculated by dividing the total number of leavers (excluding transfers) during the financial year by the total number of workers as at 31 March of the previous year.
4.6 Length of service
Statistics on length of service are designated as ‘Official Statistics’ rather than ‘National Statistics’ due to a number of data quality issues. Some forces have reported problems extracting length of service data from their HR systems. Where officers have transferred from another force, or changed roles within a force, some constabularies record the length of service based on the date the officer started their current role (rather than the date the officer joined the police service). This is likely to skew the data towards shorter service periods and under-record longer periods of service when individuals have moved posts or forces.
While these issues will have less impact on the national picture, they are likely to have more of an effect on further breakdowns of the data, such as by force or rank of officer. While the findings in this section should be considered with caution, they give a reasonable indication of the picture at the national level, but users should be wary of making force comparisons.
This section includes information on the length of service of police officers in England and Wales. The data cover the length of time in the police service as a whole, excluding time spent on unpaid long-term absence and career breaks. Data in the section refer to the situation as at 31 March 2021 and are on a headcount basis.
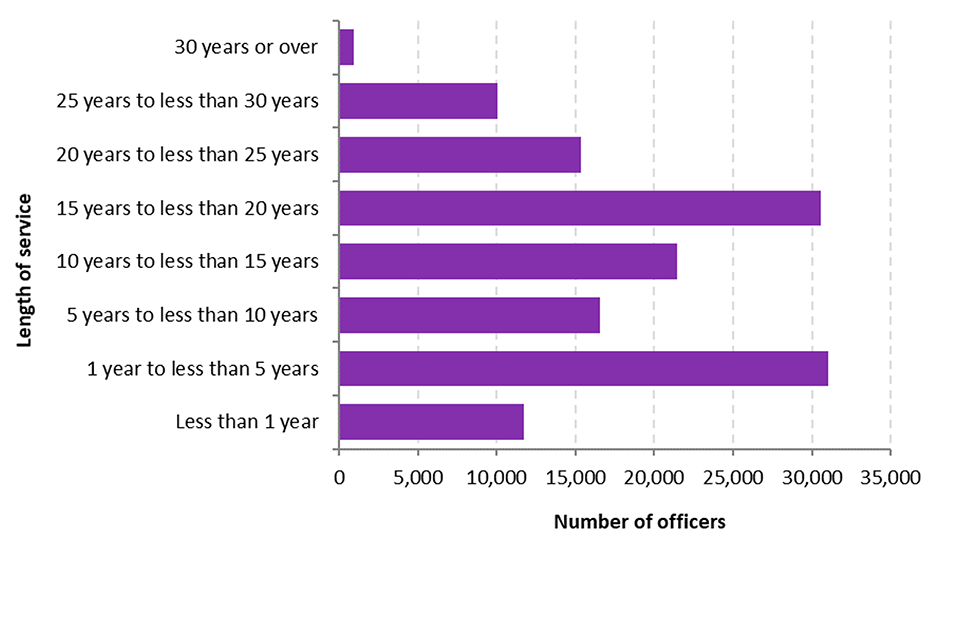
In the 43 forces in England and Wales, the number of officers with fewer than 5 years of service was 42,719 (headcount), which accounted for 31% of all police officers (where the length of service is known). Of these, 27% (11,694 officers) had less than 1 year of service.
Patterns in the length of service data tend to reflect recruitment trends over time. Relatively low levels of recruitment between the years ending 31 March 2011 and 31 March 2013 meant that the number of officers with between 5 years and less than 10 years of service, as at 31 March 2021, were relatively low (12%). Over the last few years, as recruitment levels have increased, number and proportion of officers with fewer than 5 years of service has also risen.
Of all police officers, 16% had been in the service between 10 but less than 15 years, and just over a fifth (22%) had been in the service between 15 and less than 20 years. This spike was likely to be partly a result of a recruitment drive in the early and mid 2000s. In total 908 (or 0.7%) officers had served for more than 30 years. This reflects the fact that most current police officers are entitled to receive a full pension after 30 years of service, leading to many officers retiring at that point.
Figure 4.10: Length of service of police officers1, as at 31 March 2021, England and Wales
Source: Home Office, Table JL5
Notes:
- Where length of service information is not known, length of service in current police force has been used instead.
5 Frontline and local policing
Key results
-
the number of frontline police officers in England and Wales increased by 4% in the 12 months to 31 March 2021 to reach 113,645 but the proportion of officers employed in frontline roles remained stable (92%)
-
police officers employed in local roles increased by 5% in number to 62,353 in the last 12 months
-
the proportion of officers employed in local policing roles was similar to the previous one (at 50%)
5.1 Introduction
This chapter provides statistics on the number of police officers employed in frontline policing roles, according to the model set out by HM Inspectorate of Constabulary and Fire & Rescue Services (HMICFRS). Further details on the model can be found in Annex 4 of HMICFRS’s Value for Money Profiles and the user guide which accompanies this release. This chapter also presents statistics on police officers employed in local policing functions. Statistics presented here are based on which function a police officer spent the majority of their time doing.
5.2 Changes to the police functions framework
Since 2012, the Home Office has published statistics on police officer, police staff and Police and Community Service Officers (PCSO) functions, based upon a set of 60 function categories that had remained unchanged for several years. Following an extensive consultation with police forces, HMICFRS and other key stakeholders, the Home Office replaced this old functions-framework with a framework based on the Police Objective Analysis (POA) categories. These are reviewed annually by the Home Office, HMICFRS and police forces, to ensure that they remain relevant and reflect current policing structures. The change was agreed in order to modernise the data collection, and to align it with the framework used by HMICFRS to collect data on police income, expenditure and funded posts. This change came into effect from 31 March 2015 onwards.
5.3 Comparisons over time
The change of framework means that the police functions data based on the POA framework for 2015 onwards are not directly comparable with data collected under the old framework. Although some functions may appear to be similar between the two, there are often differences in definitions, and so any attempts to compare across the two frameworks should be done with caution. Very few functions are comparable across both frameworks.
In addition to this, the POA categories are reviewed annually, therefore some categories may be added, removed, or amended from one year to the next.
Further details on the police functions framework, along with a full list of the functions included in the old and new frameworks, can be found in the user guide
5.4 Frontline policing
As stated in section 5.2, the change in police functions framework has resulted in a loss of comparability over time. This is particularly true for the measure of frontline policing, as both the framework and the frontline model that is based on this have changed. This causes difficulties when attempting to make comparisons of frontline policing with previous years.
Further details on the model based on the new POA functions framework can be found in Annex 4 of HMICFRS’s Value for Money Profiles. One of the most significant changes was that National Policing functions, including Counter Terrorism/Special Branch roles, were excluded from the model entirely. Many of these were previously classed as frontline roles.
To provide a back series on frontline policing, the Home Office collected data from the police under both the old and the new frameworks in March 2015. This means data can be adjusted for previous years to create a longer time series. Estimates have been made at a Police Force Area level, which in turn has allowed the national England and Wales figure to be estimated. Further information on the method used to estimate the back series can be found in the user guide.
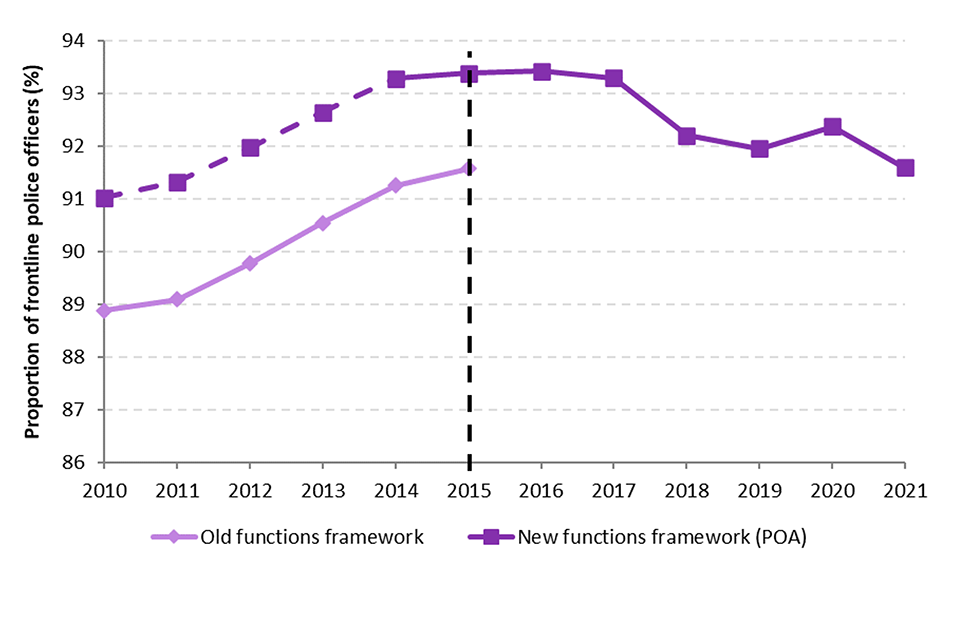
Figure 5.1 shows the difference between the old frontline measure and the estimated back series of the new measure for the proportion of frontline police officers. At the national level, the proportion of police officers in frontline policing roles was 1.8 percentage points higher as at 31 March 2015 under the new POA framework compared with the old framework.
Figure 5.1: Proportion of frontline police officers, England and Wales, as at 31 March 2010 to 31 March 20211
Source: Home Office, Table F5
Notes:
- Figures for March 2015 onwards have been calculated using HM Inspectorate of Constabulary and Fire & Rescue Services’ (HMICFRS’s) frontline policing model. Further details on the frontline policing model based on the old functions framework can be found in HMICFRS’s Policing in Austerity: Meeting the Challenge report. Further details on the model based on the new POA functions framework can be found in Annex 4 of HMICFRS’s Value for Money Profiles. Both models exclude police officers recorded under the ‘other’ function category. The ‘other’ function category includes police officers on maternity/paternity leave, career break, full-time education or on suspension; and those on long-term leave (sickness, compassionate special or unpaid).
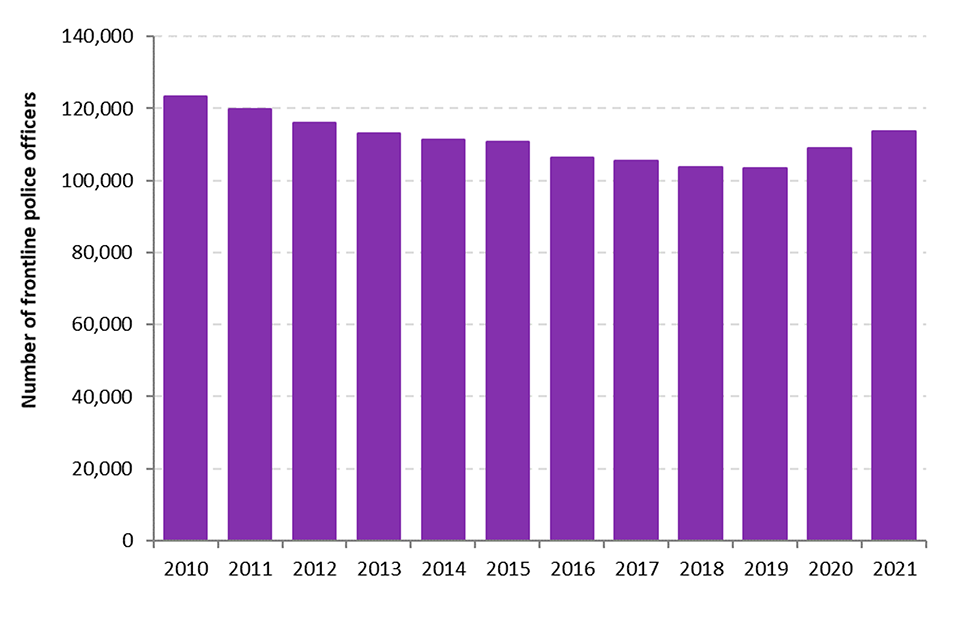
Figure 5.2 shows the trend in the number and proportion of police officers employed in frontline policing roles as at 31 March, in each year from 2010 to 2021. Figures from 31 March 2010 to 31 March 2014 have been estimated as described above. The underlying figures are presented in the main data tables, along with the number and proportion of police officers employed in frontline support and business support roles as at 31 March in each year from 2010 to 2021.
As at 31 March 2021, there were 113,645 police officers employed in frontline policing roles, an increase of 4,789 officers (or 4%) compared with the previous year. The proportion of officers employed in frontline roles remained stable (92%).
Figure 5.2: Number of full-time equivalent frontline1 police officers, England and Wales, as at 31 March 2010 to 31 March 20212
Source: Home Office, Table F5
Notes:
- Visible operational frontline and non-visible frontline have been added together to give an overall frontline total.
- Figures for March 2015 onwards have been calculated using HM Inspectorate of Constabulary and Fire & Rescue Services’ (HMICFRS’s) frontline policing model. Figures for March 2010 to March 2014 have been estimated based on data for a parallel running year (March 2015) where data was collected using both functions frameworks. Further details on these estimates can be found in the user guide.
Table 5.1: Number of full-time equivalent police officers employed in frontline1, frontline support2 and business support roles, England and Wales, as at 31 March 2011 to 31 March 20213
| As at: | Frontline | Frontline support | Business support |
|---|---|---|---|
| 31-Mar-11 | 119,729 | 6,469 | 4,912 |
| 31-Mar-12 | 116,122 | 5,971 | 4,161 |
| 31-Mar-13 | 113,009 | 5,215 | 3,762 |
| 31-Mar-14 | 111,383 | 4,706 | 3,309 |
| 31-Mar-15 | 110,853 | 4,324 | 3,528 |
| 31-Mar-16 | 106,411 | 4,087 | 3,401 |
| 31-Mar-17 | 105,502 | 4,114 | 3,471 |
| 31-Mar-18 | 103,837 | 4,348 | 4,428 |
| 31-Mar-19 | 103,347 | 4,176 | 4,645 |
| 31-Mar-20 | 108,856 | 4,140 | 4,846 |
| 31-Mar-21 | 113,645 | 4,677 | 5,749 |
Source: Home Office, Table F6
Notes:
- Visible operational frontline and non-visible frontline have been added together to give an overall frontline total.
- Frontline support was previously named operational support under the old framework.
- Figures for March 2015 onwards have been calculated using HM Inspectorate of Constabulary and Fire & Rescue Services’ (HMICFRS’s) frontline policing model and police officer functions data in the main data tables. Figures for March 2010 and March 2014 have been estimated based on data for a parallel running year (March 2015) where data was collected using both functions frameworks. Further details on these estimates can be found in the user guide.
Table 5.2: Proportion of full-time equivalent police officers employed in frontline1, frontline support2 and business support roles, England and Wales, as at 31 March 2010 to 31 March 20213
| As at: | Frontline | Frontline support | Business support |
|---|---|---|---|
| 31-Mar-11 | 91.3 | 4.9 | 3.7 |
| 31-Mar-12 | 92.0 | 4.7 | 3.3 |
| 31-Mar-13 | 92.6 | 4.3 | 3.1 |
| 31-Mar-14 | 93.3 | 3.9 | 2.8 |
| 31-Mar-15 | 93.4 | 3.6 | 3.0 |
| 31-Mar-16 | 93.4 | 3.6 | 3.0 |
| 31-Mar-17 | 93.3 | 3.6 | 3.1 |
| 31-Mar-18 | 92.2 | 3.9 | 3.9 |
| 31-Mar-19 | 92.1 | 3.7 | 4.1 |
| 31-Mar-20 | 92.4 | 3.5 | 4.1 |
| 31-Mar-21 | 91.6 | 3.8 | 4.6 |
Source: Home Office, Table F6
Notes:
- Visible operational frontline and non-visible frontline have been added together to give an overall frontline total.
- Frontline support was previously named operational support under the old framework.
- Figures for March 2015 onwards have been calculated using HM Inspectorate of Constabulary and Fire & Rescue Services’ (HMICFRS’s) frontline policing model. Figures for March 2010 and March 2014 have been estimated based on data for a parallel running year (March 2015) where data was collected using both functions frameworks. Further details on these estimates can be found in the user guide.
5.5 Local policing
Under the POA functions framework outlined in section 5.2, each individual police function is categorised into a broader group, one of which is ‘local policing’. This is defined as police officers/staff whose primary role involves at least one of the following:
- neighbourhood policing
- incident (response) management
- specialist community liaison; and
- working within the local policing command team
Full details on the definitions of each function can be found in Table_F4 of the accompanying data tables.
There were 62,353 police officers employed within local policing functions as at 31 March 2021, an increase of 3,176 officers (5.4%) compared with a year earlier. This was the third consecutive twelve-month period of increases in local police numbers following a downward trend in previous years. However, those working within local policing roles accounted for 50.3% of all officers as at 31 March 2021 (excluding ‘Other’ and ‘National Policing’ functions), about the same proportion as twelve months prior. This recent increase in local police numbers therefore reflects an increase in all police officers in the year to 31 March 2021 across England and Wales.
Table 5.3: Number and proportion of full-time equivalent police officers in local policing roles, England and Wales, as at 31 March 2016 to 31 March 20211
| 31-Mar-16 | 31-Mar-17 | 31-Mar-18 | 31-Mar-19 | 31-Mar-20 | 31-Mar-21 | |
|---|---|---|---|---|---|---|
| Number | 57,415 | 56,430 | 53,822 | 54,158 | 59,176 | 62,353 |
| Proportion (%) | 50.4 | 49.9 | 47.8 | 48.3 | 50.2 | 50.3 |
Source: Home Office, Table F1
Notes:
- The proportions have been calculated excluding police officers recorded under the ‘Other’ function category and ‘National Policing’ functions. The ‘Other’ category includes police officers on maternity/paternity leave, career break, full-time education or on suspension; and those on long-term leave (sickness, compassionate special or unpaid).
5.6 Police functions by ethnicity
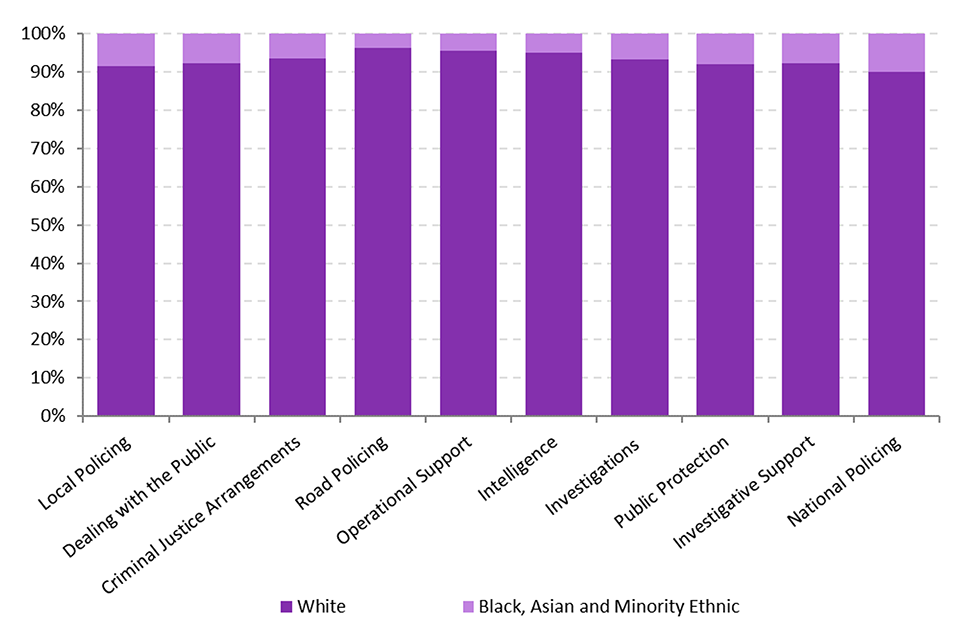
Each individual police function is categorised into a broader group, such as local policing, road policing and national policing, for example, according to the POA framework outlined in section 5.2.
Within these groups, data is collected on the ethnicity of the officer, as represented by one of three groups: ‘White’, ‘Black, Asian and minority ethnic’, and ‘Not stated’. Proportions in this section are calculated by excluding the third group representing cases where the ethnicity of the officer was not known. More detailed ethnicity is available according to other segmentation such as police force and rank in chapter 6.
As at 31 March 2021, those identifying as White accounted for 92.4% of all officers and those identifying as Black, Mixed, Asian, or another minority ethnic group accounted for 7.6%. Twelve months earlier these figures were 92.7% and 7.3% respectively.
Figure 5.3 shows the ethnic split across each policing function.
Figure 5.3: Proportion of police officers, by ethnic group and function, as at 31 March 2021, England and Wales1
Source: Home Office, Table F7
Notes:
- Proportions exclude cases where the ethnicity of the officer is ‘not stated’.
6 Diversity
Key results
- at 31 March 2021, White officers made up 92.4% of the workforce
- there were 10,046 officers from Black, Asian and ethnic minority groups (Black, Asian, Mixed and Other ethnic groups), making up 7.6% of the workforce, compared with 7.3% last year
- black officers made up 1.3% of the total workforce, Asian officers 3.4%, and those identifying as a Mixed ethnic group or another ethnic group 2.9%
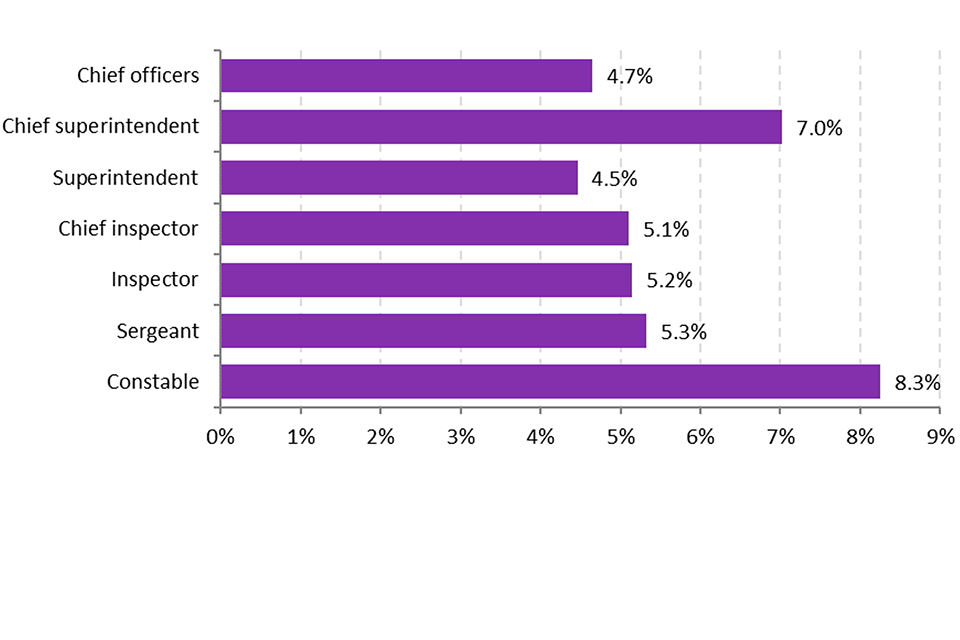
- under-representation of Black, Asian and ethnic minority officers was highest among Senior ranks (i.e. chief inspector or above) compared with constables and other ranks - for example, 5.1% of officers of rank chief inspector or above identified as belonging to a Black, Asian or ethnic minority, compared with 8.3% of constables
- there were 43,762 female police officers in the 43 police forces on 31 March 2021, making up 32.4% of police officers in England and Wales (up one percentage point from 31.2% last year)
6.1 Introduction and changes to data collection on diversity
This chapter presents statistics on the diversity of the police workforce, focusing specifically on the ethnicity, gender (and sex where gender data are unavailable), and age of the workforce. It also presents information on the ethnicity and gender of promoted officers, joiners and leavers.
As part of the initiative to improve data on the police workforce and to align the monthly data collected for the police uplift programme with these statistics, a number of changes have been made to the data collection template, particularly around the collection of data on protected characteristics.
The Home Office, the NPCC and the College of Policing have been collaborating in developing a National Standard for Workforce Data. These Data Standards draw on existing harmonised standards set out by the Government Statistical Service and aim to bring more standardisation within policing for the collection of data on protected characteristics (and some other demographic information). The variables currently covered by the Standards are: Ethnicity, Age, Religion or Belief, Disability, Sexual orientation, Gender, Sex, and Gender Reassignment.
Information on their protected characteristics is self-reported by officers on police force HR systems. Recent changes to police force HR systems to align with the new Data Standards have allowed all staff the opportunity to review existing records and declare further information on protected characteristics. However, many officers are yet to update their profiles and, as such, data are not currently complete.
Since data on gender and ethnicity have been collected for longer, the data are more complete and reliable, so this chapter focusses on these protected characteristics only. However, since the quarter ending June 2021, experimental statistics are included in an annex to the ‘police officer uplift statistics’ (which are published quarterly) to provide information on the proportion of officers broken down by sexual orientation, age and disability status.
There are still some comparability issues to be aware of. Previously, data collected and presented in this bulletin referred to the sex of the officer, limited to male or female as requested from police forces by HMRC. The implementation of the Data Standards expanded the categories under sex, as well as requested additional information on gender. For some forces, this change has led to a large proportion of officers with an “unknown” gender or “unknown” sex. While the expectation is that this will improve in future years, a hybrid approach has been taken in this bulletin to account for cases with an “unknown” gender recorded. Where gender data was not available, analysts have instead used data recorded on sex , and vice versa.
Furthermore, data on ethnicity are now collected using the updated ONS 2011 Census classifications, meaning that Chinese officers are now counted in the wider “Asian” ethnic group, where they had previously been counted under “Chinese and Other”. While this change makes direct comparisons to previous years for the Asian and Other ethnic groups more difficult, the published ‘police officer uplift quarterly update to June 2021’ data shows that as at 30 June 2021 Chinese officers made up just 0.2% of all officers (292 out of 138,574 officers), so the impact of this change is minimal.
The Home Office and NPCC continue to work with police forces to improve the quality of data collected on protected characteristics.
6.2 Police officers: Ethnicity
As at 31 March 2021, there were 10,046 full-time equivalent (FTEs) officers who identified as belonging to the Black, Asian, or another minority ethnic group in the 43 forces in England and Wales, an increase of 872 (9.5%) compared with a year earlier. Officers belonging to a minority ethnic group represented 7.6% of all officers who stated their ethnicity, a small increase from 7.3% in the previous year. There has been a gradual upward trend in the proportion of officers who identify as Black, Asian or another minority ethnic group since 2010 (Figure 6.1), which is a result of leavers from the police service predominantly identifying as White, and also new recruits being from a more diverse background than their predecessors. However, the proportion of officers belonging to Black, Asian or minority ethnic groups remains considerably lower than the 14% of the population in England and Wales who identified as such as the 2011 Census [footnote 2].
Figure 6.1: Proportion of police officers who identified as Black, Asian or another minority ethnic group, as at 31 March 2010 to 31 March 2021, England and Wales1
Source: Home Office, Ethnicity Open Data Table
Notes:
- Excludes those who did not state their ethnicity.
Of the 43 forces, the Metropolitan Police Service (MPS) had the most ethnically diverse distribution of officers, with 15.9% identifying as belonging to a Black, Asian or other minority ethnic group. However, this was still well below the proportion of people resident in the Capital who identified as belonging to these groups (40%) according to the 2011 Census.
The second highest proportion of Black, Asian and Minority ethnic officers was in the West Midlands Police, where 12.4% of officers who stated their ethnicity identified themselves as such (compared with 30% of the local population). This force was closely followed by Bedfordshire Police (where 10.1% of police officers identified as Black, Asian or minority ethnic compared with 23% of the local population). Police forces covering more rural areas (such as Cumbria, Durham, and North Wales Police) had a less ethnically diverse workforce (around 9% of officers identify as White in these forces) and reflecting their resident population within those areas.
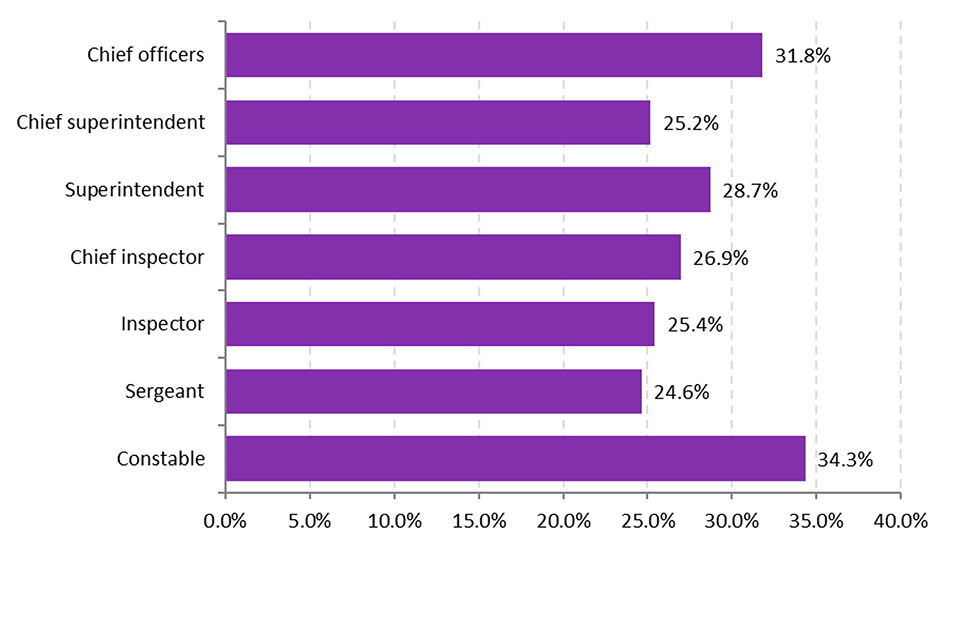
As in previous years, levels of under-representation were highest among Senior ranks (i.e. chief inspector or above) compared with constables and other ranks. For example, 5.1% of officers of rank chief inspector or above identified as belonging to a Black, Asian or other minority ethnic group, compared with 8.3% of constables (Figure 6.2). This is likely to partly reflect a more ethnically diverse cohort of joiners in recent years, many of whom will have joined at constable level.
Figure 6.2: Proportion of police officers who identify as Black, Asian or another minority ethnic group, by rank, as at 31 March 2021, England and Wales1
Source: Home Office, Ethnicity Open Data Table
Notes:
- Excludes those who did not state their ethnicity.
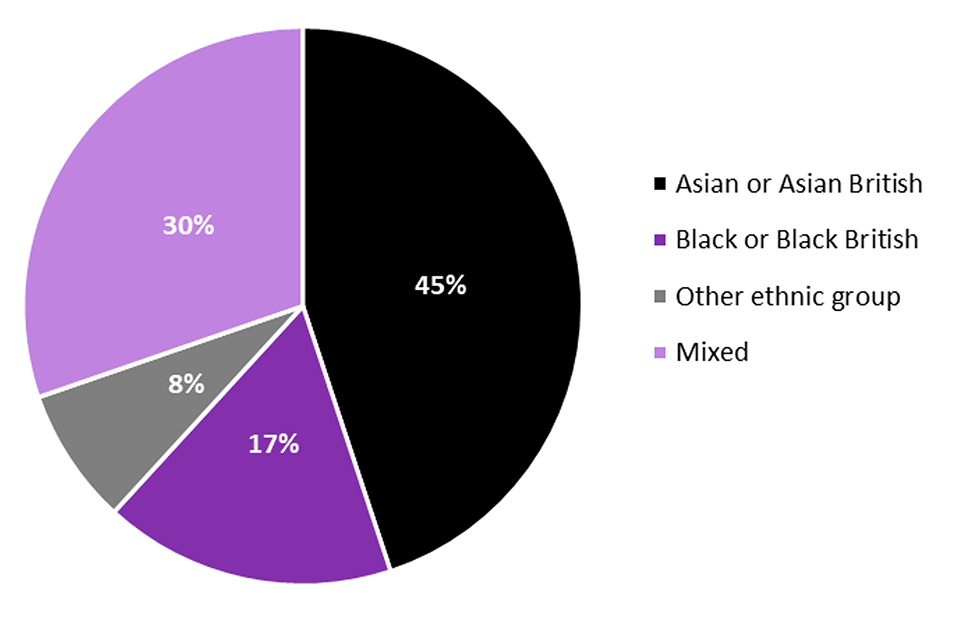
Of the 10,046 officers identifying as Black, Asian or another minority ethnic group, 4,512 (3.4%) classified themselves as Asian or Asian British, 3,043 (2.3%) as Mixed, 1,695 (1.3%) as Black or Black British, and 795 (0.6%) as the “Other” ethnic group. While direct comparisons for the Asian and Other ethnic group cannot be made (due to a change in the ONS ethnicity framework where those identifying as Chinese were previously included within “Other” and now included in the wider “Asian” group), these proportions have remained relatively stable over recent years.
Figure 6.3: Composition of Black, Asian and minority ethnic officers, by ethnic group, as at 31 March 2021, England and Wales
Source: Home Office, Table D2
6.3 Police officer promotions
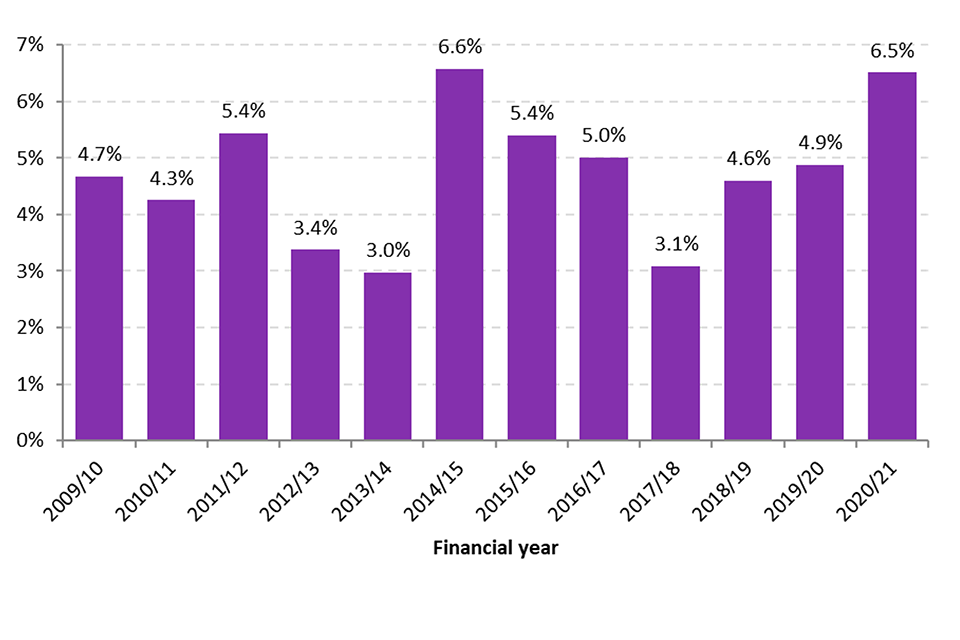
Following the implementation of a new HR system in 2018, the Metropolitan Police Service (MPS) were unable to provide data on promotions for the years ending 2018, 2019 and 2020. However, this year data was available for all forces.
Of the 3,343 police officers promoted the year ending March 2021, 3,270 (98%) indicated their ethnicity. Of these, 213, or 6.5%, identified themselves as belonging to a Black, Asian or other minority ethnic group. Excluding the MPS, to make a like for like comparison with the previous year, 108 officers from a Black, Asian, or other minority ethnic background were promoted, accounting for 4.5% of all promoted officers, compared with 4.9% in the previous year.
Figure 6.4: Proportion of promotions where the officer promoted identified as Black, Asian, or another minority ethnic group, years ending 31 March 2010 to 2021, England and Wales (excluding MPS)1,2
Source: Home Office, Promotions Open Data Table
Notes:
- Data are on a headcount basis and exclude cases where the ethnicity of the officer promoted is unknown.
- Excludes the Metropolitan Police Service for the years ending 31 March 2018, 2019 and 2020 who were unable to provide data.
6.4 Police officer joiners: Ethnicity
Excluding transfers, 12,127 full-time equivalent police officers joined the 43 police forces in England and Wales in the year ending March 2021, and 11,768 (97%) stated their ethnicity. Of these, 1,250, or 10.6% identified themselves as belonging to a Black, Asian or other minority ethnic group, this is a similar proportion (10.3%) to the previous year.
The police forces with the largest proportion of joiners (excluding transfers) from a Black, Asian or minority ethnic group were the Metropolitan Police Service and Nottinghamshire Police (in both forces 20% of new recruits identified as belonging to such ethnic groups). West Midlands Police and Greater Manchester Police (where 17% of new joiners in both forces were from a Black, Asian or ethnic minority group), also had more ethnically diverse cohort of joiners than other forces.
6.5 Police officer leavers: Ethnicity
In the year ending March 2021, and excluding transfers, 4,991 of the 5,086 (98%) officers who left the 43 police forces in England and Wales stated their ethnicity. Of these, 409, or 8.2%, identified as Black, Asian, or other ethnic minority.
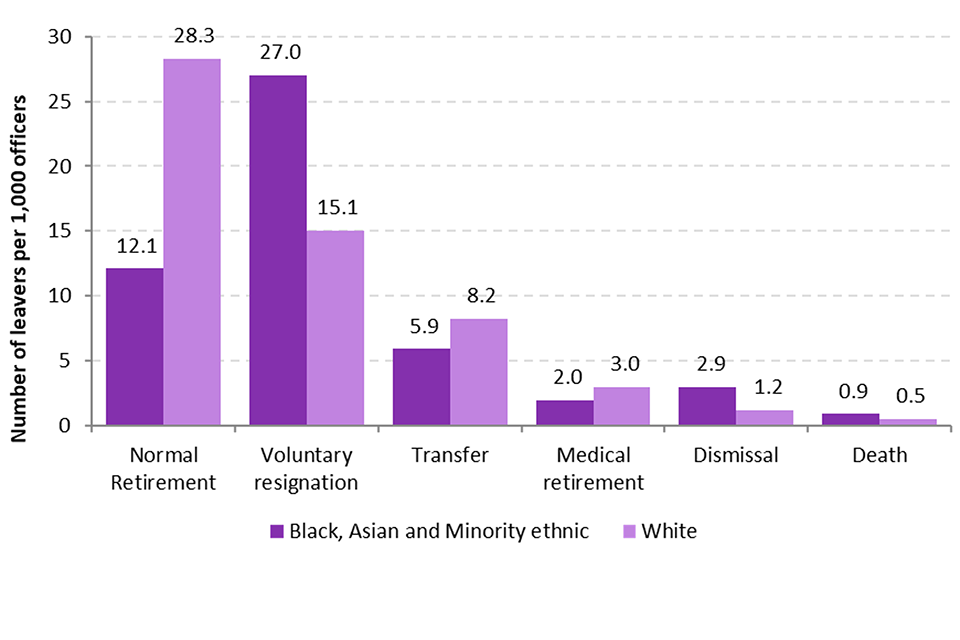
There was a higher rate of normal retirements amongst White officers, which was likely to reflect the differing age profiles of different ethnic groups within the police. For example, due to historically low levels of ethnically diverse recruitment, older officers were more likely to be White, meaning fewer officers from minority ethnic groups are likely to have yet reached retirement age. Rates of voluntary resignations and dismissals (which also included cases where a contract was terminated for reasons other than misconduct) were higher amongst officers belonging to Black, Asian and minority ethnic groups (Figure 6.5).
Figure 6.5: Number of officers leaving by each exit route per thousand officers, by ethnicity, year ending 31 March 2021 England and Wales1,2,3
Source: Home Office, Leavers Open Data Table
Notes:
- Excludes cases where the ethnicity of the leaving officer is unknown.
- Excludes transfers to other forces.
- Leaving rates are calculated as number of officers leaving via that route in the latest year, as a proportion of officers employed by the forces as at 31 March 2020 per thousand officers.
6.6 Police staff, PCSOs, designated officers, special constables, and police support volunteers: Ethnicity
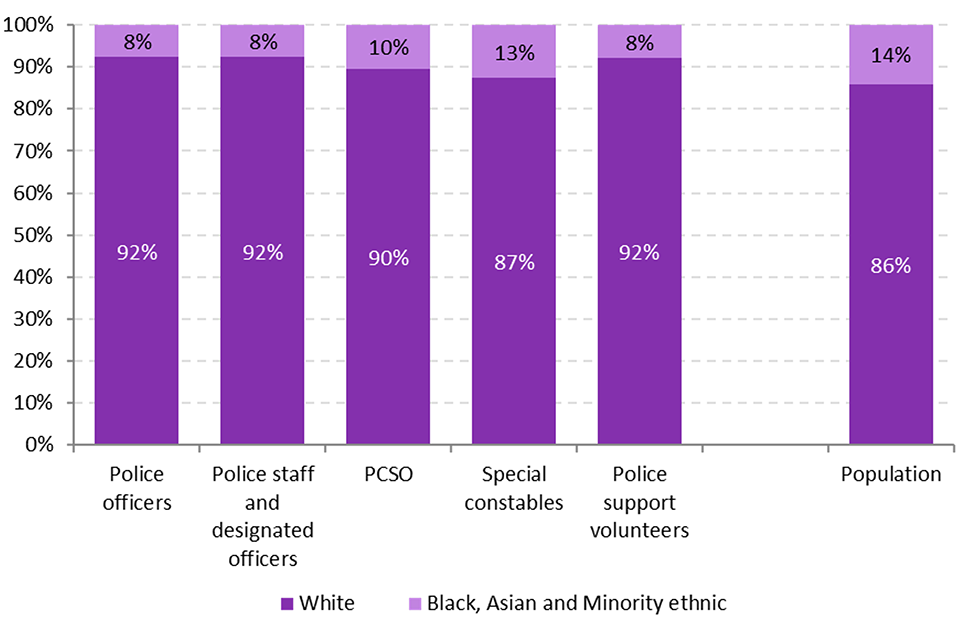
The proportion of workers in other areas of the workforce belonging to a Black, Asian or another minority ethnic group was higher than for police officers (Figure 6.6). As in recent years, the Special Constabulary was the most ethnically diverse part of the police workforce as at 31 March 2021, with 1,058 of the 8,353 special constables who stated their ethnicity identified as belonging to a Black, Asian or minority ethnic group (12.7% compared with 14% of the resident population), closely followed by Police Community Support Officers (PCSOs) (10.5%).
Figure 6.6: Ethnic breakdown of the police workforce, as at 31 March 2021, England and Wales1
Source: Home Office, Ethnicity Open Data Table
Notes:
- Excludes those who did not state their ethnicity.
6.7 Police officers: Gender and sex
As discussed at the start of this chapter, due to the implementation of the Police Workforce Data Standards and the subsequent expansion in the data requested from police forces from the year ending March 2021, there are some data quality issues to be aware of when referring to the sex or gender of officers.
Previously, data collected and presented in this bulletin referred to the sex of the officer, limited to male or female as requested from police forces by HMRC. The implementation of the Data Standards expanded the categories under sex, as well as requested additional information on gender identity (see the user guide for more details). For some forces, this change has led to a large proportion of officers with an “unknown” gender or “unknown” sex as officers have not yet got round to reviewing their HR profiles. While the expectation is that this will improve in future years, a hybrid approach has been taken in this bulletin to account for cases with an “unknown” gender identity recorded. Where gender identity data are not available, analysts have instead used data on sex, and vice versa.
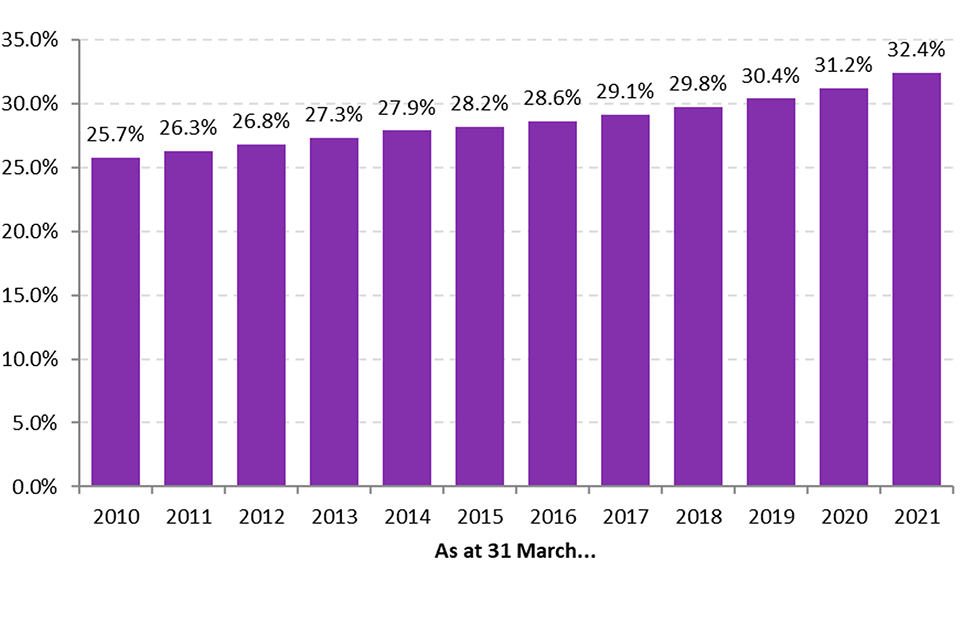
Based on this hybrid approach, there were 43,762 female police officers in the 43 police forces on 31 March 2021, making up 32.4% of police officers in England and Wales, up slightly from 31.2% last year. The number of female officers increased by 3,443 (8.5%) compared with a year earlier.
The proportion of female police officers in the 43 forces has increased in every year over the past decade (Figure 6.7) from 36,988 to 43,762 between March 2010 and March 2021.
As in previous years, of the 43 forces, Cumbria had the highest proportion of female police officers (40.4%), followed by North Wales (37.0%). The City of London Police had the smallest proportion of female officers (23.8%) followed by the MPS, and Cleveland Police (both 29%).
Figure 6.7: Proportion of female police officers, as at 31 March 2010 to 31 March 2021, England and Wales1
Source: Home Office, Workforce Open Data Table
Notes:
- Excludes cases where both the gender and sex of the officer is unknown.
Female officers were more commonly found in constable ranks, which reflected the increasing diversity of the workforce in recent years, with most new joiners coming in at constable level (Figure 6.8).
Figure 6.8: Proportion of female police officers, by rank, as at 31 March 2021, England and Wales1
Source: Home Office, Workforce Open Data Table
Notes:
- Excludes cases where both the gender and sex of the officer is unknown.
6.8 Police officer promotions: Sex and gender
Of the 3,343 police officers promoted in the 43 police forces in the year ending March 2021, 981 were female, which accounted for 29.4% of all officers. Excluding the MPS, this figure was 731 (29.9% of all promotions), proportionately down from 847 (30.7% of all promotions) in the previous year.
6.9 Police officer joiners and leavers: Sex and gender
Excluding transfers, of the 12,127 full-time equivalent police officers that joined the 43 police forces in the year to March 2021, 5,067 (41.8%) identified as female. This was an increase of 5 percentage points on the year before, when females accounted for 36.7% of all joiners. In the ten years prior to March 2021 the proportion of female joiners has varied between 30% and 38%, making the latest year the largest proportion of female joiners on record.
The proportion of female joiners was also higher than the proportion of current officers that were female (32.9%). This showed a continued rising trend in the proportion of all officers that were female.
Of the 6,018 officer leavers (excluding transfers) during the year to March 2021, 1,649 (27.4%) were female, compared with 26.7% in the previous year. Most female officers left either via normal retirements (47.4% of all female leavers, compared with 60.6% of all male leavers) or voluntary resignations (43.2% of all female leavers, compared with 29.4% of all male leavers) in the year ending March 2021.
6.10 Police staff, PCSOs, designated officers, special constables, and police support volunteers: Sex and gender
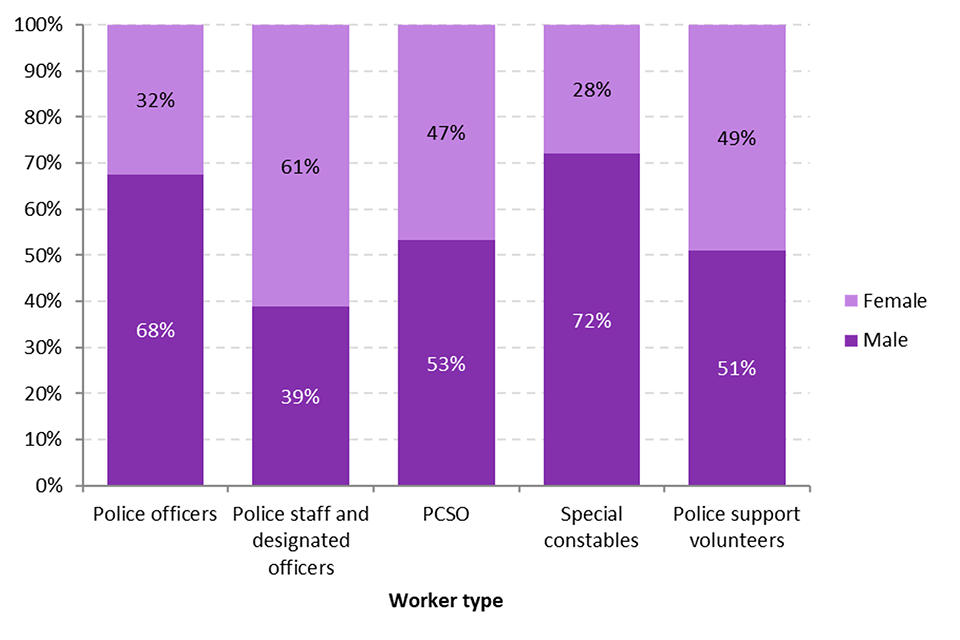
As at 31 March 2021, females made up 61.2% of police staff and designated officers in the 43 forces in England and Wales, and 46.7% of PCSOs. The proportion of females in the Special Constabulary was the lowest across all worker types, with 27.9% of specials being female.
Figure 6.9: Proportion of the police workforce who are female, as at 31 March 2021, England and Wales
Source: Home Office, Workforce Open Data Table
6.11 Police officers: Age
Following the first publication of this release, and during quality assurance checks for the publication of the quarterly ‘police officer uplift statistics’, analysts found an error in the code used to produce data on the age of the police workforce. The code had inadvertently placed all police workers with an age of 56 years in the “not stated” category. This section has therefore been revised since first publication.
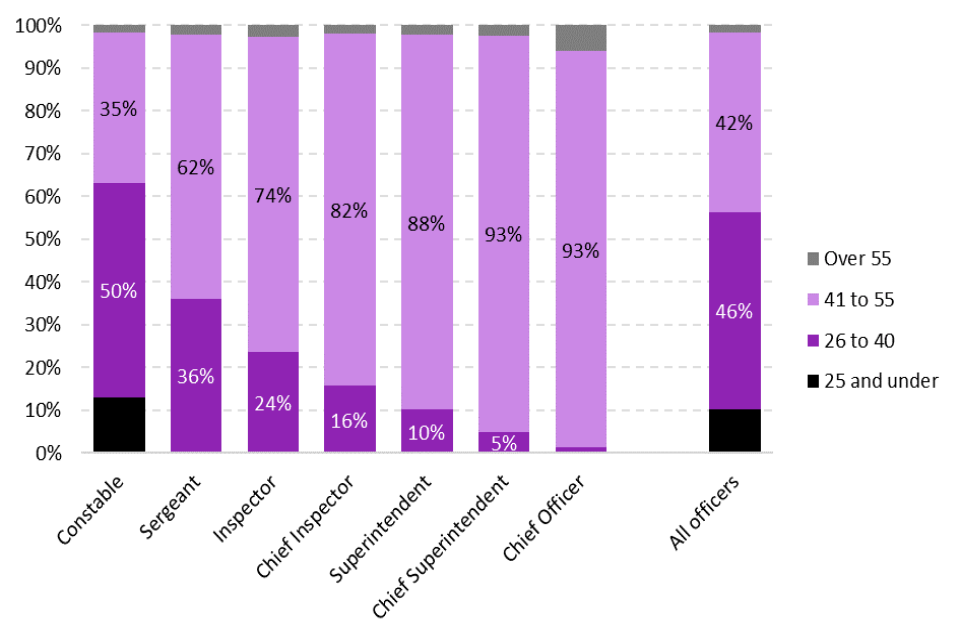
As at 31 March 2021, over half (56%) of all police officers were aged 40 or under, with 10% of all officers aged 25 and under. As expected, the age profile varied by rank, with a large proportion of older officers in more senior ranks; for example, while just 3 chief officers (1.3%) were aged under 40, 63% of constables were.
Figure 6.10: Age breakdown1 of police officers, by rank, as at 31 March 2021
Source: Home Office, Table D5
Notes:
- Excludes cases where the age of the officer is unknown.
6.12 Police staff, PCSOs, designated officers and special constables: Age
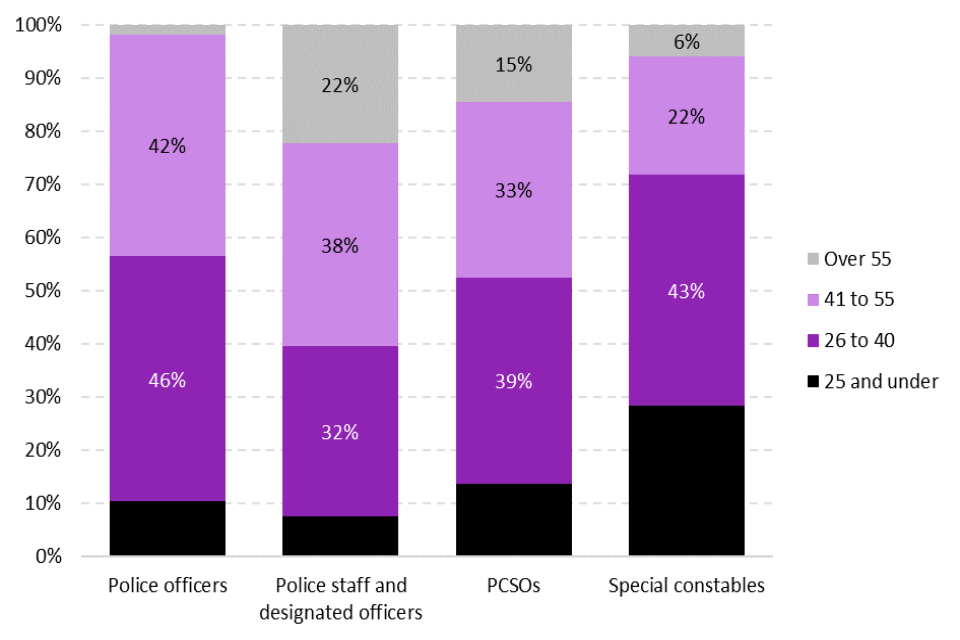
Figure 6.11 shows the variation in the age profile of the police workforce. As expected, civilian staff tended to be older than other worker types, with 22% of staff and designated officers over the age of 55, compared with just 1.8% of officers. In contrast, the Special Constabulary had a younger profile than the paid ranks, with 28% of special constables aged 25 and under. This was much higher than the next nearest worker type (PCSOs at 14%).
Figure 6.11: Age breakdown1 of police workers, by worker type, as at 31 March 2021
Source: Home Office, Age Open Data Table
Notes:
- Excludes cases where the age of the worker is unknown.
7 Officer Wellbeing
Key results
- as at 31 March 2021, there were 1,965 full-time equivalent (FTE) police officers on long-term sick leave in the 43 forces in England and Wales which was equivalent to 1.5% of police officers in England and Wales
- as at 31 March 2021, there were 4,005 FTE officers on long-term absence in the 43 forces in England and Wales (equivalent to 3.0% of all officers)
- rates of long-term absence have fallen compared with the previous year and the proportion of all officers on long-term absence as at the 31 March 2021 was the lowest level recorded since 2011 (when 2.9% of officers were on long-term absence)
- excluding Cheshire (who could not provide data), as at 31 March 2021, there were 4,758 police officers (headcount) on recuperative duties, equivalent to 3.5% of officers. There were also a further 5,906 officers on adjusted or restricted duties, equivalent to a further 4.4% of officers in these forces
7.1 Introduction
This chapter provides information on the number of officers on long-term sick leave, and the number on recuperative and adjusted or restricted duties as at 31 March of each year. Definitions of recuperative, restricted and adjusted duties, as well as information on long-term sickness, are provided in the relevant sections below.
7.2 Sickness
This section contains information on the number of police officers (FTE) on long-term sick leave, as at 31 March each year. Long-term sickness includes any recognised medical condition, physical or psychological, as reported by the officer or a medical practitioner, which has lasted for more than 28 calendar days.
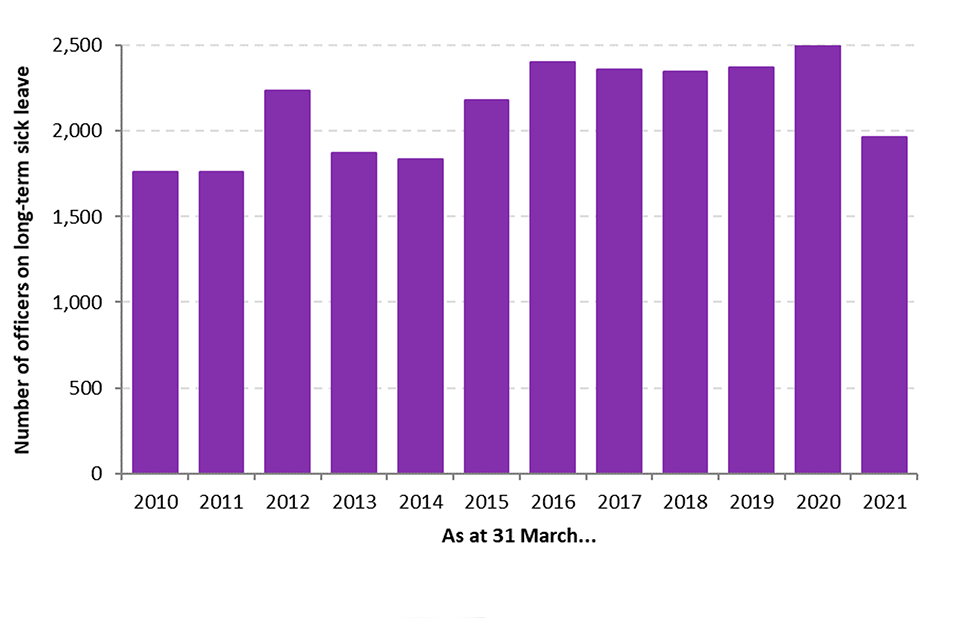
As at 31 March 2021, there were 1,965 full-time equivalent police officers on long-term sick leave in the 43 forces in England and Wales, a decrease of 613 officers (FTE) when compared with the previous year.
As a proportion of all officers in the 43 forces in England and Wales, 1.5% of police officers were on long-term sick leave as at 31 March 2021, the lowest proportion since 2014.
Figure 7.1: Number of officers (FTE) on long-term sick leave, as at 31 March 2010 to 31 March 2021, England and Wales1
Source: Home Office, Table W1
Notes:
- In order for sickness to be classed as long-term, an officer must be absent for more than 28 calendar days.
7.3 Sickness by rank
There was some variation in sickness levels across ranks, with officers at higher ranks generally having lower levels of sickness; 1.6% of constables were on long-term sick leave, compared with 0.9% of officers of Chief Inspector rank or above.
Falls in sickness levels compared with the previous year were seen across each rank except for Chief Officer and Chief Superintendent which remained stable.
Table 7.1: Proportion of officers (FTE) on long-term sick leave, by rank, as at 31 March 2021, England and Wales
| Rank | Proportion on long-term sick leave |
|---|---|
| Constable | 1.6% |
| Sergeant | 1.1% |
| Inspector | 1.0% |
| Chief Inspector or above | 0.9% |
Source: Home Office, Absence Open Data Table
Sickness rates have been consistently higher among females than males with 1.7% of female officers on long-term sick leave, compared with 1.3% of male officers as at 31 March 2021.
7.4 Recuperative and adjusted or restricted duties
This section contains information on the number of officers on recuperative and adjusted or restricted duties as at the 31 March 2021, broken down by gender. Data in the section are based on officer headcount (rather than full time equivalents).
On 1 May 2015, reforms came into effect that meant forces were required to re-categorise officers who were not fully deployable. This saw the replacement of the previous categories (which were used in different ways by different forces) with the more precise category of ‘limited duties’. This includes three sub-categories of ‘adjusted’, ‘recuperative’ and ‘management restricted’ duties’ (data on management restricted duties are not collected by the Home Office). The transition to this new framework has taken place on different timescales across forces, and as a result, 2018 data will include officers categorised under a mixture of the old and new definitions (i.e. those officers previously categorised as ‘restricted’ on medical grounds and those newly categorised as being on ‘adjusted’ duties). In future years, it is likely that the data will more closely reflect the new categories, as forces complete their transition to these.
Definitions of recuperative, adjusted, and management restricted duties are provided below.
Adjusted duty: Duties falling short of full deployment, in respect of which workplace adjustments (including reasonable adjustments under the Equality Act 2010) have been made to overcome barriers to working. For an officer to be placed on adjusted duties, they must be attending work on a regular basis and be working for the full number of hours for which they are paid (in either a full time or part time substantive role).
Recuperative duty: Duties falling short of full deployment, undertaken by a police officer following an injury, accident, illness or medical incident, during which the officer adapts to and prepares for a return to full duties and the full hours for which they are paid, and is assessed to determine whether he or she is capable of making such a return.
Management restricted duty: Duties falling short of full deployment to which an officer is allocated in circumstances in which: verifiable confidential or source sensitive information or intelligence has come to the notice of the force that questions the suitability of an officer to continue in his or her current post; or serious concerns are raised which require management actions, both for the protection of individuals and the organisation. In either case also that: criminal or misconduct proceedings are not warranted; and the Chief Constable has lost confidence in the officer continuing in their current role.
Excluding Cheshire (who could not provide data), as at 31 March 2021, there were 4,758 police officers (headcount) on recuperative duties, equivalent to 3.5% of officers. There were also a further 5,906 officers on adjusted or restricted duties, equivalent to a further 4.4% of officers in these forces.
Of female officers in the 42 police forces in England and Wales (excluding Cheshire), 4.7% were on recuperative duties and 6.2% were on adjusted or restricted duties as at 31 March 2021. This was higher than the proportion of males on recuperative and adjusted or restricted duties, which were each 2.9% and 3.4% respectively.
7.5 Long-term absence
This section presents data on long-term absence due to career breaks, maternity/paternity leave, sick leave and suspension. More detailed information on absences due to long-term sickness is covered in section 7.2. Long-term absence is any absence that has lasted for more than 28 calendar days, as at the end of the reporting period (31 March 2021).
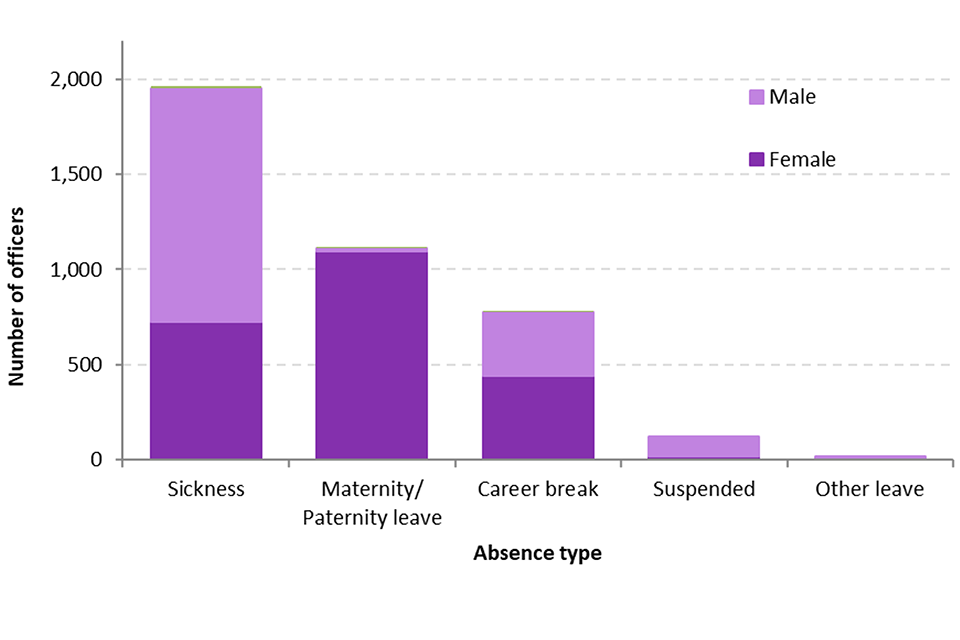
As at 31 March 2021, there were 4,005 full-time equivalent (FTE) officers on long-term absence in the 43 forces in England and Wales (equivalent to 3.0% of all officers).
Of officers on long-term absence, 1,965 (49%) were on sick leave, 1,120 (28%) were on maternity or paternity leave, and 780 (19%) were on career breaks. The remaining 3% were either suspended, or on ‘other leave’ (which includes compassionate leave and special leave).
The number of FTE police officers on long-term absence as at 31 March 2021 has fallen by 852 compared with last year and was also the lowest level recorded since 31 March 2011. This recent fall was particularly driven by a year-on-year fall in sickness and career break absences which declined by 613 and 206 respectively.
Figure 7.2: Number of officers (FTE) on long-term absence broken down by absence type and gender, England and Wales, as at 31 March 20211
Source: Home Office, Absence Open Data Table
Notes:
- In order for sickness to be classed as long-term, an officer must be absent for more than 28 calendar days.
Although females accounted for 32% of police officers in England and Wales, they accounted for 57% of all long-term absentees as at 31 March 2021. However, excluding maternity or paternity leave, females accounted for 41.5% of all absences. Although females accounted for a disproportionate amount of many of the absence types (relative to the breakdown by gender of police officers), maternity or paternity leave, and career breaks were, as expected, the two categories in which females accounted for the majority of absences.
Table 7.2: Proportion of long-term absence accounted for, by gender, as at 31 March 2021, England and Wales
| Absence type | Proportion Male | Proportion Female |
|---|---|---|
| Career break | 43.2% | 56.8% |
| Sick leave | 62.8% | 37.2% |
| Maternity or Paternity leave | 1.5% | 98.5% |
| Other | 66.4% | 33.6% |
| Suspended | 86.5% | 13.5% |
| All long-term absence (excluding Maternity and Paternity) | 58.5% | 41.5% |
| All long-term absence | 42.6% | 57.4% |
| All police officers | 67.6% | 32.4% |
Source: Home Office, Absence Open Data Table
7.6 Additional data
HM Inspectorate of Constabulary and Fire & Rescue Services (HMICFRS) publishes a range of data in their annual Value for Money Profiles. This includes data on short and medium-term sickness, as well as recuperative and adjusted or restricted duties.
Data on short and medium-term sickness are considered to be less robust than long-term sickness and should be interpreted with caution. Short and medium-term sickness is more likely to fluctuate from one year to the next and can be more prone to variation in the accuracy of recording between forces.
-
Designated officers are police staff (who are not police officers) employed to exercise specific powers that would otherwise only be available to police officers. Some forces are unable to distinguish designated officers from police staff, therefore, they have been combined to better reflect the situation across all forces. These workers can be separately identified in the Open Data Tables. ↩
-
Population data from the 2011 Census, based on whole population. Data available on the ONS website. ↩