Police use of taser statistics, England and Wales: January to June 2014
Published 15 October 2014
Applies to England and Wales

© Crown copyright 2014
This publication is licensed under the terms of the Open Government Licence v3.0 except where otherwise stated. To view this licence, visit nationalarchives.gov.uk/doc/open-government-licence/version/3 or write to the Information Policy Team, The National Archives, Kew, London TW9 4DU, or email: psi@nationalarchives.gov.uk.
Where we have identified any third party copyright information you will need to obtain permission from the copyright holders concerned.
This publication is available at https://www.gov.uk/government/statistics/police-use-of-taser-statistics-england-and-wales-january-to-june-2014/police-use-of-taser-statistics-england-and-wales-january-to-june-2014
1. Summary
The figures presented in this report detail the number of times taser was used from 1 January to 30 June 2014. The use of taser with the most physical impact is ‘fired’ which can result in incapacitation. For the purposes of police statistical reporting this is known as the ‘highest use’ of a taser. When a taser is ‘drawn’ but not discharged this is known as the ‘lowest use’. The following types of taser use, ‘red dot’, ‘arcing’ ‘aimed’ and ‘drawn’ are known as ‘non-discharges’ as the taser does not make contact with the subject.
Taser use is defined in the Authorised Professional Practice (APP)[footnote 1] published by the College of Policing. A summary of this information is in the table in the background and definitions section of this document.
The figures in this report show the number of times taser was used as opposed to the number of taser ‘incidents’. This is designed to ensure full transparency on taser deployment, as more than one taser may be used at an incident.
Every time a taser is used in some capacity (fired, angle-drive stun, drive stun, red dot, arced, aimed or drawn) a record of its ‘highest use’ is made by the police officer and a short form is completed. These are collated by the Home Office in order to produce aggregated figures of taser use.
New figures are presented in this report for the six month period between 1 January and 30 June 2014 inclusive. Key findings are:
- the total number of times taser was used by the police in this period is 5,107
- non-discharges account for 81% of the taser use
- the most common use of taser in this period was ‘red dot’, which accounted for 52% of overall use
- the percentage for ‘drive stun’ and ‘angle drive stun’ accounted for 3% of overall use
- the percentage for ‘fired’ accounted for 16% of overall use
2. Overall taser use
Taser use is recorded against seven types: fired, angle-drive stun, drive stun, red dot, arced, aimed or drawn. Only the ‘highest use’ for each taser deployed is recorded. For example if a taser is ‘drawn’ and then ‘fired’, the officer will only record ‘fired’ as that is the ‘highest use’ of that specific deployment.
Figure 1 shows the percentage and type of taser use between 1 January and 30 June 2014. Non-discharges (‘red dot’ ‘arcing’ ‘aimed’ and ‘drawn’) account for 81% of the taser use, with discharges accounting for 19%. For comparison, the ratio of non-discharges to discharges for the calenday year 2013 was 80% to 20%.
Figure 1: Police use of taser in England and Wales by type, January to June 2014
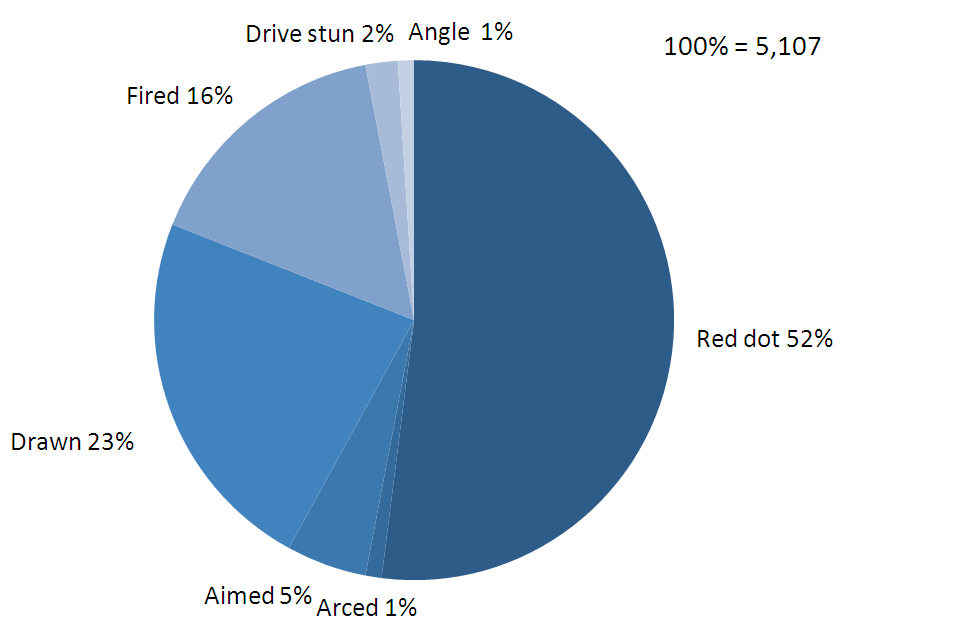
Police use of Taser in England and Wales by type, red dot 52%, drawn 23%, fired 16%, aimed 5%, drive stun 2%, angle 1%, arced 1%.
Notes: Components may not sum up to 100 due to rounding.
This pie chart includes a full breakdown of taser use, including Humberside and West Midlands Police forces, which were not included in previous publications.
3. Trends in taser use
As previously published in March 2014, Figure 2 shows that police use of taser increased from 3,128 to 10,380 between 2009 and 2013 as the rollout and deployment of taser took place across police forces in England and Wales. We will publish new figures covering the full period for 2014 in the next publication in March 2015. This will include the latest data on police use of taser for the final six months of 2014.
Figure 2: Police use of taser in England and Wales 2009 to 2013
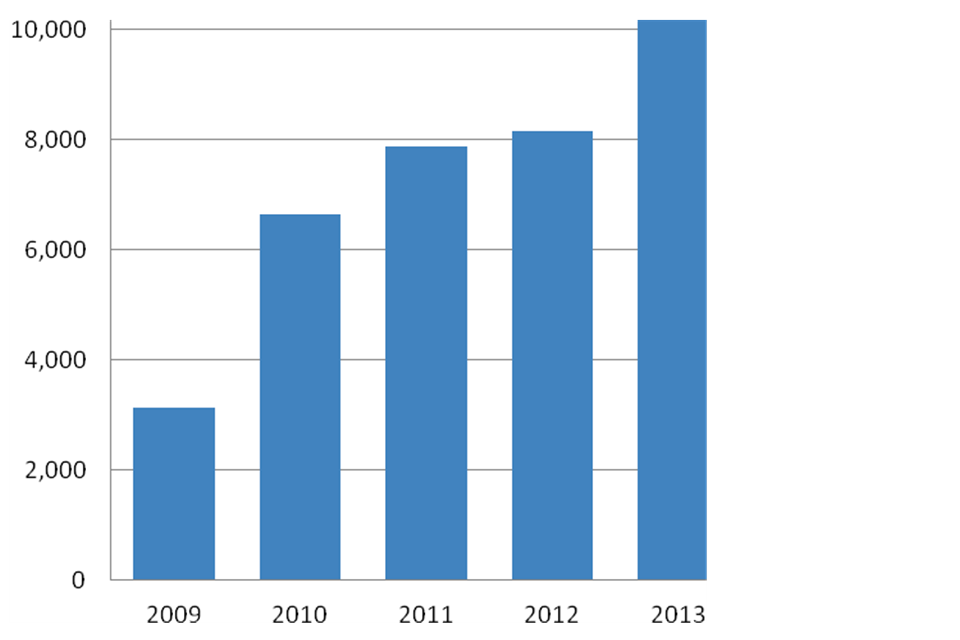
Breakdown of police use of taser by calendar year, 2009 3128, 2010 6649, 2011 7877, 2012 8161, 2013 10380.
Source: Home Office
Notes: This table shows the breakdown of police use of Taser by calendar year.
The trend data presented in Figure 2 can partly be accounted for by the phased rollout of taser from Authorised Firearm Officers to Specially Trained Units across all police forces in England and Wales.
4. Data quality and use of data
There are a number of factors that may lead to an increase or decrease in the use of taser. The figures in this statistical release should not be used to interpret how any of these factors are changing.
Care should be taken when making comparisons between police forces on the levels of taser use. This is dependent on a variety of factors including police force policy on taser use, the population size within the force area, the level of violent crime, and the incremental introduction of taser across police forces in England and Wales (see Appendix 1 in the police use of taser data tables).
In previous publications, two police forces (West Midlands and Humberside), were unable to provide a total breakdown of their figures. This information has been provided for the first half of 2014 and is included in this publication.
The last set of taser statistics, released in March 2014, were based on police force returns due to ongoing complications with the Home Office Taser Database. We have also used aggregated police force returns for this publication, and will do so until the Home Office Taser Database can be relied upon to provide a viable alternative.
The method and consistency of the collection of the data produced for publication is being monitored and reviewed. The next publication is expected to be released in March 2015 covering the full calendar year for 2014.
The tables of taser use figures can also be accessed as ODS files available at ‘Police use of taser statistics, England and Wales: January to June 2014: data tables’.
5. Background and definitions
Taser[footnote 2] is a pistol-like conductive energy device that can incapacitate an individual through the use of an electrical current. It is less lethal than a conventional firearm and provides a valuable tactical option for the police when faced with violence or threats of violence of such severity that force is needed to protect the public, themselves or the individual.
The Home Office and the police undertook rigorous testing of taser, including submitting it for independent medical assessment, before they were introduced.
The data provided by the police to the Home Office on taser use provides information as to operational effectiveness of taser, and makes transparent the levels and types of use. The data is also analysed for any medical implications.
The background to the trial, assessment and eventual deployment of taser was set out in the September 2013 publication[footnote 3].
The table below sets out the definitions for the different types of taser use.
| Level of use | Type of use | Definition |
|---|---|---|
| Highest use[footnote 4] | Fired | The taser is fired with a live cartridge installed. When the trigger is pulled, the probes are fired towards the subject with the intention of completing an electrical circuit and delivering an incapacitating effect. |
| Angled Drive Stun | The officer fires the weapon with a live cartridge installed. One or both probes may attach to the subject The officer then holds the taser against the subject’s body in a different area to the probe(s), in order to complete the electrical circuit and deliver an incapacitating effect. | |
| Drive stun | The taser is held against the subject’s body and the trigger is pulled with no probes being fired. Contact with the subject completes the electrical circuit which causes pain but does not deliver an incapacitating effect. | |
| Non-discharges | Red dot | The weapon is not fired. Instead, the taser is deliberately aimed and then partially activated so that a laser red dot is placed onto the subject. |
| Arcing | Sparking of the taser without aiming it or firing it. | |
| Aimed | Deliberate aiming of the taser at a targeted subject. | |
| Lowest use | Drawn | Drawing of taser in circumstances where any person could reasonably perceive the action to be a use of force. |
-
Full APP available at Use of force, firearms and less lethal weapons. ↩
-
Only Conducted Energy Devices manufactured by TASER International are currently authorised for use by police forces in England and Wales. ↩
-
Police use of taser statistics, England and Wales. ↩
-
The highest level of use is ‘fired’ which is designed to result in incapacitation, the lowest level of use is drawn. ↩