Plant Health – international trade and controlled consignments, 2016-2020 – experimental statistics publication
Updated 16 December 2021

© Crown copyright 2021
This publication is licensed under the terms of the Open Government Licence v3.0 except where otherwise stated. To view this licence, visit nationalarchives.gov.uk/doc/open-government-licence/version/3 or write to the Information Policy Team, The National Archives, Kew, London TW9 4DU, or email: psi@nationalarchives.gov.uk.
Where we have identified any third party copyright information you will need to obtain permission from the copyright holders concerned.
This publication is available at https://www.gov.uk/government/statistics/plant-health-international-trade-and-controlled-consignments-2016-2020-experimental-statistics-publication/plant-health-international-trade-and-controlled-consignments-2016-2020-experimental-statistics-publication-html-version
These statistics present an analysis of international trade in plant and plant commodities[footnote 1] (including live plants, fruit, vegetables and cereals) – covering both the financial value and the physical scale (mass) of this trade. This release also presents an analysis of the notifications of controlled commodities – i.e., where checks are carried out to ensure that traded goods meet required standards. Data cover the period 2016 to 2020 (Forestry Commission data cover 2016/17-2020/21). Geographical coverage is specified at the start of each section.
1. Key findings
- During the period 2016-2020 the overall value of trade in plants and plant commodities increased while the overall net mass decreased slightly. Such trends were not always linear due to the volatile nature of the trade, which can be affected by climate events, pest and disease and other factors.
- In 2020, imports accounted for 89.8 per cent of all trade value and 82.6 per cent of net mass of trade in plants and plant commodities.
- The value of trade in plant and plant commodities between the UK and the European Union increased between 2016 and 2020, whilst net mass decreased. The value and net mass of trade with non-EU countries increased over the time period.
- In 2020, over 146,000 consignments of controlled material were notified to the Plant Health and Seeds Inspectorate (PHSI), an increase of around 42 per cent since 2016. The largest increase in consignment numbers was between 2019 and 2020, following the introduction of new EU legislation.
- In 2020/21, over 2,800 consignments of controlled material were notified to the Forestry Commission. The number of consignments was lower (-824) than in 2016/17 while the volume of material in the consignments also decreased (-37,628m3).
2. Contents
Trade in plants and plant products
Plant Health and Seeds Inspectorate
3. Introduction
Plants are environmentally, economically, and socially important, providing a vital contribution to our food and timber supply and to the rural economy. Plants also perform an essential ecosystem service in shaping the landscape and supporting biodiversity and have been linked to improved health and wellbeing[footnote 2].
The globalisation of trade has facilitated an increase in the volume and diversity of plants and plant commodities which enter the UK. This trade generates economic value but also needs to be regulated (controlled), noting the links, along with other factors, to increased risk of pest and disease[footnote 3].
Hence plant health legislation[footnote 4] controls the import and movement of certain plants, trees, seeds and organic matter - such as soil - and certain plant products, including fruit, potatoes, vegetables, cut flowers, timber, foliage and grain.
The analysis below explores both the overall UK trade in plants and plant commodities, and also the trade in regulated plant health and forestry commodities which informs the inspections undertaken by the Plant Health and Seeds Inspectorate (PHSI) and the Forestry Commission (FC) to prevent plant pests and diseases from entering England and Wales, and, for Forestry Commission, Scotland[footnote 5].
Please note that the three datasets explored in this publication are not directly comparable. There are key differences in how each dataset is compiled and these are outlined further in the accompanying quality and methodology report.
4. Experimental Statistics
This statistical release is intended as a contribution to increase the wider understanding about trade in these commodities and about plant health. It is designed to provide stakeholders, internal and external to government, with information on the patterns of trade over time for a specific set of commodities. The primary aim is to facilitate discussion and aid decision making around biosecurity.
The release is not intended for the purpose of drawing inferences as to the effectiveness of plant health and forestry inspectorates.
New statistical releases are classified as experimental statistics in order to secure feedback from users – for example about the long-term need for the information (the user value) and the technical fitness for purpose (the quality). If you have any comments or feedback on this release – or about other needs for formal statistics in policy areas of trade and biosecurity - please contact
Sam Grant,
Plant Health Statistics,
Horizon House,
Deanery Rd,
Bristol
BS1 5TL.
Guidance on Experimental Statistics
5. Impact of the coronavirus pandemic (COVID-19) and the effect of EU exit on trade in plants and plant products
It is not currently possible to ascertain what the impact of the coronavirus pandemic and EU exit has been on trade in plants and plants products. This is because trade in plants and plant products is often volatile, due to climate and other factors, and because both the coronavirus pandemic and EU exit are still having an influence.
The Office for National Statistics have published a report looking at the impacts of EU exit and the coronavirus on UK trade in goods which provides a high level picture of trade throughout 2020 and into 2021: The impacts of EU exit and the coronavirus on UK trade in goods
For plants and plant product which require regulatory control the impact of EU exit, particularly imports from the EU to GB, will be ongoing as the UK phases in its checking regime: Imports of plants and plant products from the EU to GB
6. Trade in plants and plant products
Her Majesty’s Revenue and Customs (HMRC) compiles statistics on commodities physically leaving and entering the UK, traded with both European Union (EU) Member States and non-EU countries. EU trade data in this release (data to 31st December 2020) is collected was Intrastat which covers VAT-registered businesses whose annual value of arrivals and/or dispatches exceeds a given exemption threshold[footnote 6]
Although not collected for plant health purposes the HMRC data does allow us to examine the patterns of trade for a sub-section of commodities, i.e., raw and simply processed plants and plant commodities, and to group these into categories. The categories covered in this release are:
- Plants and planting material. This category includes bulbs, plants for planting, forest tree seed and cut flowers.
- Food and crops. This category includes fruit, vegetables, cereals, nuts, herbs and spices.
- Forestry: This category includes timber (unprocessed or simply processed: sliced, planed or chipped), packing cases, casks and barrels.
7. Table 1: Value of trade in plants and plant commodities, by sector, 2016-2020
| Sector | 2016 | 2017 | 2018 | 2019(R) | 2020(P) | Value change 2016 to 2020 | Percentage change 2016 to 2020 |
|---|---|---|---|---|---|---|---|
| Imports | |||||||
| Plants and planting material | 1,018 | 1,045 | 1,003 | 1,005 | 1,023 | 5 | 0.4 |
| Food and crops | 8,981 | 9,857 | 9,742 | 9,987 | 10,477 | 1,496 | 16.7 |
| Forestry | 1,708 | 1,933 | 2,070 | 1,986 | 1,945 | 237 | 13.9 |
| Total | 11,707 | 12,835 | 12,815 | 12,979 | 13,445 | 1,738 | 14.8 |
| Exports | |||||||
| Plants and planting material | 103 | 119 | 123 | 119 | 102 | -1 | -1.0 |
| Food and crops | 1,494 | 1,112 | 1,065 | 1,342 | 1,248 | -246 | -16.5 |
| Forestry | 144 | 170 | 186 | 189 | 175 | 31 | 21.4 |
| Total | 1,742 | 1,401 | 1,374 | 1,651 | 1,526 | -216 | -12.4 |
| All trade | |||||||
| Plants and planting material | 1,122 | 1,164 | 1,126 | 1,124 | 1,125 | 4 | 0.3 |
| Food and crops | 10,475 | 10,970 | 10,806 | 11,330 | 11,726 | 1,251 | 11.9 |
| Forestry | 1,852 | 2,103 | 2,256 | 2,176 | 2,120 | 268 | 14.5 |
| Total | 13,449 | 14,237 | 14,188 | 14,629 | 14,971 | 1,522 | 11.3 |
Table 1 shows the total value of trade in plants and plant commodities, by sector, between 2016 and 2020.
-
The total value of trade in plants and plant commodities has shown a broad upward trend over the time period. Forestry was the only sector where the value of both imports and exports increased.
-
Whilst the value of total trade and imports both increased (by 11.3 per cent and 14.8 per cent respectively) during the time frame, the value of exports decreased by 12.4 per cent.
-
The value of imports of forestry material increased by 13.9 per cent over the time period (£1,708m in 2016 to £1,945m in 2020) whilst the value of exports in this sector increased by 21.4 per cent (£144m in 2016 to £175m in 2020). The value of forestry exports in 2020 was lower than in 2018 and 2019.
8. Table 2: Net mass of trade in plants and plant commodities, by sector, 2016-2020
| Sector | 2016 | 2017 | 2018 | 2019(R) | 2020(P) | Value change 2016 to 2020 | Percentage change 2016 to 2020 |
|---|---|---|---|---|---|---|---|
| Imports | |||||||
| Plants and planting material | 351 | 388 | 358 | 361 | 344 | -7 | -1.9 |
| Food and crops | 11,707 | 12,939 | 13,077 | 12,729 | 13,744 | 2,037 | 17.4 |
| Forestry | 4,154 | 4,321 | 4,521 | 4,669 | 4,642 | 488 | 11.7 |
| Total | 16,212 | 17,647 | 17,955 | 17,759 | 18,730 | 2,518 | 15.5 |
| Exports | |||||||
| Plants and planting material | 44 | 55 | 48 | 50 | 40 | -4 | -8.4 |
| Food and crops | 6,229 | 3,031 | 2,487 | 4,095 | 3,414 | -2,815 | -45.2 |
| Forestry | 784 | 809 | 761 | 684 | 484 | -299 | -38.2 |
| Total | 7,057 | 3,895 | 3,296 | 4,828 | 3,939 | -3,118 | -44.2 |
| All trade | |||||||
| Plants and planting material | 395 | 443 | 406 | 411 | 384 | -10 | -2.7 |
| Food and crops | 17,937 | 15,970 | 15,564 | 16,824 | 17,158 | -778 | -4.3 |
| Forestry | 4,938 | 5,130 | 5,281 | 5,353 | 5,126 | 188 | 3.8 |
| Total | 23,269 | 21,542 | 21,251 | 22,587 | 22,669 | -600 | -2.6 |
Table 2 shows the total net mass of trade in plants and plant commodities, by sector, between 2016 and 2020.
-
The total net mass of trade in plants and plant commodities decreased slightly between 2016 and 2020. Despite this decrease, total net mass in 2020 was at its highest since 2016, standing at 22,669 thousand tonnes.
-
The total net mass of exports decreased by 44.2 per cent during the time period, driven by substantial decreases in food and crops and forestry.
-
Plants and planting materials was the only sector to see a decrease in the net mass of imports (-1.9 per cent), from 351 thousand tonnes in 2016 to 344 thousand tonnes in 2020. Despite this overall decrease, the intervening years (2017-2019) all had higher levels of imports.
9. Figure 1: Changes in international trade of plants and plant commodities, 2016-2020
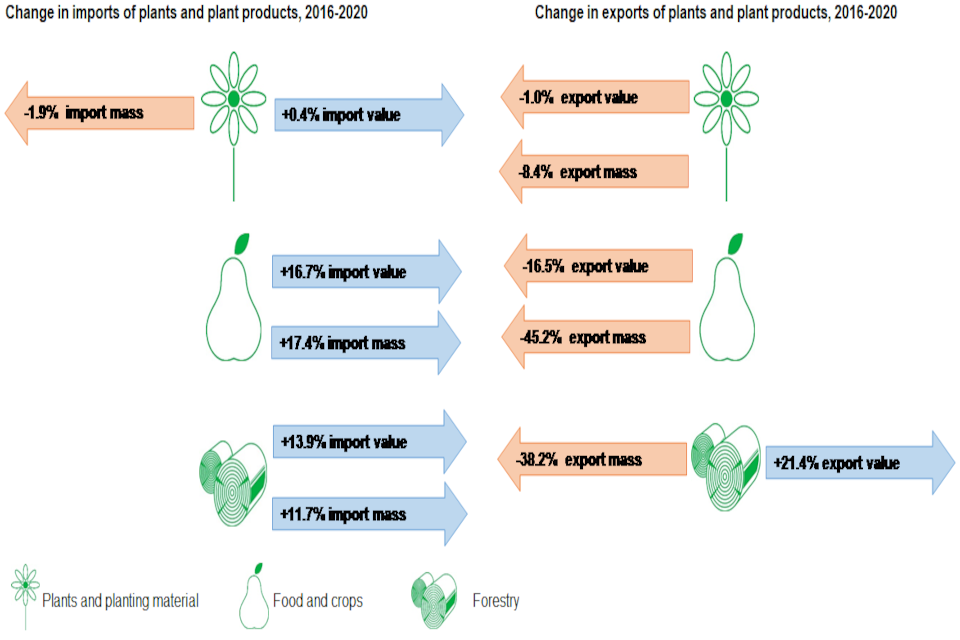
Infographic showing percentage change of value and net mass within each sector and trade flow between 2016 and 2020. Direction of travel is shown pictorially by arrow either side of icons representing each sector.
10. Table 3: Value of UK-EU trade in plants and plant commodities, by sector, 2016-2020
| Sector | 2016 | 2017 | 2018 | 2019 | 2020(P) | Value change 2016 to 2020 | Percentage change 2016 to 2020 |
|---|---|---|---|---|---|---|---|
| EU Imports | |||||||
| Plants and planting material | 838 | 858 | 811 | 819 | 854 | 16 | 1.9 |
| Food and crops | 4,306 | 4,679 | 4,670 | 4,796 | 5,080 | 774 | 18.0 |
| Forestry | 1,262 | 1,480 | 1,628 | 1,551 | 1,546 | 284 | 22.5 |
| Total | 6,406 | 7,016 | 7,108 | 7,166 | 7,480 | 1,073 | 16.8 |
| EU Exports | |||||||
| Plants and planting material | 82 | 92 | 96 | 89 | 79 | -3 | -3.2 |
| Food and crops | 1,124 | 914 | 888 | 1,097 | 978 | -146 | -13.0 |
| Forestry | 110 | 132 | 147 | 145 | 140 | 30 | 27.7 |
| Total | 1,315 | 1,138 | 1,132 | 1,331 | 1,197 | -118 | -9.0 |
| All EU trade | |||||||
| Plants and planting material | 920 | 950 | 907 | 908 | 933 | 13 | 1.4 |
| Food and crops | 5,430 | 5,593 | 5,558 | 5,893 | 6,057 | 628 | 11.6 |
| Forestry | 1,372 | 1,611 | 1,775 | 1,697 | 1,687 | 314 | 22.9 |
| Total | 7,722 | 8,154 | 8,240 | 8,497 | 8,677 | 955 | 12.4 |
Table 3 shows the value of commodities that are imported into the UK from the EU and commodities that are exported from the UK to the EU, by sector.
-
The total value of trade in plants and plant commodities between the UK and the EU increased by 12.4 per cent between 2016 and 2020. The value of trade in 2020 was the highest of the time period (£8,677m).
-
The value of imports increased in all sectors over the time period. Food and crops stood at its highest level of the period (£5,080m) in 2020, however the peak year of value of imports from the EU was 2017 for plants and planting material (£858m compared to £854m in 2020) and 2018 for forestry (£1,628m compared to £1,546m in 2020).
-
The value of exports of forestry increased by 27.7 per cent over the time period in contrast to plants and planting material which decreased by 3.2 per cent and food and crops which decreased by 13.0 per cent.
-
The value of exports of plants and planting material peaked in 2018 (£96m compared to £79m in 2020) and this was also true for forestry (£147m compared to £140m in 2020). Food and crops saw its highest export value in 2016 (£1,124m compared to £978m in 2020).
11. Table 4: Net mass of UK-EU trade in plants and plant commodities, by sector, 2016-2020
| Sector | 2016 | 2017 | 2018 | 2019 | 2020 | Value change 2016 to 2020 | Percentage change 2016 to 2020 |
|---|---|---|---|---|---|---|---|
| EU Imports | |||||||
| Plants and planting material | 283 | 326 | 293 | 308 | 278 | -5 | -1.8 |
| Food and crops | 5,959 | 6,338 | 6,376 | 5,609 | 6,397 | 438 | 7.4 |
| Forestry | 3,548 | 3,803 | 3,988 | 4,138 | 4,060 | 511 | 14.4 |
| Total | 9,790 | 10,467 | 10,657 | 10,055 | 10,734 | 945 | 9.6 |
| EU Exports | |||||||
| Plants and planting material | 37 | 32 | 41 | 42 | 35 | -3 | -6.9 |
| Food and crops | 4,473 | 2,646 | 2,164 | 3,437 | 2,573 | -1,900 | -42.5 |
| Forestry | 725 | 723 | 678 | 594 | 436 | -290 | -39.9 |
| Total | 5,236 | 3,401 | 2,883 | 4,073 | 3,043 | -2,192 | -41.9 |
| All EU trade | |||||||
| Plants and planting material | 320 | 358 | 334 | 350 | 312 | -8 | -2.4 |
| Food and crops | 10,432 | 8,984 | 8,540 | 9,046 | 8,970 | -1,462 | -14.0 |
| Forestry | 4,274 | 4,526 | 4,666 | 4,732 | 4,496 | 222 | 5.2 |
| Total | 15,025 | 13,868 | 13,540 | 14,128 | 13,778 | -1,248 | -8.3 |
Table 4 shows commodities that are imported into the UK from the EU and commodities that are exported from the UK to the EU, by sector.
-
During the period 2016-2020 the net mass of trade in plants and plant commodities decreased by 8.3 per cent. Only forestry saw an increase in the net mass of trade, from 4,274 thousand tonnes in 2016 to 4,496 thousand tonnes (+5.2 per cent) in 2020 however the 2020 value was lower than in the intervening years since 2016.
-
Plants and planting materials was the only sector to see a decrease in the net mass of imports from the EU over the time period (-1.8 per cent) whilst the net mass of forestry and food and crops imports increased (14.4 per cent and 7.4 per cent respectively).
-
The net mass of exports decreased by over 40 per cent with all sectors seeing a decline. Food and crops (-42.5 per cent) and forestry (-39.9 per cent) were more heavily affected than plants and planting material (-6.9 per cent).
-
The net mass of forestry exports declined year-on-year between 2016 and 2020.
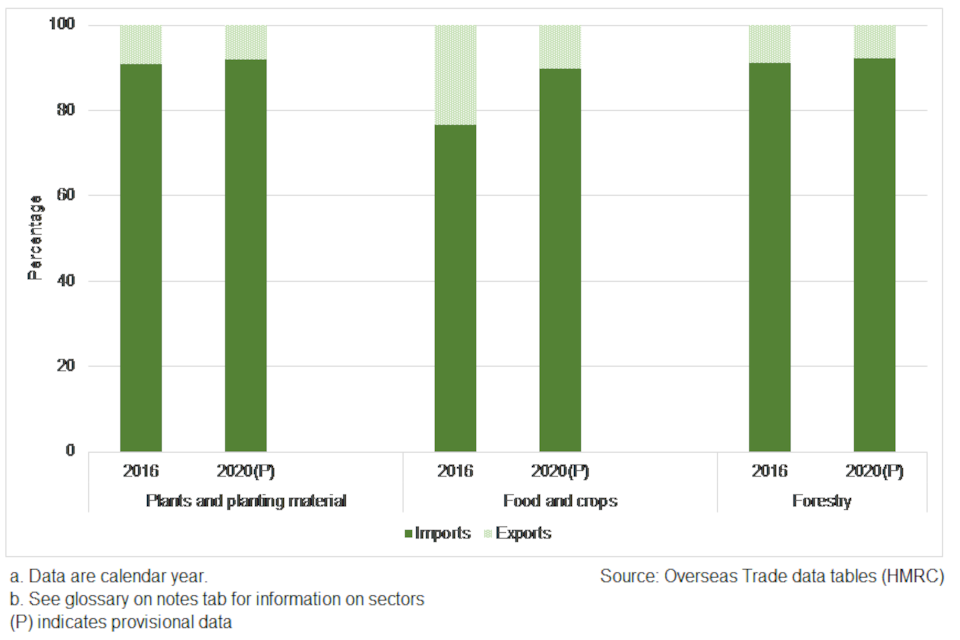
12. Charts 1a and 1b: Distribution of UK-EU trade in plants and plant commodities, 2016-2020
12.1 1.a. Value
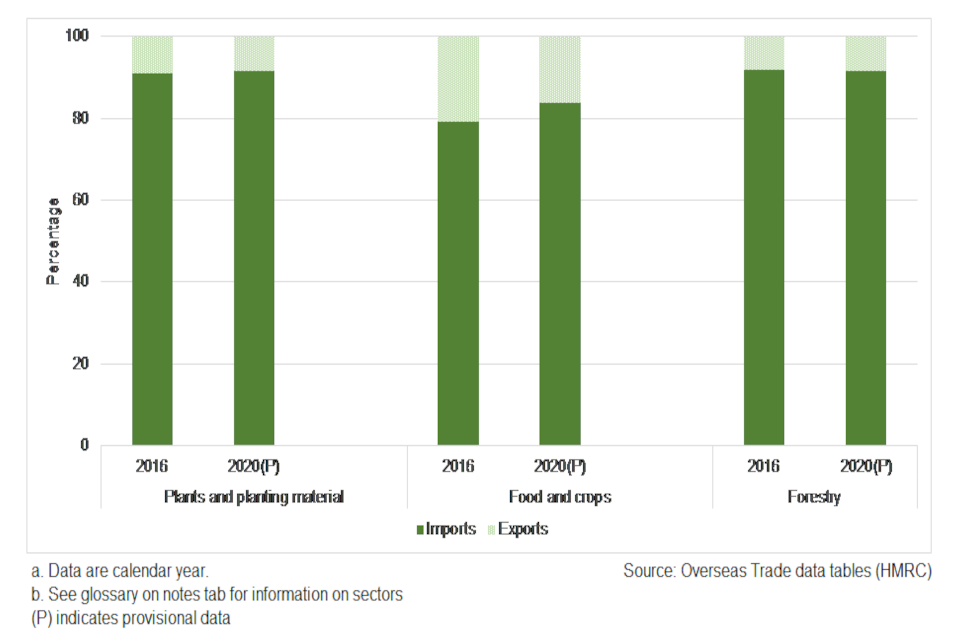
Chart 1a shows the proportion of total trade value between the UK and the EU that is imports and exports. Data are disaggregated into sectors of plants and planting material, food and crops, forestry and are shown for the years 2016 and 2020.
12.2 1.b. Net Mass
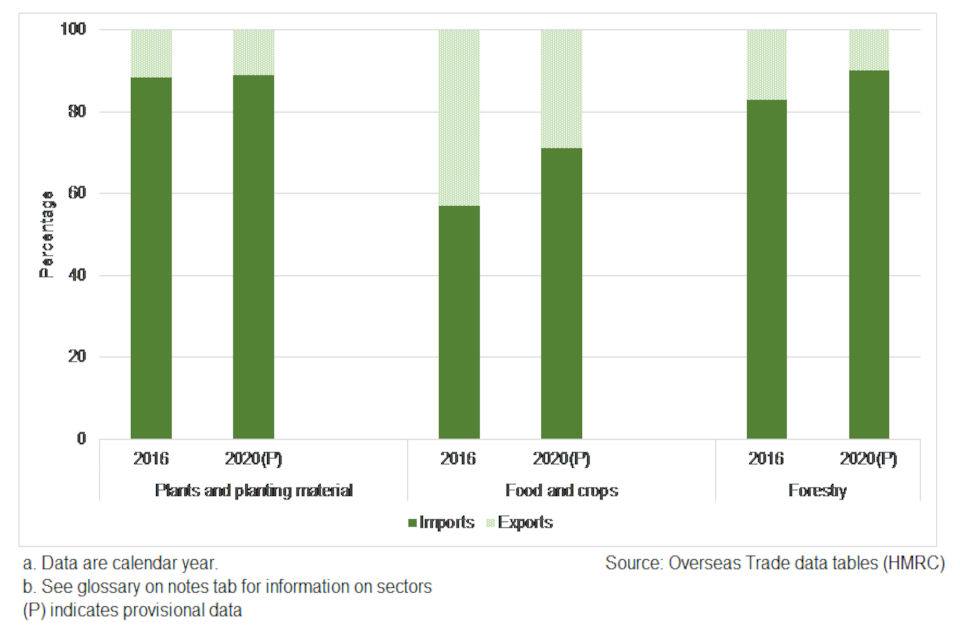
Chart 1b shows the proportion of total trade net mass between the UK and the EU that is imports and exports. Data are disaggregated into sectors of plants and planting material, food and crops, forestry and are shown for the years 2016 and 2020.
-
Imports accounted for the majority of UK-EU trade in terms of both value and net mass.
-
The proportion of EU trade value that was imports was higher for plants and planting material and forestry (over 90 per cent) than for food and crops (over 80 per cent). For net mass the picture was more mixed with plants and planting material imports and forestry comprising around 88-90 per cent of the trade in 2020 compared to food and crops at 71 per cent.
-
The proportion of trade value that was EU imports remained fairly stable for plants and planting material and forestry between 2016 and 2020 but increased by 4.6 percentage points for food and crops.
-
In terms of the net mass of EU trade, the proportion of trade that was imports remained stable for plants and planting material but increased for food and crops (14.2 percentage points) and forestry (7.3 percentage points) between 2016 and 2020.
13. Table 5: Value of UK-non-EU trade in plants and plant commodities, by sector, 2016-2020
| Sector | 2016 | 2017 | 2018 | 2019 | 2020 | Value change 2016 to 2020 | Percentage change 2016 to 2020 |
|---|---|---|---|---|---|---|---|
| Non-EU Imports | |||||||
| Plants and planting material | 180 | 187 | 193 | 186 | 169 | -11 | -6.3 |
| Food and crops | 4,675 | 5,178 | 5,072 | 5,191 | 5,398 | 723 | 15.5 |
| Forestry | 446 | 453 | 442 | 435 | 399 | -47 | -10.5 |
| Total | 5,301 | 5,819 | 5,706 | 5,812 | 5,965 | 665 | 12.5 |
| Non-EU Exports | |||||||
| Plants and planting material | 22 | 26 | 27 | 30 | 23 | 2 | 7.2 |
| Food and crops | 370 | 199 | 176 | 246 | 271 | -100 | -27.0 |
| Forestry | 34 | 39 | 39 | 44 | 35 | 0 | 1.3 |
| Total | 427 | 263 | 241 | 320 | 329 | -98 | -22.9 |
| All non-EU trade | |||||||
| Plants and planting material | 202 | 213 | 219 | 216 | 192 | -10 | -4.8 |
| Food and crops | 5,045 | 5,377 | 5,248 | 5,437 | 5,668 | 623 | 12.3 |
| Forestry | 480 | 492 | 481 | 479 | 434 | -46 | -9.7 |
| Total | 5,727 | 6,082 | 5,948 | 6,132 | 6,294 | 567 | 9.9 |
Table 5 shows the value of commodities that are imported into the UK from countries outside of the EU and commodities that are exported from the UK to these non-EU countries, by sector.
-
The total value of non-EU trade increased between 2016 and 2020 (+9.9 per cent) however there were decreases for plants and planting material (-4.8 per cent) and for forestry (-9.7 per cent).
-
The only trade flows to see increases in value were non-EU imports of food and crops (+15.5 per cent) and non-EU exports of plants and planting materials (+7.2 per cent). Non-EU exports of forestry remained fairly similar in 2016 and 2020 but intervening years saw higher values.
-
For the food and crops sector total trade value increased by 12.3 per cent. The value of non-EU imports of food and crops were at the highest of the time period in 2020, standing at £5,398m however exports of food and crops stood at £271m in 2020, its highest level since 2016 but still an overall decrease of 27.0 per cent since 2016.
-
The export value of plants and planting material increased year-on-year, from £22m in 2016 to a high of £30m in 2019 before decreasing to £23m in 2020. Forestry experienced its highest export value of the time period in 2019 at £44m.
14. Table 6: Net mass of non-EU trade in plants and plant commodities, 2016-2020
| Sector | 2016 | 2017 | 2018 | 2019 | 2020 | Value change 2016 to 2020 | Percentage change 2016 to 2020 |
|---|---|---|---|---|---|---|---|
| Non-EU Imports | |||||||
| Plants and planting material | 68 | 62 | 65 | 53 | 66 | -2 | -2.6 |
| Food and crops | 5,748 | 6,601 | 6,700 | 7,120 | 7,347 | 1,599 | 27.8 |
| Forestry | 606 | 517 | 532 | 531 | 582 | -24 | -3.9 |
| Total | 6,422 | 7,180 | 7,298 | 7,703 | 7,996 | 1,573 | 24.5 |
| Non-EU Exports | |||||||
| Plants and planting material | 7 | 23 | 7 | 8 | 6 | -1 | -16.5 |
| Food and crops | 1,756 | 385 | 323 | 658 | 841 | -915 | -52.1 |
| Forestry | 58 | 86 | 83 | 89 | 49 | -10 | -16.7 |
| Total | 1,822 | 494 | 413 | 755 | 895 | -926 | -50.9 |
| All non-EU trade | |||||||
| Plants and planting material | 75 | 85 | 72 | 61 | 72 | -3 | -3.9 |
| Food and crops | 7,505 | 6,986 | 7,024 | 7,778 | 8,188 | 683 | 9.1 |
| Forestry | 664 | 604 | 615 | 620 | 631 | -33 | -5.0 |
| Total | 8,244 | 7,674 | 7,711 | 8,459 | 8,891 | 647 | 7.9 |
Table 6 shows the net mass of commodities that are imported into the UK from countries outside of the EU and commodities that are exported from the UK to these non-EU countries, by sector.
-
Overall, the net mass of the non-EU trade in plants and plant commodities stood at 8,891 thousand tonnes in 2020, an increase of 7.9 per cent since 2016. At the sector level only food and crops increased in net mass over the time period (+9.1 per cent). Both plants and planting material and forestry had slight decreases in value since 2016 (-3.9 per cent and -5.0 per cent respectively).
-
The net mass of non-EU exports decreased for all sectors with food and crops decreasing from 1,756 thousand tonnes in 2016 to less than half: 841 thousand tonnes in 2020 (-52.1 per cent). Despite this decrease the 2020 level of net mass was higher than in all intervening years.
-
There were decreases of around 16 per cent in the net mass of exports of plants and planting material and forestry; however, with figures of net mass much lower for plants and planting materials the actual drop in net mass was 1 thousand tonnes.
-
The net mass of non-EU imports increased by 24.5 per cent between 2016 and 2020, driven by an increase of 27.8 per cent in the net mass of food and crops imports.
15. Chart 2a and 2b: Distribution of UK-non-EU trade in plants and plant commodities, 2016-2020
15.1 2.a. Value
The proportion of total trade value between the UK and countries outside of the EU that is imports and exports. Data are disaggregated into sectors of plants and planting material, food and crops, forestry and are shown for the years 2016 and 2020.
15.2 2.b. Net Mass
The proportion of total trade net mass between the UK and countries outside of the EU that is imports and exports. Data are disaggregated into sectors of plants and planting material, food and crops, forestry and are shown for the years 2016 and 2020.
-
Imports accounted for the majority of trade between the UK and countries outside of the EU in terms of both value and net mass.
-
Imports accounted for between 89 and 93 per cent of all non-EU trade value in each sector in 2016. In 2020 imports as a proportion of the trade value in a sector had increased for food and crops (+2.6 percentage points) but decreased for plants and planting material (-1.4 percentage points) and for forestry (-0.9 percentage points).
-
The proportion of net mass of non-EU trade in food and crops that was imports increased over the time period (+13.1 percentage points) whilst there were smaller increases for plants and planting material (-1.2 percentage points) and forestry (-1.1 percentage points).
16. Figure 2: Changes in trade of plants and plant commodities between 2016-2020, by area
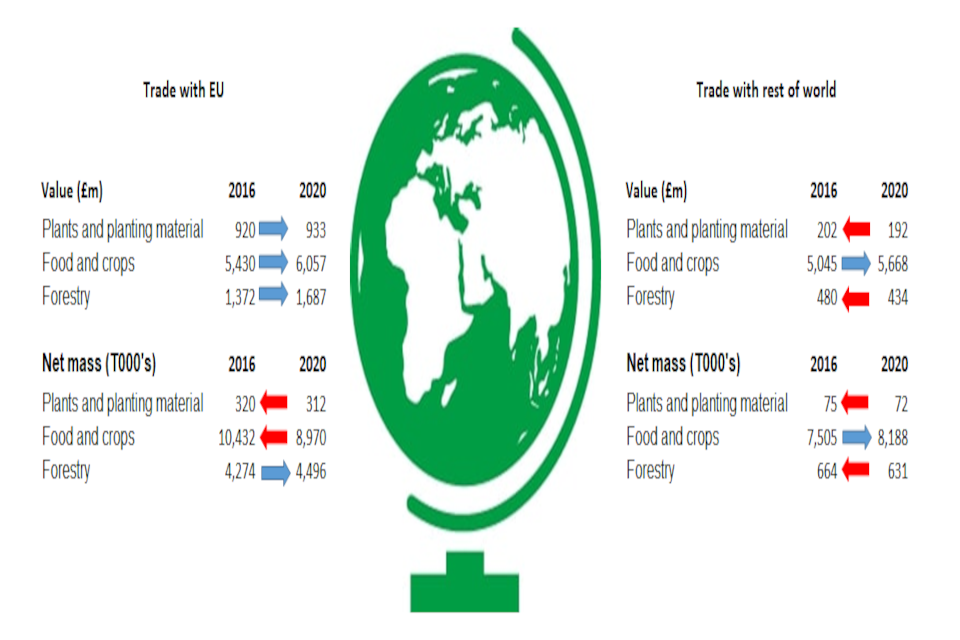
Infographic showing direction of travel for the value and net mass of trade between the UK and the EU or other countries between 2016 and 2020 by sector. Arrows show the trade value, and the trade net mass, has change for each sector.
17. Controlled Commodities
The Plant Health and Seeds Inspectorate (PHSI) implements and enforces plant health policy in England and in Wales (on behalf of the Welsh Government). The Forestry Commission (FC) implements and enforces plant health policy in England and Scotland, and in Wales via Natural Resources Wales (NRW).
PHSI and FC carry out inspections of controlled plant materials, including plants for planting. The controls of such materials differ according to the species - and what quarantine organisms they may carry – but may include phytosanitary certificates, plant passports and/or physical inspection. More detailed information covering the activities of the inspection services is available in the annual Multi Annual National Control Plan reports[footnote 8].
Under EU legislation plants, fruit, vegetables, and plant material from outside the EU fall into 3 categories: ‘unrestricted’, ‘controlled’, and, ‘prohibited’ material. Plant passports facilitate the movement of controlled commodities within the EU area whilst inspections of relevant businesses are carried out ‘in field’, generally between 2 and 4 times per year[footnote 9].
Now that the UK has left the EU new legislation is in place and, following the end of the transition period (31 December 2020), there are new processes for importing plants and plant products, including wood and wood products, from the EU. These are detailed in the Guidance on importing and exporting plants and plant products from 1 January 2021
Under the new UK legislation plants, fruit, vegetables, cut flowers, soil and other regulated objects (for example, machinery) fall into 5 categories of phytosanitary control:
- ‘prohibited’ material you can only bring into Great Britain if a scientific research license or derogation is obtained;
- ‘prohibited (pending risk assessment)’ material you can only bring into Great Britain if risk assessed by Defra (exclusions apply);
- ‘regulated and notifiable’ material you can only bring into Great Britain if accompanied by a phytosanitary certificate and advanced notification of landing;
- ‘regulated’ material you can only bring into Great Britain if accompanied by a phytosanitary certificate. After applicants complete a customs entry, a small number of these consignments may need advanced notification on CHIEF (Customs Handling of Import and Export Freight).g;-
- ‘unregulated’ material you can bring into Great Britain without a phytosanitary certificate or advanced notification.
Great Britain (England, Scotland, and Wales) has adopted a phased approach to plant health controls for plants and plant products imported from the European Union (EU). This phased approach started in January 2021 and will end on 1 July 2022 when full implementation of the new controls takes place.
The analyses below focuses on consignments of commodities classed as controlled and originating outside the EU and arriving at points of entry in Great Britain (England and Wales for PHSI, England, Wales and Scotland for FC). These consignments are subject to inspection activities ranging from document checks to physical inspections. The level of checks required for different types of commodities varies but the highest risk commodities are subject to full checks (100 per cent). In addition, emergency measures [footnote 13] can be introduced which may restrict trade due to changes in import requirements.
Controlled commodities are a subset of the trade analysis shown above (which also includes unrestricted commodities), however data are not comparable to that provided by HMRC due to differences in measurement units, geographies and purpose. More information can be found in the accompanying quality and methodology report.
Where geographical breakdowns are provided for PHSI and FC, these use United Nations Statistics Division classifications. https://unstats.un.org/unsd/methodology/m49/
18. Plant Health and Seeds Inspectorate
The Plant Health and Seeds Inspectorate (PHSI) is part of the Animal and Plant Health Agency (APHA) and implements and enforces plant health policy in England, and in Wales on behalf of the Welsh Government. PHSI carry out inspections of plants, seeds, bulbs, cut flowers, planting materials, fruits and vegetables. They also inspect agricultural machinery for export however exports are not covered in this analysis.
It is important to note that changes in the number of consignments may be influenced by changes in trade patterns as well as by legislative changes. Factors which can contribute to changes in trade patterns include climate events, changes in market demand, social unrest or change, pest outbreaks etc. Controls may be applied to any number of countries where there is a pest risk but additionally countries may apply self-prohibition if they are aware of a pest issue in their country. Where self-prohibition is applied there are no formal reporting routes and often information cannot be confirmed.
Some key bans thought to have affected imports to the UK were:
- India: Colocasia Schott and plants other than seeds of Momordica L., Solanum melongena L. and Trichosanthes L. and Mangifera were banned from 24/04/2014 until 31/12/2016 with the exception of Trichosanthes L. and Mangifera for which the ban was lifted in February 2016.
- Ghana: Capsicum L., Lagenaria Ser., Luffa Mill., Momordica L. and Solanum L., other than S. lycopersicum L. were banned from 13/10/2017 until 31/12/2017.
- Trade in fresh curry leaves was stopped from 26/04/2014 due to countries outside of the EU being unable to meet EU requirements.Israel now fulfils the necessary requirements.
New controls being introduced may also impact trade patterns. For example: - Decision 2014/78 required all imports of Capsicum to become regulated as from 1st Oct 2014. The decision also included the application of controls on some other commodities. - EU Directive 2017/1279 required tomatoes originating from all third countries (outside the EU but including Canary Islands, Ceuta, Melilla and the French Overseas Departments) and pomegranates originating from countries of the African continent, Cape Verde, Saint Helena, Madagascar, La Reunion, Mauritius and Israel to be imported with a phytosanitary certificate. - Decision 2019/523 added controls on fruits of Kiwi, Papaya, Strawberry, Avocado, Rubus, Grapes and used agricultural machinery - Decision 2019/1598 added controls on maize. - In December 2019 the EU introduced new legislation pertaining to plants and plant products. Implementing Regulation (EU) 2019/2072 and its Annexes replaced the Annexes of Directive 2000/29/EC. Implementing Regulation (EU) 2019/2072 covers more plants and plant commodities than the previous legislation. Implementing Regulation (EU) 2019/2072 covers more plants and plant commodities than the previous legislation.
- There has been self-imposed bans from Thailand, Bangladesh and Vietnam.These can be very limited (for example to one exporter ) or more general.
New EU legislation came into effect on 14 December 2019: Implementing Regulation (EU) 2019/2072 and its Annexes replaced the Annexes of Directive 2000/29/EC. Implementing Regulation (EU) 2019/2072 covers more plants and plant commodities than the previous legislation however the impact of this legislative changes will not be seen until we have data for 2020.
19. Table 7: Number of controlled consignments, by commodity type, 2016-2020
| Year | Plants and planting material | Fruit | Vegetables | Other commodities | Total |
|---|---|---|---|---|---|
| 2016 | 28,802 | 47,542 | 24,357 | 2,476 | 103,177 |
| 2017 | 27,534 | 47,919 | 24,550 | 2,196 | 102,199 |
| 2018 | 27,948 | 55,280 | 23,478 | 2,474 | 109,180 |
| 2019 | 25,777 | 60,204 | 23,581 | 3,078 | 112,640 |
| 2020(b) | 22,043 | 79,286 | 41,651 | 3,131 | 146,111 |
| Value change 2016-2020 | -6,759 | 31,744 | 17,294 | 655 | 42,934 |
| Percentage change 2016-2020 | -23.5 | 66.8 | 71.0 | 26.5 | 41.6 |
Table 7 shows the number of controlled consignments notified to PHSI, by commodity type.From 1 January 2021 imports of high priority controlled material from Europe have had to be notified so the most recent data is not directly comparable to previous years.
-
Overall, the number of controlled consignments notified to PHSI increased by 41.6 per cent over the time period from 103,177 consignments in 2016 to 146,111 consignments in 2020. The largest increase was between 2019 and 2020 (+29.7 per cent) following the implementation of the new plant health controls regulation which expanded the range of plants and plant products covered.
-
Increases were seen for all commodity types other than plants and planting material which decreased by 23.5 per cent, from 28,802 consignments in 2016 to 22,043 consignments in 2020. The number of controlled consignments of fruit increased year-on-year leading to an overall increase of 66.8 per cent between 2016 and 2020.
-
Following the implementation of the new plant health controls regulation which expanded the range of plants and plant products covered, controlled commodities of fruit increased by 31.7 per cent while controlled consignments of vegetables increased by 76.6 per cent.
20. Chart 3: Controlled consignments by commodity type, 2016-2020
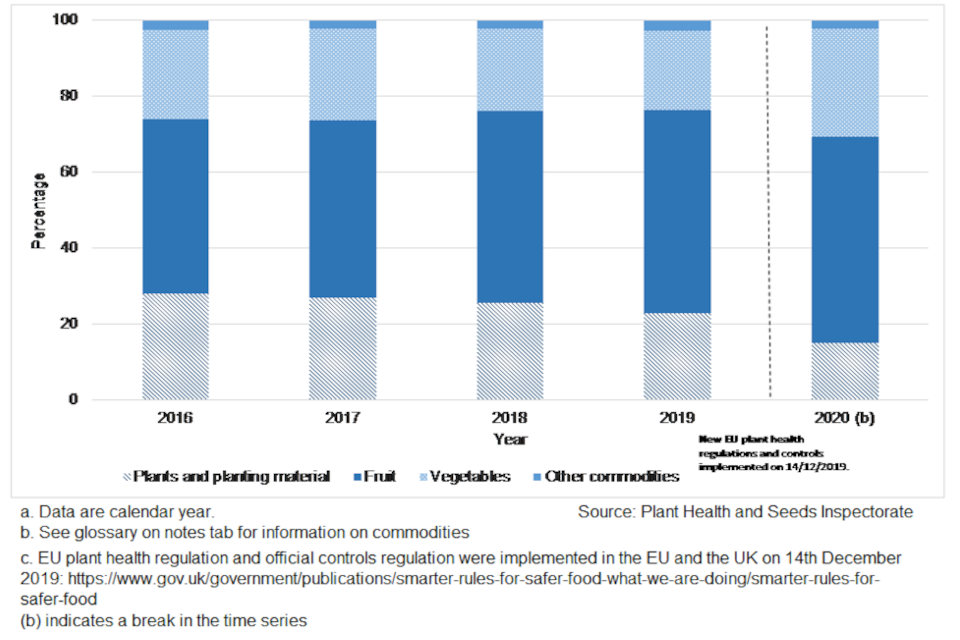
Chart 3 shows the proportion of controlled consignments notified to PHSI that constitute each commodity type (plants and planting material, fruit, vegetables, other commodities) for the years 2016 to 2020.
-
Controlled consignments of fruit have accounted for over half of all consignments since 2018, prior to this these consignments accounted for around 46-47 per cent of all consignments.
-
As a proportion of all consignments, plants and planting material has decreased year-on-year.
21. Table 8: Number of controlled consignments, by region of origin, 2016-2020
| Year | Africa | Americas | Asia | Europe (non-EU) | Oceania | Total |
|---|---|---|---|---|---|---|
| 2016 | 54,720 | 21,321 | 24,934 | 122 | 2,080 | 103,177 |
| 2017 | 54,998 | 21,354 | 23,361 | 121 | 2,365 | 102,199 |
| 2018 | 59,315 | 22,980 | 23,520 | 1,076 | 2,289 | 109,180 |
| 2019 | 60,099 | 26,241 | 22,990 | 1,279 | 2,031 | 112,640 |
| 2020(b) | 77,825 | 35,592 | 32,581 | 1,186 | 1,927 | 146,111 |
| Value change 2016-2020 | 23,105 | 11,271 | 7,647 | 1,064 | -153 | 42,934 |
| Percentage change 2016-2020 | 42.2 | 52.9 | 30.7 | 872.1 | -7.4 | 41.6 |
Table 8 shows the number of controlled consignments notified to PHSI, by region of origin.From 1 January 2021 imports of high priority controlled material from Europe have had to be notified so the most recent data is not directly comparable to previous years.
- The total number of controlled consignments from European (non-EU) countries were around 9 times higher in 2020 than in 2016. The largest single year increase followed the introduction of controls on tomatoes from non-EU countries as of January 2018.
- Controlled consignments originating in the Americas increased by 52.9 per cent between 2016 and 2020 with most of the increase occurring in the most recent two years.
- Following the implementation of the new plant health controls regulation, which expanded the range of plants and plant products covered, controlled consignments originating in Asia increased by 41.7 per cent between 2019 and 2020. Prior to this, there had been a broad downwards trend in the number of controlled consignments from Asia.
- Only Europe (non-EU countries) and Oceania saw a decrease in the number of controlled consignments notified between 2019 and 2020.
22. Chart 4: Controlled consignments by region of origin, 2016-2020
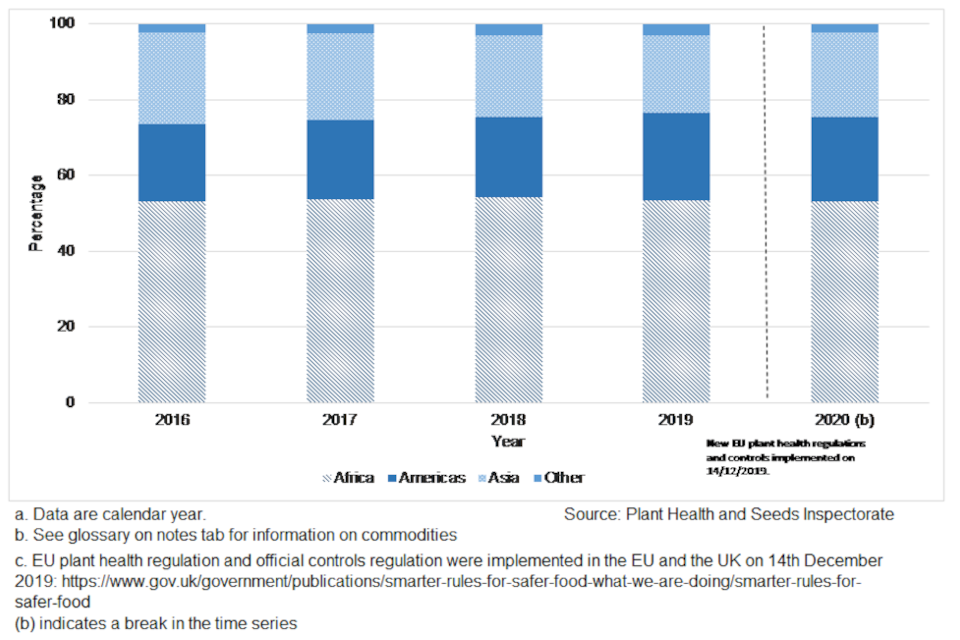
Chart 4 shows the proportion of controlled consignments notified to PHSI by their region of origin (Africa, Americas, Asia, Europe - non EU and Oceania) for the years 2016 to 2020.
- Controlled consignments originating in Africa represented over half of all controlled consignments in each year shown.
- The Americas and Asia were each responsible for around 22.3 per cent of all controlled consignments in 2020. The proportion of controlled consignments for Asia decreased slightly between 2016 and 2020 (-1.9 percentage points) but increased for the Americas (+1.6 percentage points) whilst the proportion of controlled consignments from ‘other’ areas was the same in 2020 and 2016.
23. Forestry Commission
The Forestry Commission (FC) are responsible for inspections of timber, including sawn timber, wood shavings, wood chips, sawdust and prefabricated buildings made of wood being imported to England, Scotland and Wales. The Forestry Commission are also responsible for inspections of wood packaging and controlled firewood[footnote 14] however these trades are not covered in this release.
Controlled forestry commodities are required to undergo full checks (100 per cent) thus the number of consignments is also the number of inspections.
It is important to note that changes in the number of consignments may be influenced by changes in trade patterns as well as by legislative changes. Factors which can contribute to changes in trade patterns include climate events, changes in market demand, social unrest or change, pest outbreaks etc. Controls may be applied to any number of countries where there is a pest risk but additionally countries may apply self-prohibition if they are aware of a pest issue in their country.
New EU legislation came into effect on 14 December 2019: Implementing Regulation (EU) 2019/2072 and its Annexes replaced the Annexes of Directive 2000/29/EC. Implementing Regulation (EU) 2019/2072 covers more plants and plant commodities than the previous legislation however the impact of this legislative changes will not be seen until we have data for 2020.
24. Chart 5a and 5b: Controlled consignments by timber type, 2015/16-2019/20
24.1 5a Number of consignments
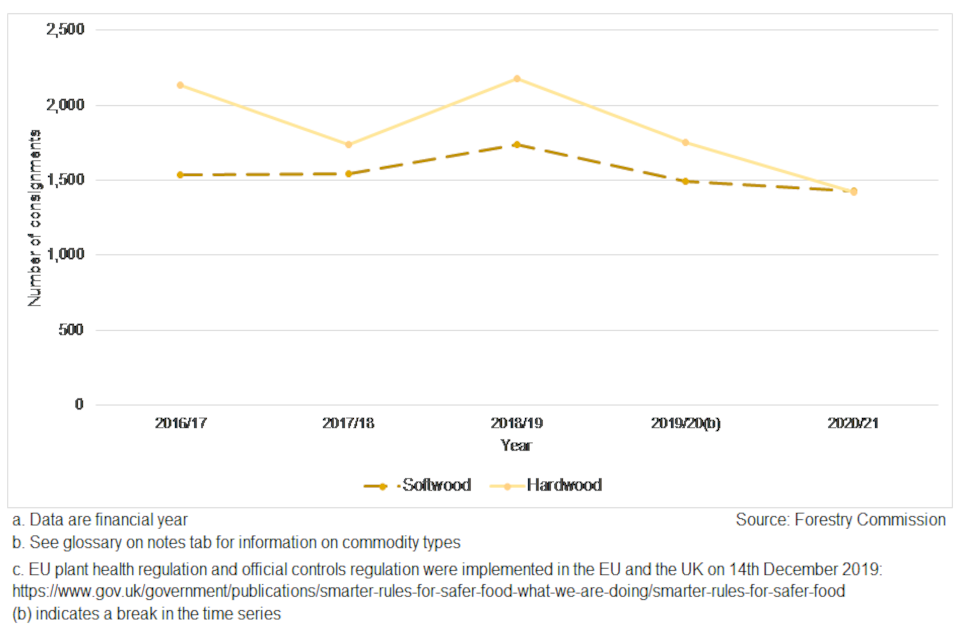
Chart 5a shows the number of controlled consignments notified to FC by timber type (softwood, hardwood) for the years 2016/17 to 2020/21.
24.2 5b. Volume of material
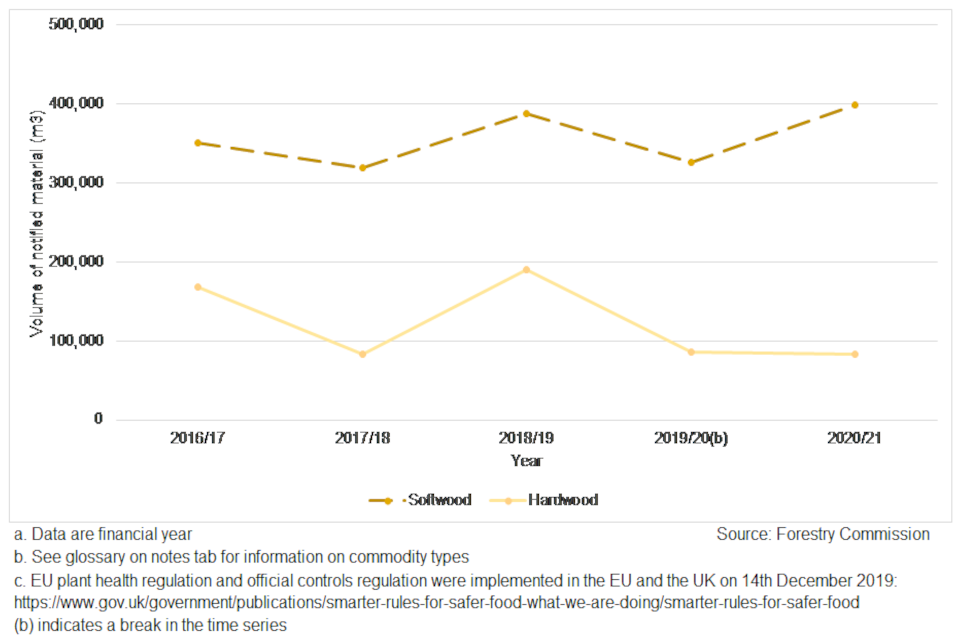
Chart 5b shows the volume of controlled material notified to FC by timber type (softwood, hardwood) for the years 2016/17 to 2020/21.
- The number of controlled consignments of hardwood fluctuated between 2016/17 and 2020/21 with the latest years number of consignments (1,420) the lowest of the time period. There have now been two consecutive years of decline in imports of hardwood consignments and in 2020/21 levels were similar to those of softwood consignments.
- The number of controlled consignments of softwood also decreased in 2020/21 to 1,429. consignments, the lowest level of the time period after reaching a high of 1,735 in 2018/19.
- The volume of softwood material in controlled consignments was more than double the volume of material in hardwood consignments in each year shown. In 2020/21 this difference was at its greatest (398,654m3 compared to 83,556m3 of hardwood material) despite the number of softwood and hardwood consignments being at similar levels.
25. Table 9: Controlled consignments of softwood, by region of origin, 2016/17-2020/21
| 2016/17 | 2017/18 | 2018/19 | 2019/20 | 2020/21 | Value change 2016/17-2020/21 | Percentage change 2016/17-2020/21 | |
|---|---|---|---|---|---|---|---|
| Number of consignments | |||||||
| Africa | 0 | 0 | 4 | 8 | 4 | 4 | z |
| Asia | 8 | 15 | 13 | 17 | 13 | 5 | 62.5 |
| Oceania | 13 | 21 | 49 | 63 | 27 | 14 | 107.7 |
| Central and South America | 32 | 32 | 41 | 41 | 28 | -4 | -12.5 |
| North America | 1,030 | 1,108 | 1,036 | 860 | 815 | -215 | -20.9 |
| Europe (non-EU) | 453 | 367 | 592 | 503 | 542 | 89 | 19.6 |
| Total | 1,536 | 1,543 | 1,735 | 1,492 | 1,429 | -107 | -7.0 |
| Volume of notified product (m3) | |||||||
| Africa | 0 | 0 | 200 | 400 | 159 | 159 | z |
| Asia | 278 | 532 | 392 | 1,128 | 986 | 708 | 254.7 |
| Oceania | 529 | 876 | 2,629 | 2,997 | 1,266 | 737 | 139.3 |
| Central and South America | 3,259 | 2,574 | 4,162 | 3,472 | 2,634 | -625 | -19.2 |
| North America | 59,684 | 58,041 | 53,315 | 56,189 | 42,484 | -17,200 | -28.8 |
| Europe (non-EU) | 287,685 | 257,789 | 326,675 | 262,494 | 351,125 | 63,440 | 22.1 |
| Total | 351,435 | 319,812 | 387,373 | 326,680 | 398,654 | 47,219 | 13.4 |
Table 9 shows the number of controlled consignments of softwood and the volume of material notified to FC, by region of origin.From 1 January 2021 imports of high priority controlled material from Europe have had to be notified so the most recent data is not directly comparable to previous years.
- Whilst the number of softwood consignments decreased over the time period 2016/17 to 2020/21 (-7.0 per cent), the volume of material associated with these consignments increased (+13.4 per cent).
- Both the number of consignments and the volume of material imported from the Americas (north, central, and south) decreased over the time period in contrast to all of the other regions shown.
- The number of softwood consignments imported from Asia fluctuated between 2016/17 and 2020/21, peaking at 17 in 2019/20 and falling to 13 in 2020/21 but still notably higher than 8 in 2016/17. Overall softwood consignments from Asia increased by 62.5 per cent between 2016/17 and 2020/21 whilst the volume of softwood material more than trebled, from 278m3 to 986m3.
- The number of softwood consignments imported from Europe stood at 542 in 2020/21, lower than the peak of 592 in 2018/19 while the volume of material imported reached a high of 351,125m3.
26. Chart 6a and 6b: Softwood consignments and volume, by region of origin, 2016/17-2020/21
26.1 6a Number of consignments
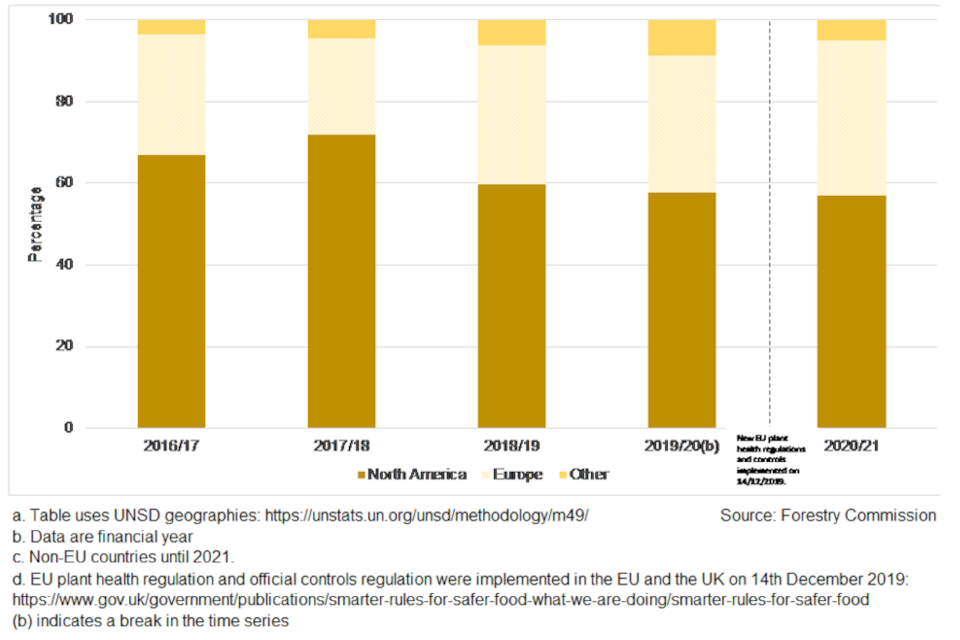
Chart 6a shows the proportion of controlled softwood consignments notified to FC by the region of origin (North America, Europe - non EU and Other) for the years 2016/17 to 2020/21.
26.2 6b. Volume of material
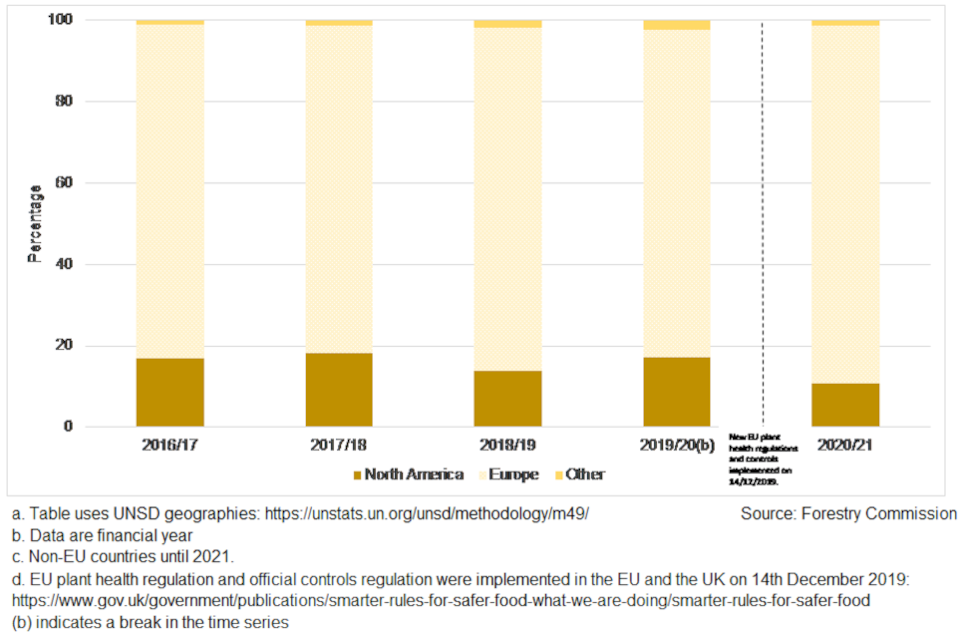
Chart 6b shows the proportion of controlled softwood material notified to FC by the region of origin (North America, Europe - non EU and Other) for the years 2016/17 to 2020/21.
- There are more consignments of softwood arriving from North America than Europe, but the European consignments are much bigger in size. In 2020/21 North America was the origin of over half of all consignments of softwood (57.0 per cent) whilst Europe accounted for over a third (37.9 per cent). This contrasts with the volume of softwood material where 88.1 per cent originated in Europe in 2020/21 compared to 10.7 per cent from North America.
- The proportion of all controlled softwood consignments that originated in North America decreased by 10 percentage points between 2016/17 and 2020/21 whilst the volume of softwood material decreased by 6.3 percentage points.
- In contrast, the proportion of all controlled softwood consignments that originated in Europe increased by 8.4 percentage points between 2016/17 and 2020/21 whilst the volume of softwood material increased by 6.2 percentage points.
27. Table 10: Controlled consignments of hardwood, by region of origin, 2016/17-2020/21
| 2016/17 | 2017/18 | 2018/19 | 2019/20 | 2020/21 | Value change 2016/17-2020/21 | Percentage change 2016/17-2020/21 | |
|---|---|---|---|---|---|---|---|
| Number of consignments | |||||||
| North America | 2,137 | 1,737 | 2,164 | 1,734 | 1,411 | -726 | -34.0 |
| Europe (non-EU) | 0 | c | 11 | 20 | 9 | 9 | z |
| Total | 2,137 | 1,737 | 2,175 | 1,754 | 1,420 | -717 | -33.6 |
| Volume of notified product (m3) | |||||||
| North America | 168,403 | 83,472 | 189,544 | 84,980 | 83,113 | -85,290 | -50.6 |
| Europe (non-EU) | 0 | c | 793 | 1,253 | 443 | 443 | z |
| Total | 168,403 | 83,472 | 190,337 | 86,233 | 83,556 | -84,847 | -50.4 |
Table 10 shows the number of controlled consignments of hardwood and the volume of material, notified to FC, by region of origin.From 1 January 2021 imports of high priority controlled material from Europe have had to be notified so the most recent data is not directly comparable to previous years.
- Over 98 per cent of hardwood consignments and associated material was imported from North America in each year shown.
- The total number of hardwood consignments fell from 2,137 to 1,420 (-33.6 per cent) between 2016/17 and 2020/21 whilst the volume of controlled hardwood halved from 168,403m3 to 83,556m3.
28. Table 11: Controlled consignments of oak and ash timber, 2016/17-2020/21
| 2016/17 | 2017/18 | 2018/19 | 2019/20 | 2020/21 | Value change 2016/17-2020/21 | Percentage change 2016/17-2020/21 | |
|---|---|---|---|---|---|---|---|
| Number of consignments | |||||||
| Ash | 329 | 285 | 335 | 240 | 131 | -198 | -60.2 |
| Oak | 1,681 | 1,330 | 1,562 | 1,227 | 1,003 | -678 | -40.3 |
| Total | 2,010 | 1,615 | 1,897 | 1,467 | 1,134 | -876 | -43.6 |
| Volume of notified product (m3) | |||||||
| Ash | 13,538 | 10,537 | 11,531 | 22,128 | 4,589 | -8,949 | -66.1 |
| Oak | 109,695 | 41,524 | 140,852 | 38,330 | 68,310 | -41,385 | -37.7 |
| Total | 123,233 | 52,061 | 152,383 | 60,458 | 72,899 | -50,334 | -40.8 |
Ash originating in Canada, China, Japan, Mongolia, North Korea, South Korea, Russia, Taiwan and USA and Oak (Quercus suber) originating in the USA are both controlled and account for the majority of controlled hardwood imports.
- Proportionally ash had larger decreases, in both the number of controlled consignments and the volume of softwood material, than oak however in terms of actual numbers oak saw larger decreases.
- Oak and Ash accounted for 79.9 per cent of all controlled hardwood consignments in 2020/21, having decreased from 94.1 per cent in 2016/17. These two species accounted for 87.2 per cent of the volume of controlled hardwood in 2020/21, an increase from 73.2 per cent in 2016/17.
- Oak accounted for 88.4 per cent of controlled consignments of ash and oak, and 93.7 per cent of the volume of material in 2020/21. This was an increase of between 4 and 5 percentage points for oak in terms of both the proportion of consignments and volume since 2016/17.
29. Glossary
Commodity:
A type of plant, plant product, or other article being moved for trade or other purpose [FAO, 1990; revised ICPM, 2001]
Consignment:
A quantity of plants, plant products or other articles being moved from one country to another and covered, when required, by a single phytosanitary certificate (a consignment may be composed of one or more commodities or lots) [FAO, 1990; revised ICPM, 2001]. For PHSI data a consignment is a commodity type declared on a phytosanitary certificate. Some phytosanitary certificates will cover more than one commodity type and so the number of consignments declared will be more than the number of phytosanitary certificates.
Controlled plant products:
Plants and plant commodities which are required to undergo checks for pest and disease on crossing a customs border. For countries within the European Union (EU) this means upon entry to the EU while for countries.
Country of origin:
Country where the plants were grown [FAO, 1990; revised CEPM, 1996; CEPM, 1999]
Customs declaration:
An official document that lists and gives details of goods that are being imported or exported. In legal terms, a customs declaration is the act whereby a person indicates the wish to place goods under a given customs procedure. This legal procedure is described in the Union Customs Code (UCC) (Articles 5 (12) and 158 to 187).
Exports (HMRC trade data):
The country of destination as declared at the time of export. However, where goods can be traded while in transit (e.g. grain and crude oil), this may not necessarily be the final destination of the goods.
Food and crops:
Commodities traded for the primary purpose of human consumption.
Forestry:
Timber and wood commodities but not live trees.
Fruit:
The sweet and fleshy product of a tree or other plant that contains seed and can be eaten as food.
Hardwood:
Timber from broadleaved trees.
Imports (HMRC trade data):28
The country from which the goods were originally dispatched to the UK without any commercial transaction in any intermediate country (either with or without breaking bulk in the course of transport). This is not necessarily the country of origin, manufacture or the last country from which the goods were shipped to the UK.
Inspection:
Official visual examination of plants, plant products or other regulated articles to determine if pests are present or to determine compliance with phytosanitary regulations [FAO, 1990; revised FAO, 1995; formerly “inspect”].
Non-EU European countries:
Countries outside of the European Union but geographically part of Europe.
‘Other’ commodities:
Plants and parts of plants (including seeds and fruits) used primarily in perfumery or pharmacy or for insecticidal, fungicidal or similar purposes.
Phytosanitary certificate:
An official paper document or its official electronic equivalent, consistent with the model certificates of the IPPC, attesting that a consignment meets phytosanitary import requirements [FAO, 1990; revised CPM, 2012]
Plants and plant commodities:
Goods including plants, trees, bulbs, seeds, fruit, vegetables and timber. Commodities are included if they are (1) raw plant products or (2) simply processed, i.e., processed in a manner that would not, in theory, remove the pest and disease risk.
Plants and planting material:
Live or dormant plants, seeds, bulbs or tubers of plants and trees and cut flowers.
Simple processing:
Simple processing can include peeling, grinding, chopping and debarking but excludes cooking, fermenting and preservation in liquid. For further information please see International Standards for Phytosanitary Measures; ISPM No. 32; Categorisation of commodities according to their pest risk (2009).
Softwood:
Timber from coniferous trees.
Vegetable:
A plant or part of a plant used as food, such as a cabbage, potato, turnip, or bean.
-
Includes raw products and those that can be defined as ‘simply processed’. Please see the glossary at the end of this document and the associated quality and methodology report for more information. ↩
-
Tree health legislation and [Plant health controls[(https://www.gov.uk/guidance/plant-health-controls). ↩
-
Plant Health is devolved thus Scotland carries out its own plant health inspections. ↩
-
Information on methodology and quality for HMRC overseas trade statistics can be accessed at: HMRC trade statistics - policies and methodologies ↩
-
Food Standards Agency - Multi-Annual National Control Plan ↩
-
EU reduced frequency checks]( https://ec.europa.eu/food/plant/plant_health_biosecurity/non_eu_trade/less_frequent_checks_en) ↩