Personal Independence Payment decisions by health assessment mode
Published 15 September 2026
Applies to England, Scotland and Wales

© Crown copyright 2026
This publication is licensed under the terms of the Open Government Licence v3.0 except where otherwise stated. To view this licence, visit nationalarchives.gov.uk/doc/open-government-licence/version/3 or write to the Information Policy Team, The National Archives, Kew, London TW9 4DU, or email: psi@nationalarchives.gov.uk.
Where we have identified any third party copyright information you will need to obtain permission from the copyright holders concerned.
This publication is available at https://www.gov.uk/government/statistics/personal-independence-payment-decision-based-mode-of-assessment-statistics-april-2019-to-march-2026/personal-independence-payment-decisions-by-health-assessment-mode
Introduction
This publication provides information in relation to the mode used to conduct a health assessment for Personal Independence Payment (PIP), the benefit decision taken following the assessment, and the age, gender and primary medical condition of the claimants undertaking the assessment.
Background
Before 2020, the majority of claimants undertaking a PIP health assessment were assessed via a face-to-face consultation, with a small proportion of recommendations being made ‘on paper’. Where there is sufficient available evidence, Personal Independence Payment assessments may be carried out via a paper-based assessment, without the need for a formal consultation. Health professionals (HPs) can also seek additional information from claimants, GPs or other supporting professionals whose details are provided, where this might help them complete a paper-based assessment. Before the introduction of alternative remote channels (telephone and video), if a consultation was required, suppliers would undertake a face-to-face consultation either in an assessment centre, or at the claimant’s place of residence.
During the COVID-19 pandemic, the Department for Work and Pensions (DWP) designed and implemented a multi-channel delivery system of health assessment consultations to address the swift demand for remote methods of performing consultations. Research on the impact of the introduction of remote channels on PIP, Universal Credit (UC) Health and Employment Support Allowance (ESA) claimants showed that claimants’ perception of suitability of assessment channel was influenced by award outcome and their interaction with the assessor, rather than by the assessment channel specifically[footnote 1].
In all cases the decision on benefit entitlement is made by a DWP Case Manager, not by the health professional undertaking the assessment. Decisions may be amended as a result of a mandatory reconsideration or appeal.
Further quantitative research on initial health assessments completed between May 2022 and March 2023 showed no substantial benefit outcome differences between claimants allocated to a remote assessment and those scheduled for a face-to-face assessment.
This ad hoc release provides further information on claimants attending remote and face-to-face health assessments and their benefit outcomes, including the breakdown of the mode of assessment of all PIP claims between April 2019 and March 2026; and the gender, age and conditions reported by these claimants by the assessment mode.
Methodology
Information on PIP claims, including mode of assessment, health condition, and claimant characteristics are obtained from the PIP Atomic Data Store (ADS), an extract from the PIP administrative computer system. In addition to the claims decided following a consultation with a health professional, some claims may be assessed by a health professional based on evidence submitted (Paper-Based) or solely by a DWP Case Manager (In-House). In all cases the benefit decision is made by a DWP Case Manager.
For claims where the relevant information is not available or cannot be correctly matched to the main claim details the assessment mode will be reported as “Unknown”. Claims which did not complete a PIP assessment are excluded from this analysis, as are PIP claims processed under Special Rules for End of Life. The data shows initial decisions only, not as amended following a mandatory reconsideration or appeal.
Data on consultation channel prior to April 2022 is not available as the proportion of cases where the assessment channel is recorded falls below the required threshold for publication. The face-to-face category includes both assessments conducted in a DWP assessment centre and home visits. Remote channels include consultations conducted over the telephone and those conducted by video call. The period reported includes a change in assessment provider contracts, which occurred in September 2024, so some variation in the figures may be apparent around that time.
Data is presented by date of the final DWP benefit decision. Because of the time taken to make a benefit decision following an assessment, the breakdown of decisions by assessment mode typically lags the mix of assessments undertaken by assessment providers.
Only a single health condition is available in the PIP-ADS, recorded as primary medical condition. Claimants often have complex health issues, and the majority have more than one health condition, but only one is made available for analysis, which should be the predominant condition but may not be in all cases. Medical condition is based on evidence recorded during the assessment, but this in itself does not confer entitlement to PIP.
Results
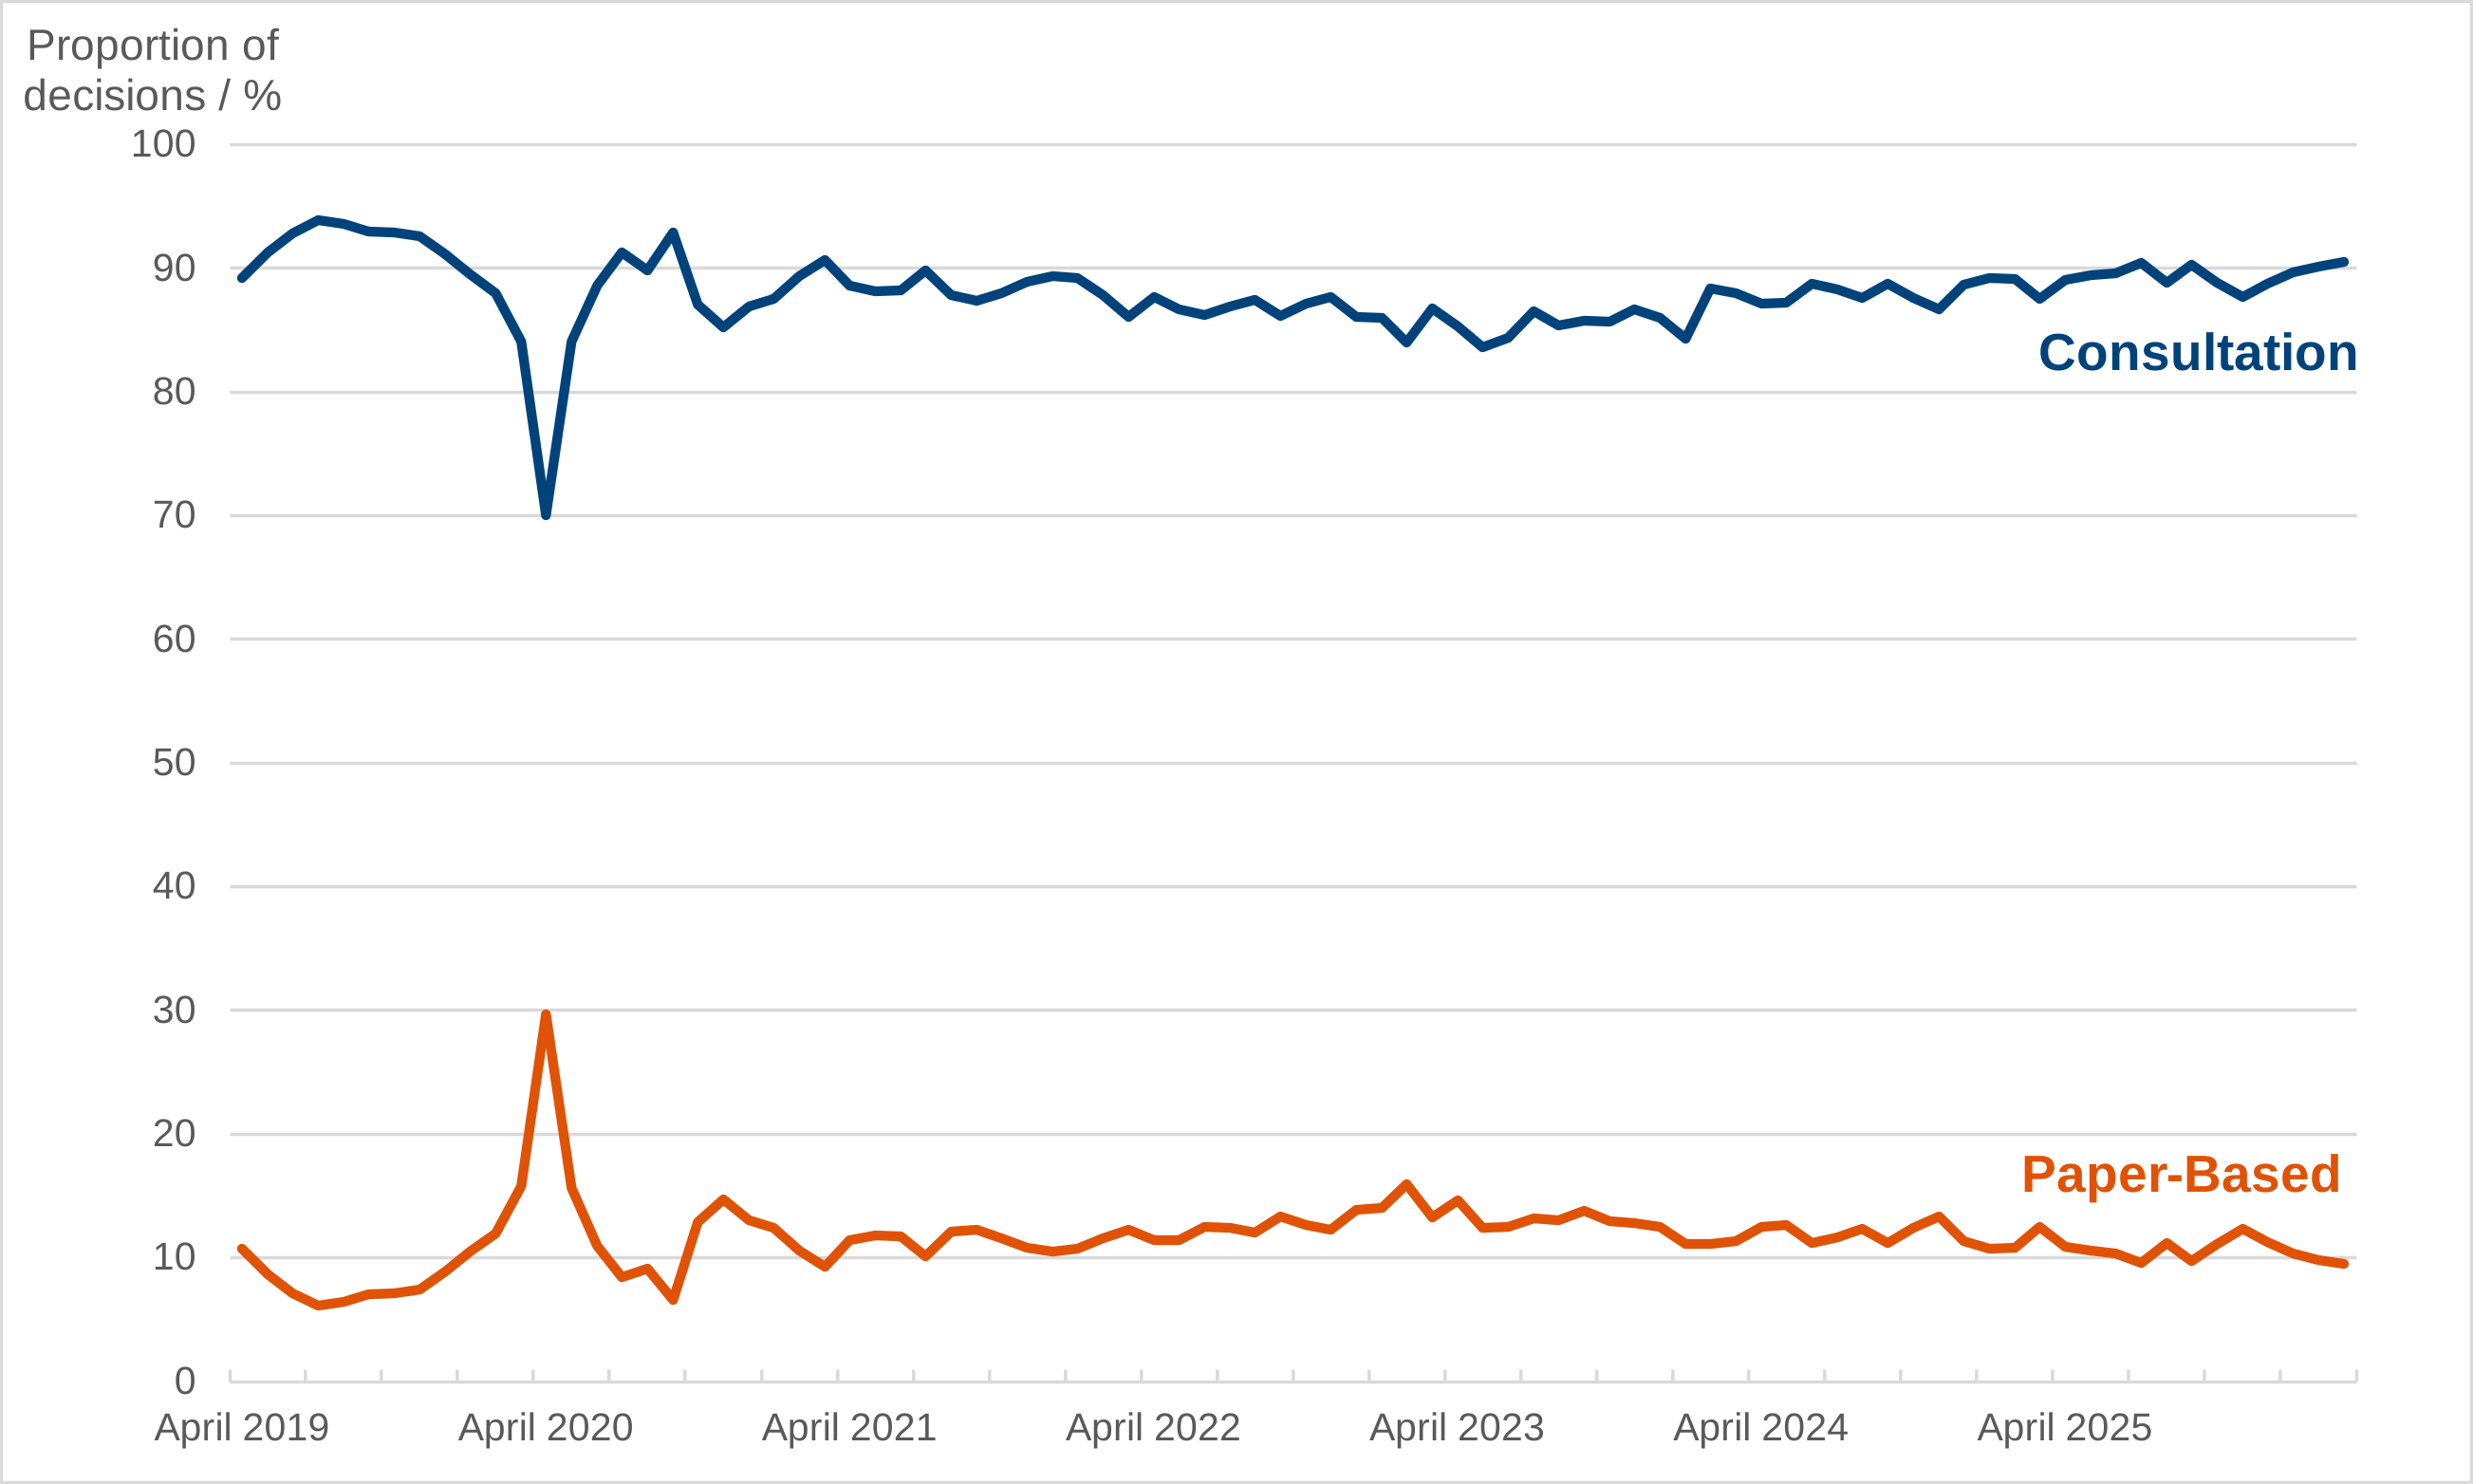
Figure 1: Monthly PIP new claim decisions by assessment mode, April 2019 to March 2026
Source: PIP-Atomic Data Store
Figure 1 is a line chart showing monthly assessment mode breakdown for PIP new claims decisions between April 2019 and March 2026. Consultations accounted for the majority of assessments with the level between 85% and 90% across most of the period, with more variable levels in early 2020 as the COVID-19 pandemic began. Paper-based assessments account for the remainder with levels typically between 10% and 15%.
The significant majority of PIP New Claims decisions have been made following a consultation with a health professional over the period reported. The proportion of consultations has typically been 85 to 90% for new claims, especially over more recent periods. Larger fluctuations in the proportion were seen in early 2020 as the pandemic began and consultations had to be temporarily suspended until the new approaches were developed.
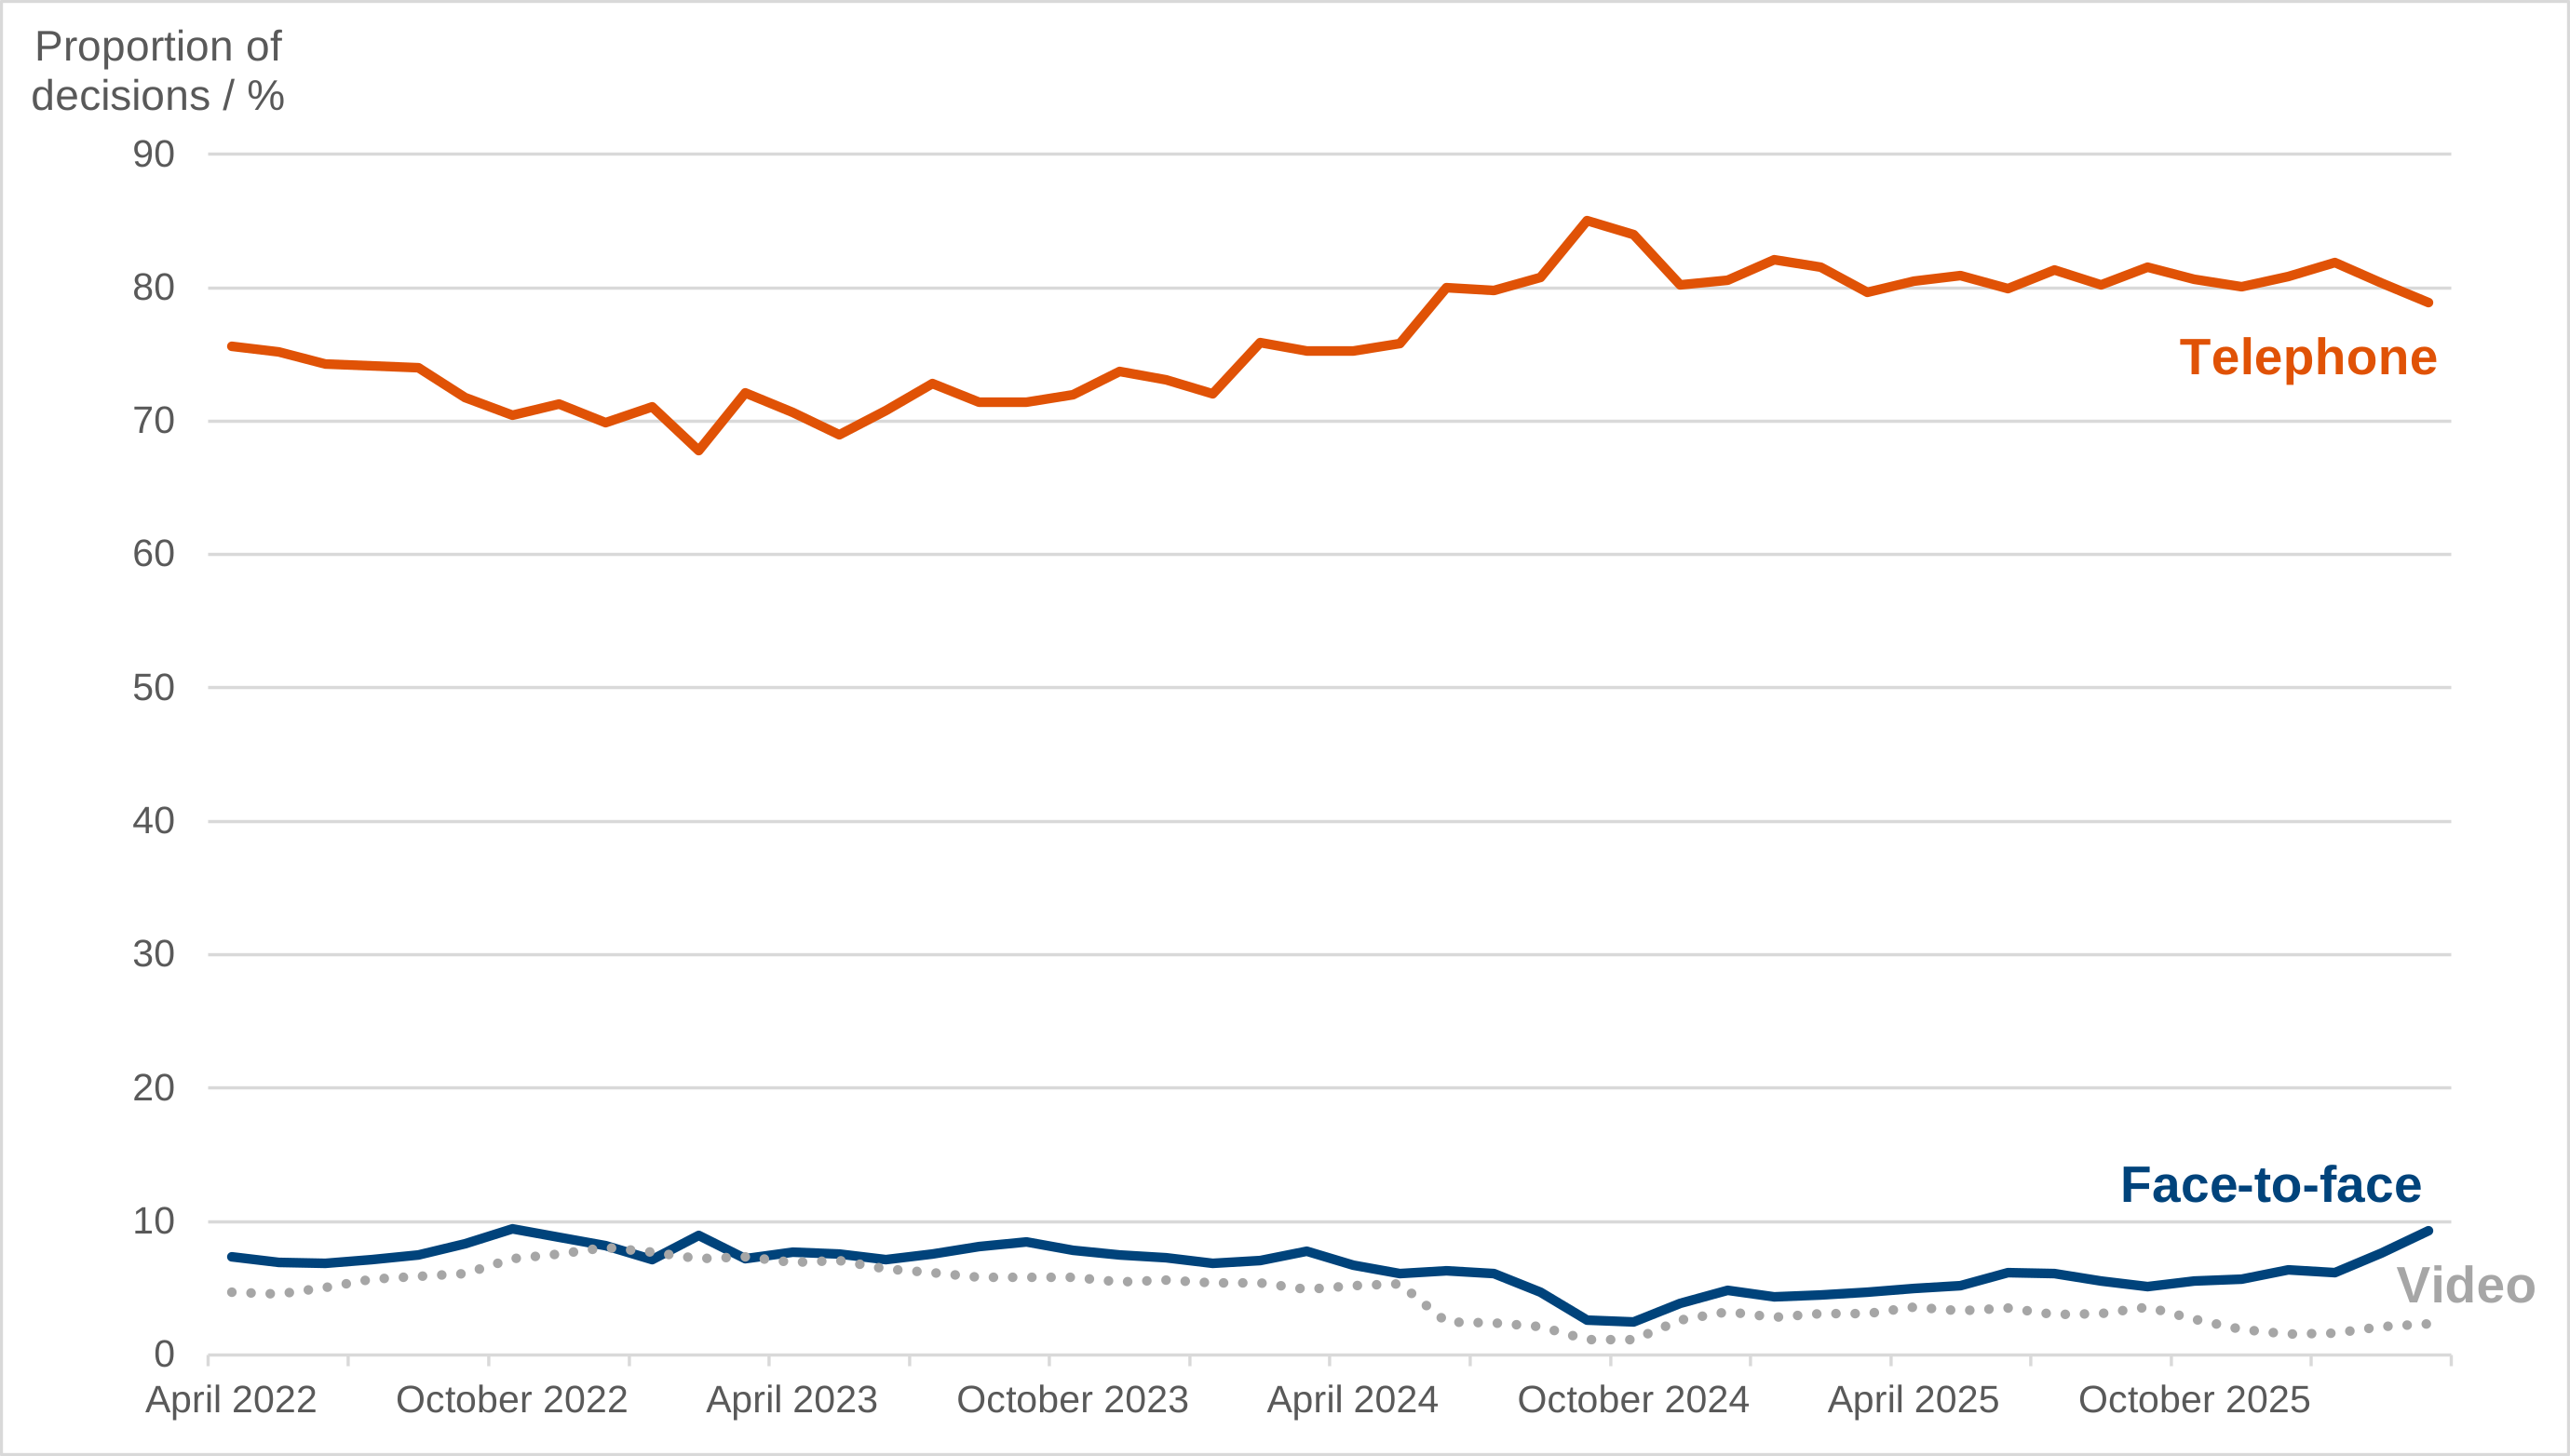
Figure 2: Monthly PIP new claim decisions by consultation channel, April 2022 to March 2026
Source: PIP-Atomic Data Store
Figure 2 is a line chart showing monthly consultation channel breakdown for PIP new claims decisions between April 2022 and March 2026. The majority of consultations were conducted by telephone with the level varying between 70% and 85%, while face-to-face consultations have accounted for between 5% and 10% for most of the period with lower levels seen in autumn 2024 when assessment provider contracts changed. Video consultations were at similar levels to face-to-face for the first part of the period shown but lower beyond that at levels of 2% to 4%.
Across the period where consultation type data is available telephone was the dominant channel, with 70% to 85% of all decisions following this mode of assessment. Face-to-face consultations have comprised around 5% to 10% of all decisions, with some variation, but a steady increase since its low point in autumn 2024, just after the change to the new assessment contracts.
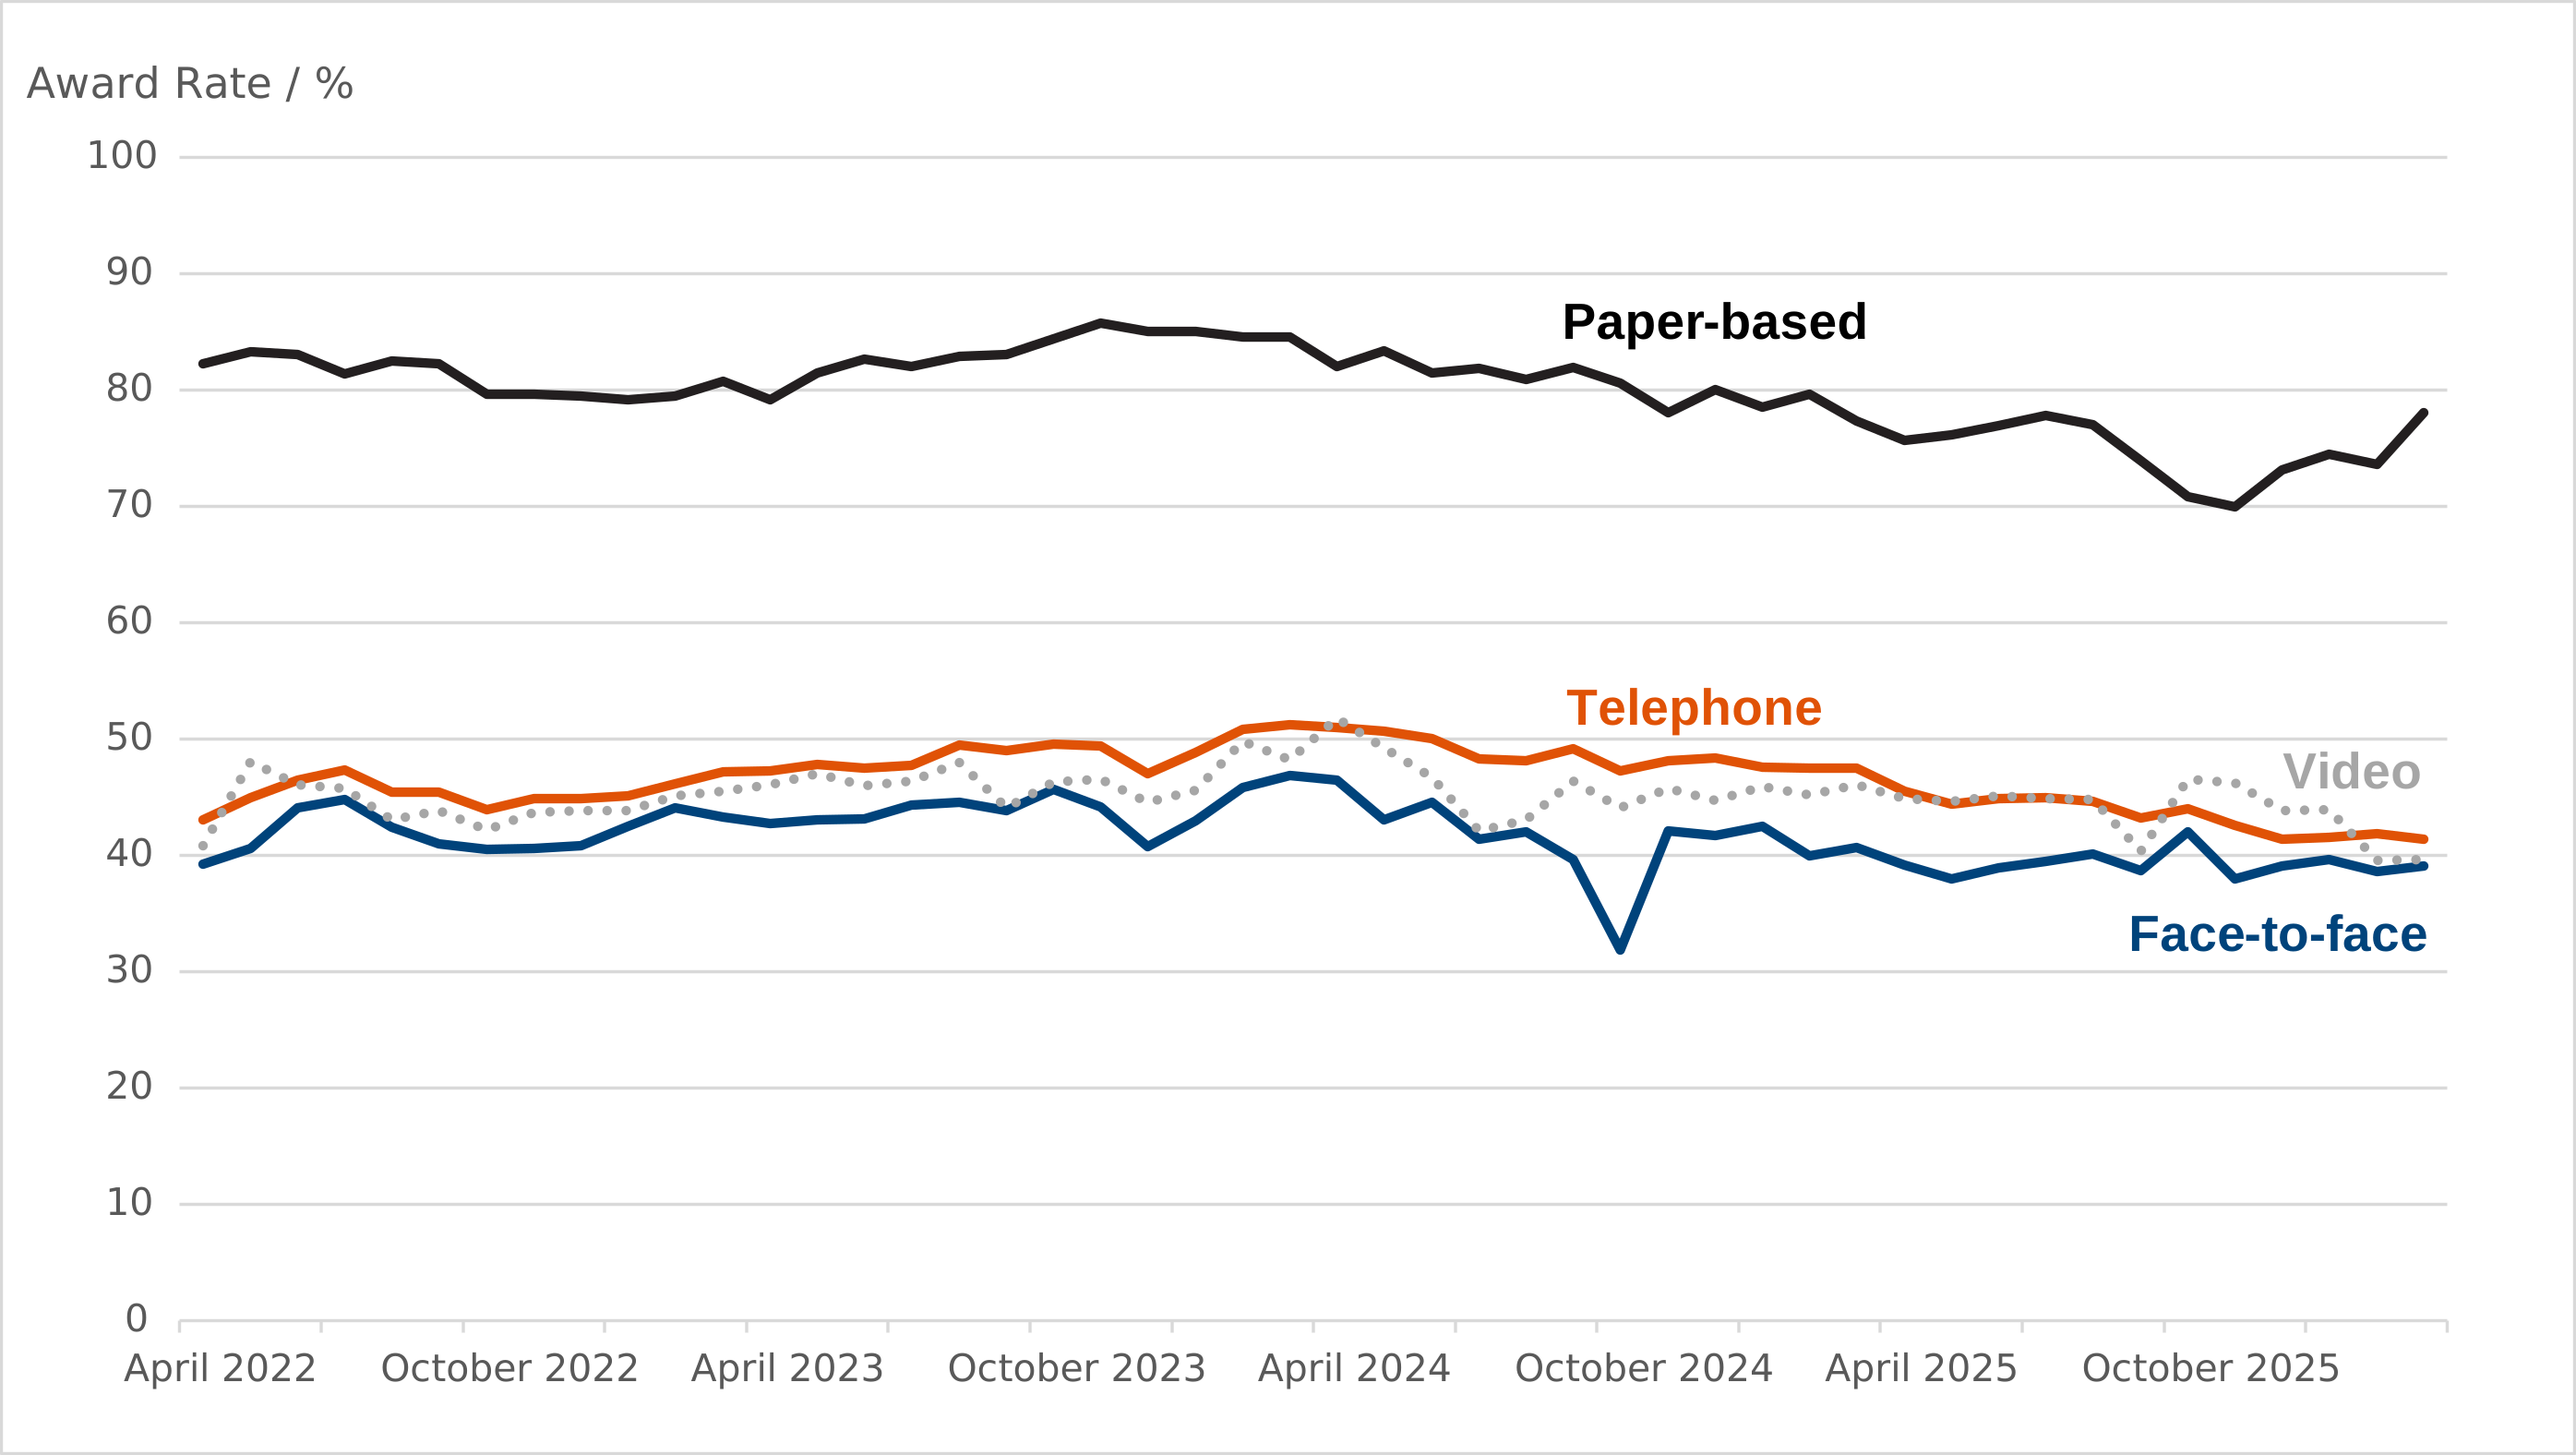
Figure 3: Monthly PIP new claim award rate by assessment mode, April 2022 to March 2026
Source: PIP-Atomic Data Store
Figure 3 is a line chart showing monthly PIP new claims award rates by assessment mode between April 2022 and March 2026. Telephone and video assessments have similar award rates and are consistently higher than face-to-face award rates by up to 5%. Paper-based assessments have significantly higher award rates than other modes.
Telephone assessments have consistently higher award rates than face-to-face assessments, typically by 4% to 5%. Video assessments have award rates similar to those of telephone assessments though the figures are more volatile due to lower volumes in this channel. Paper-based assessments have significantly higher award rates than the consultation assessments.
Because different types of claimant are more likely to choose different modes of assessment, it is likely that at least some of the difference between different modes of assessment is due to differences in composition, and not as a result of the mode itself. This is most obvious with paper-based assessments, where the functional impairment and entitlement is much clearer from the paper documentation, and therefore likely to be predominantly claimants with more severe impairments.
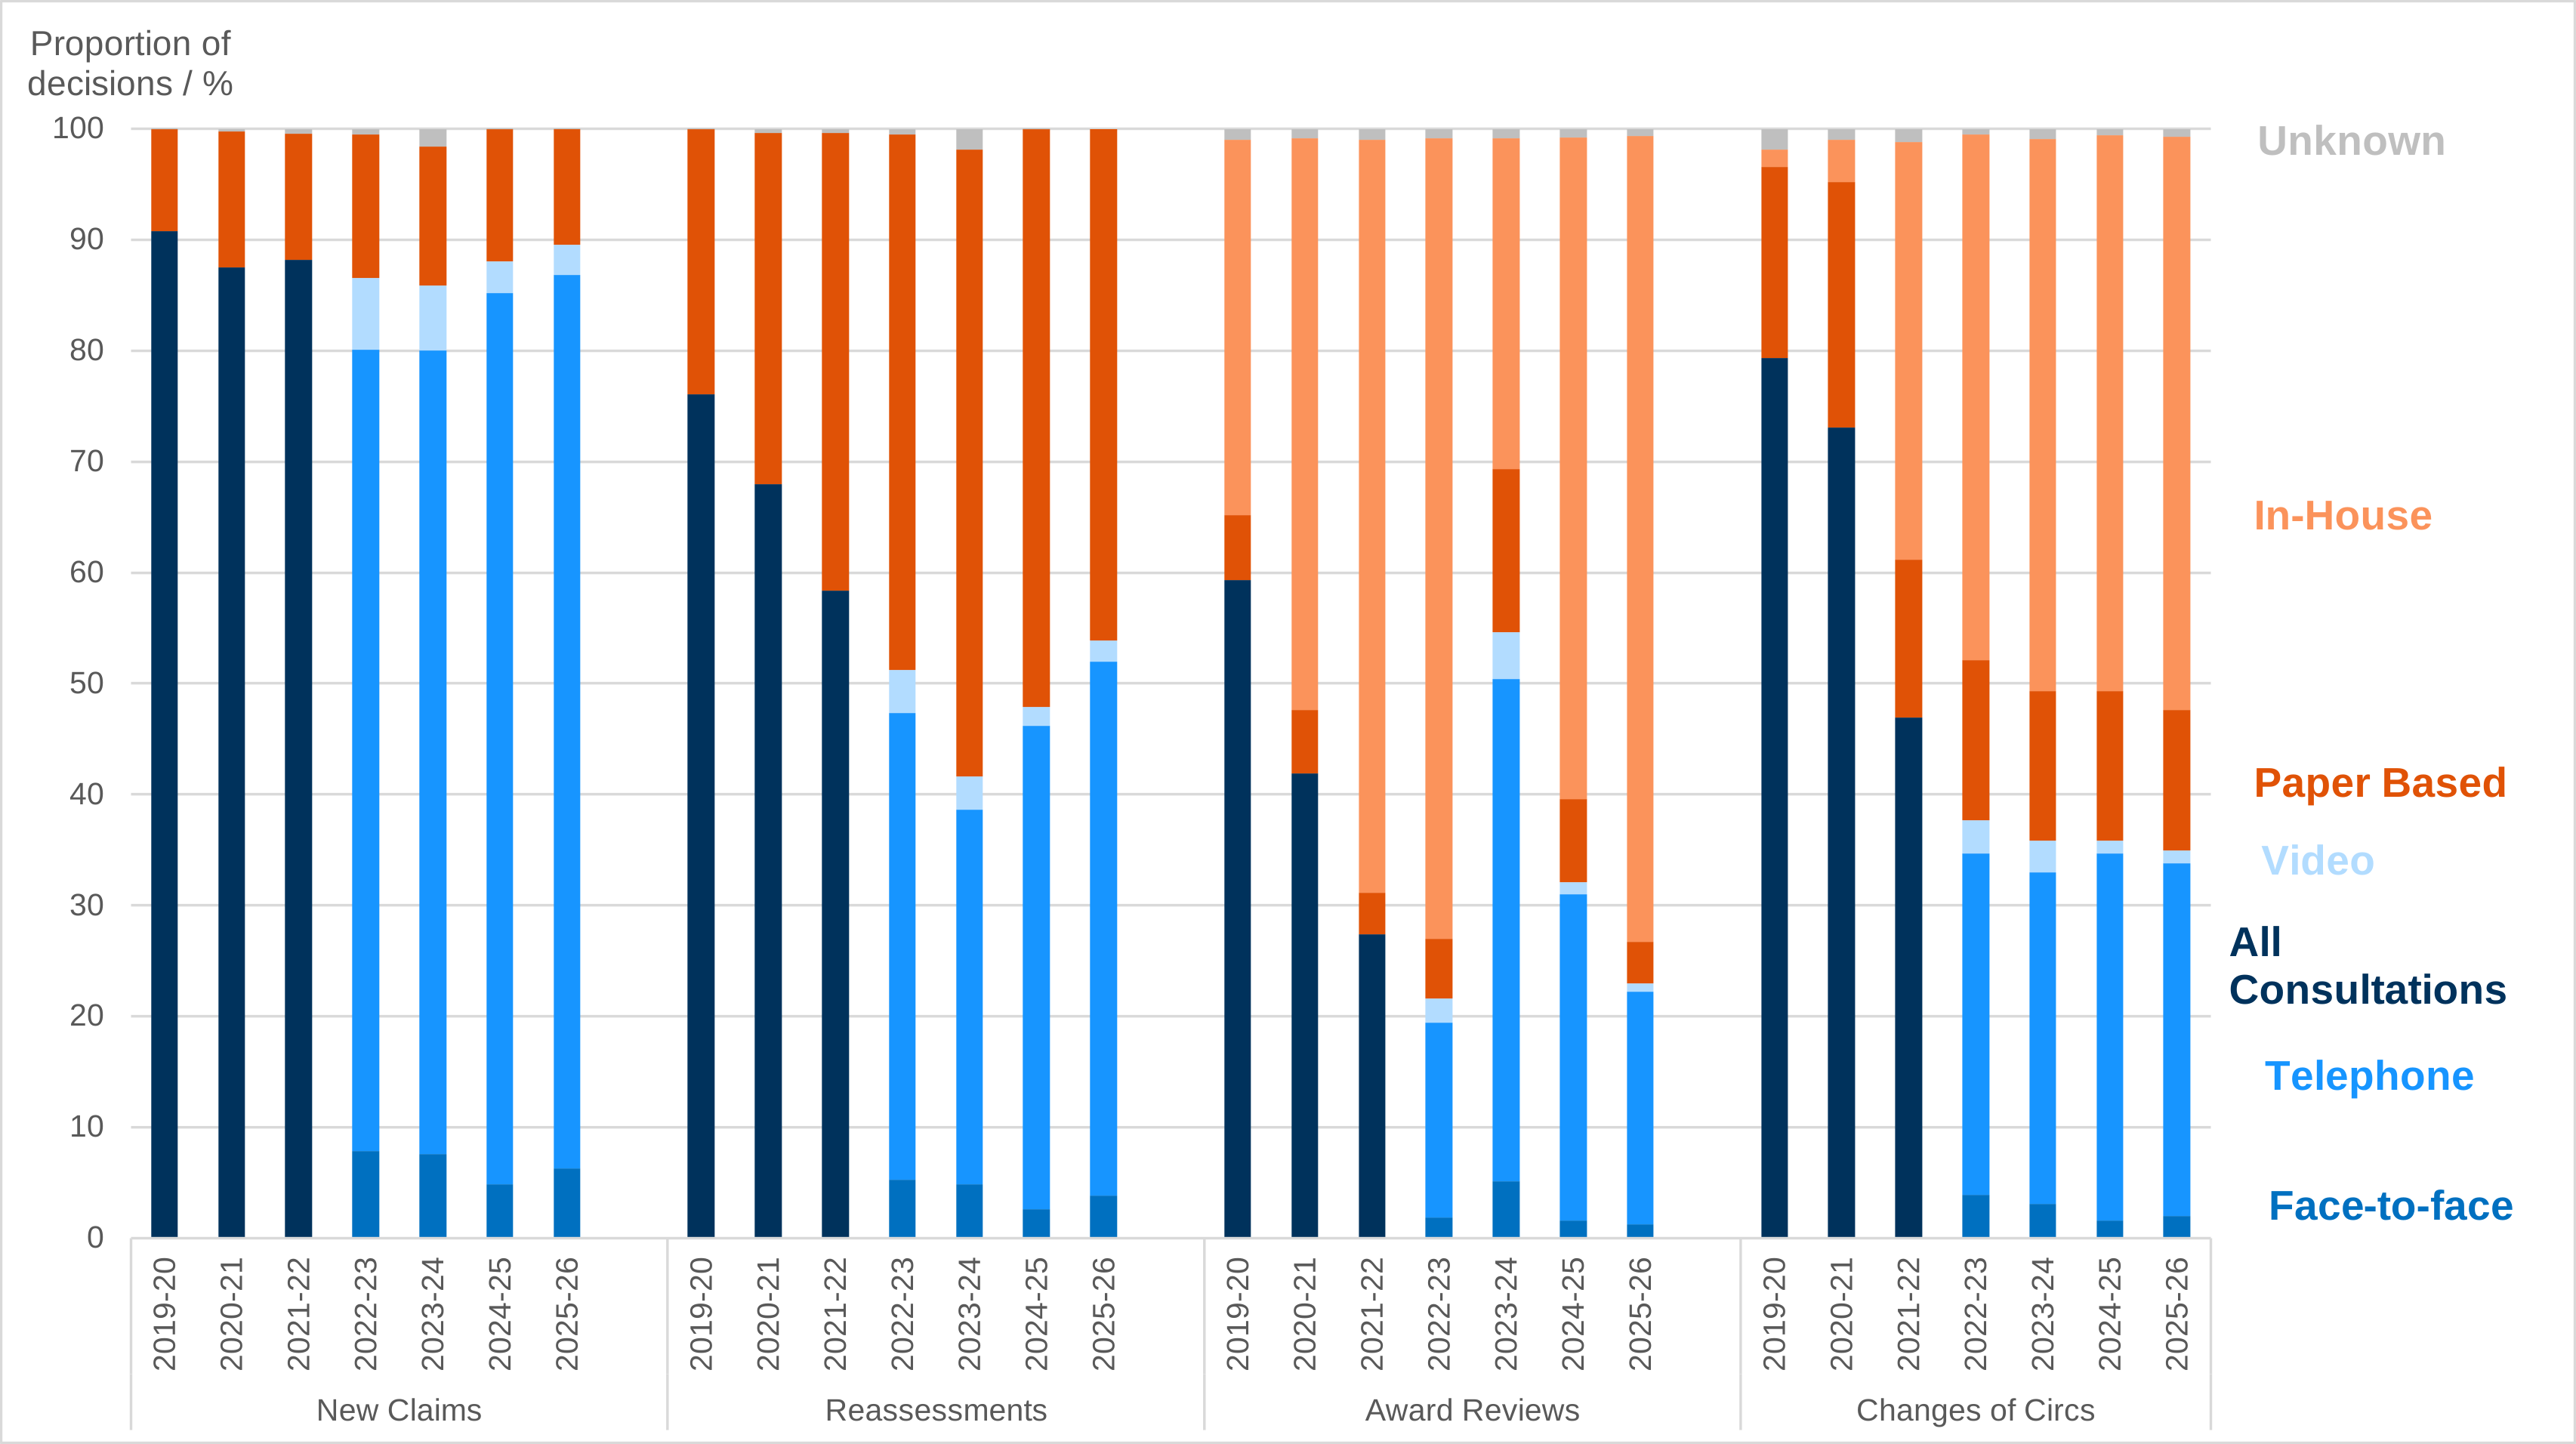
Figure 4: PIP decisions by decision type and assessment mode, financial year 2019 to 2020 to 2025 to 2026
Source: PIP-Atomic Data Store
Figure 4 is a series of stacked bar charts showing how the distribution of assessment modes changed between financial years 2019 to 2020 and 2025 to 2026 for PIP new claims, reassessments, award reviews and changes of circumstance. For reassessments paper-based assessments increased from 25% to 65% of decisions in 2023 to 2024 before decreasing to 46% in 2025 to 2026. For award reviews the level of in-house decisions has varied from 34% in 2019 to 2020 to 73% in 2025 to 2026 with several rises and falls in between. Changes of circumstance saw the level of in-house decisions change from 4% in 2020 to 2021 to 38% in 2021 to 2022, and then a gradual increase to 52% in 2025 to 2026. In each case, telephone was the dominant channel for consultations.
Reassessments from Disability Living Allowance (DLA) to PIP have always involved a higher proportion of paper-based assessments than new claims. This proportion increased over the period presented until financial year 2023 to 2024 and has since reduced slightly to be comparable to the proportion of consultation decisions in the most recent data. Over the period considered the majority of reassessments were child DLA claimants reaching 16 and migrating to PIP. Where consultation channel data is available telephone has been the dominant channel with between 30% and 50% of all decisions, varying mainly as the level of paper-based decisions also changes. Face-to-face consultations have represented 3% to 7% of all decisions, with a lower level around the change of provider contracts in September 2024.
Award Reviews regularly have a significant proportion of decisions made in house without an assessment by a healthcare professional, reflecting the fact that an assessment was made previously and little may have changed. Where this share dipped telephone consultations increased the most, while face-to-face consultations typically account for 1% to 2% of award review decisions.
Change of circumstance decisions have seen a transition from majority consultations in 2019 to 2020 to around 50% in-house decisions, with the transition starting in 2021. Telephone was the dominant channel for change of circumstance consultations over the period studied, with face-to-face at 2% to 3% of decisions.
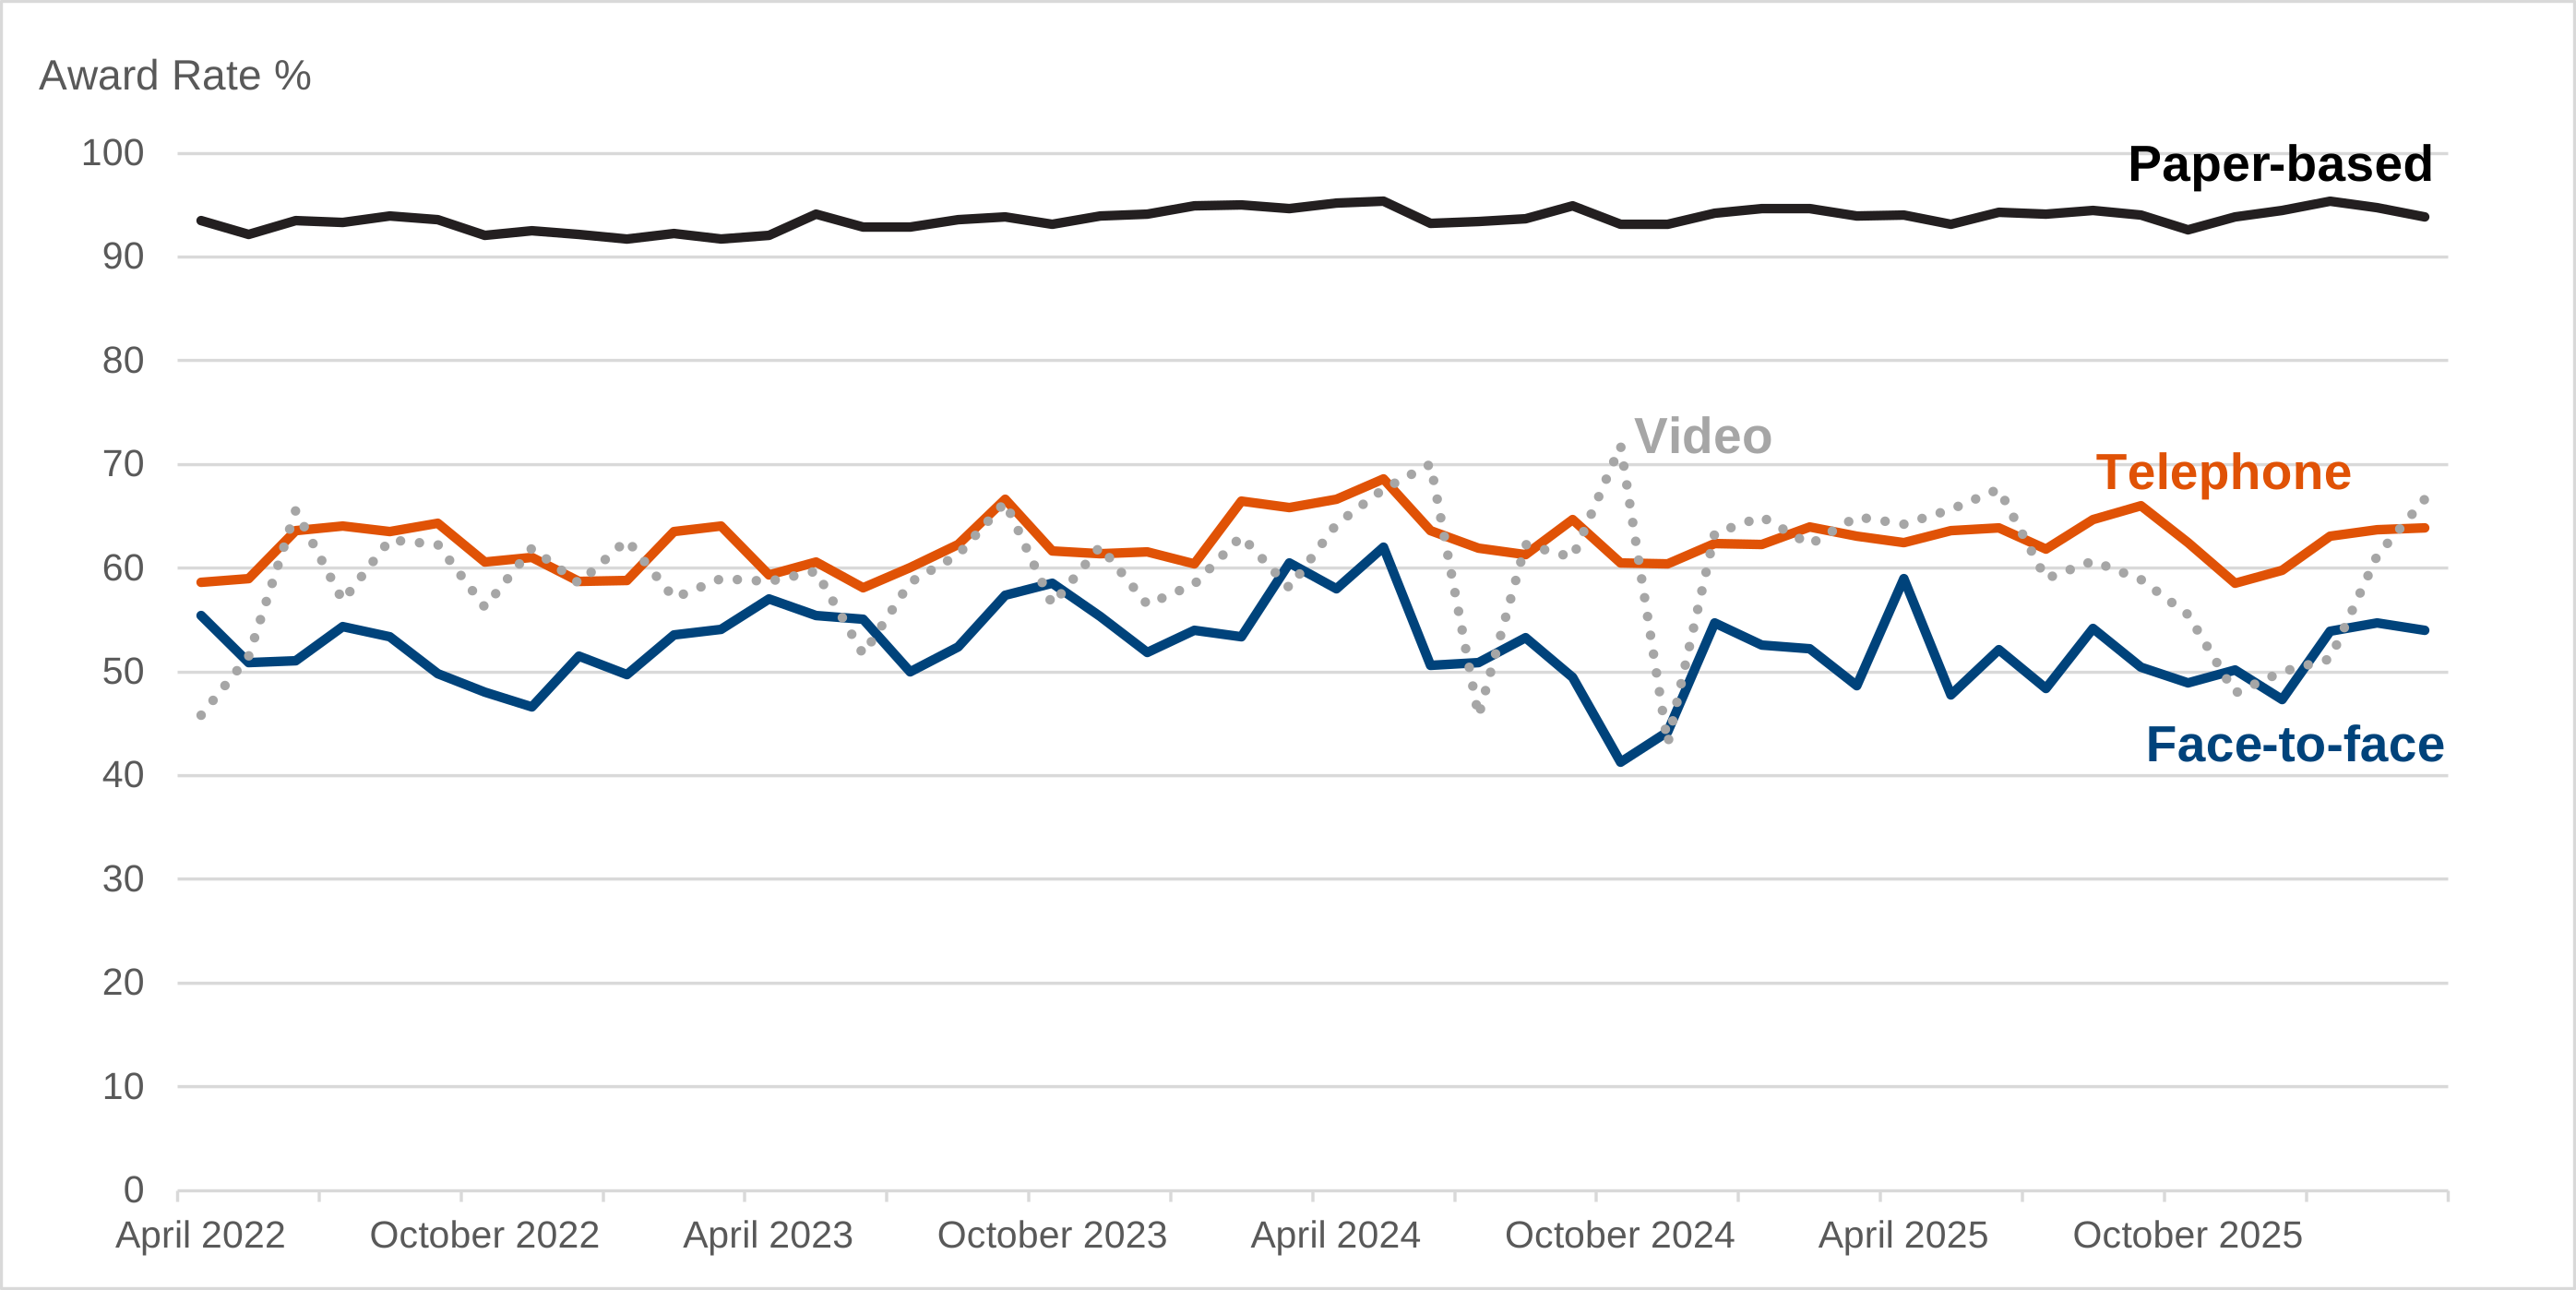
Figure 5: Monthly PIP reassessment award rate by assessment mode, April 2022 to March 2026
Source: PIP-Atomic Data Store
Figure 5 is a line chart showing monthly PIP reassessment award rates by assessment mode between April 2022 and March 2026. Telephone and video assessments have similar award rates and are consistently higher than face-to-face award rates by around 10% on average. Paper-based assessments have significantly higher award rates than other modes.
Telephone assessments show a consistently higher award rate than face-to-face assessments, as noted for PIP new claims, with the difference here typically 8% to 10%. Video assessments again show comparable award rates to telephone assessments in most cases, but the figures are more volatile due to low volumes in some months. For each assessment mode award rates have been quite stable over the period studied.
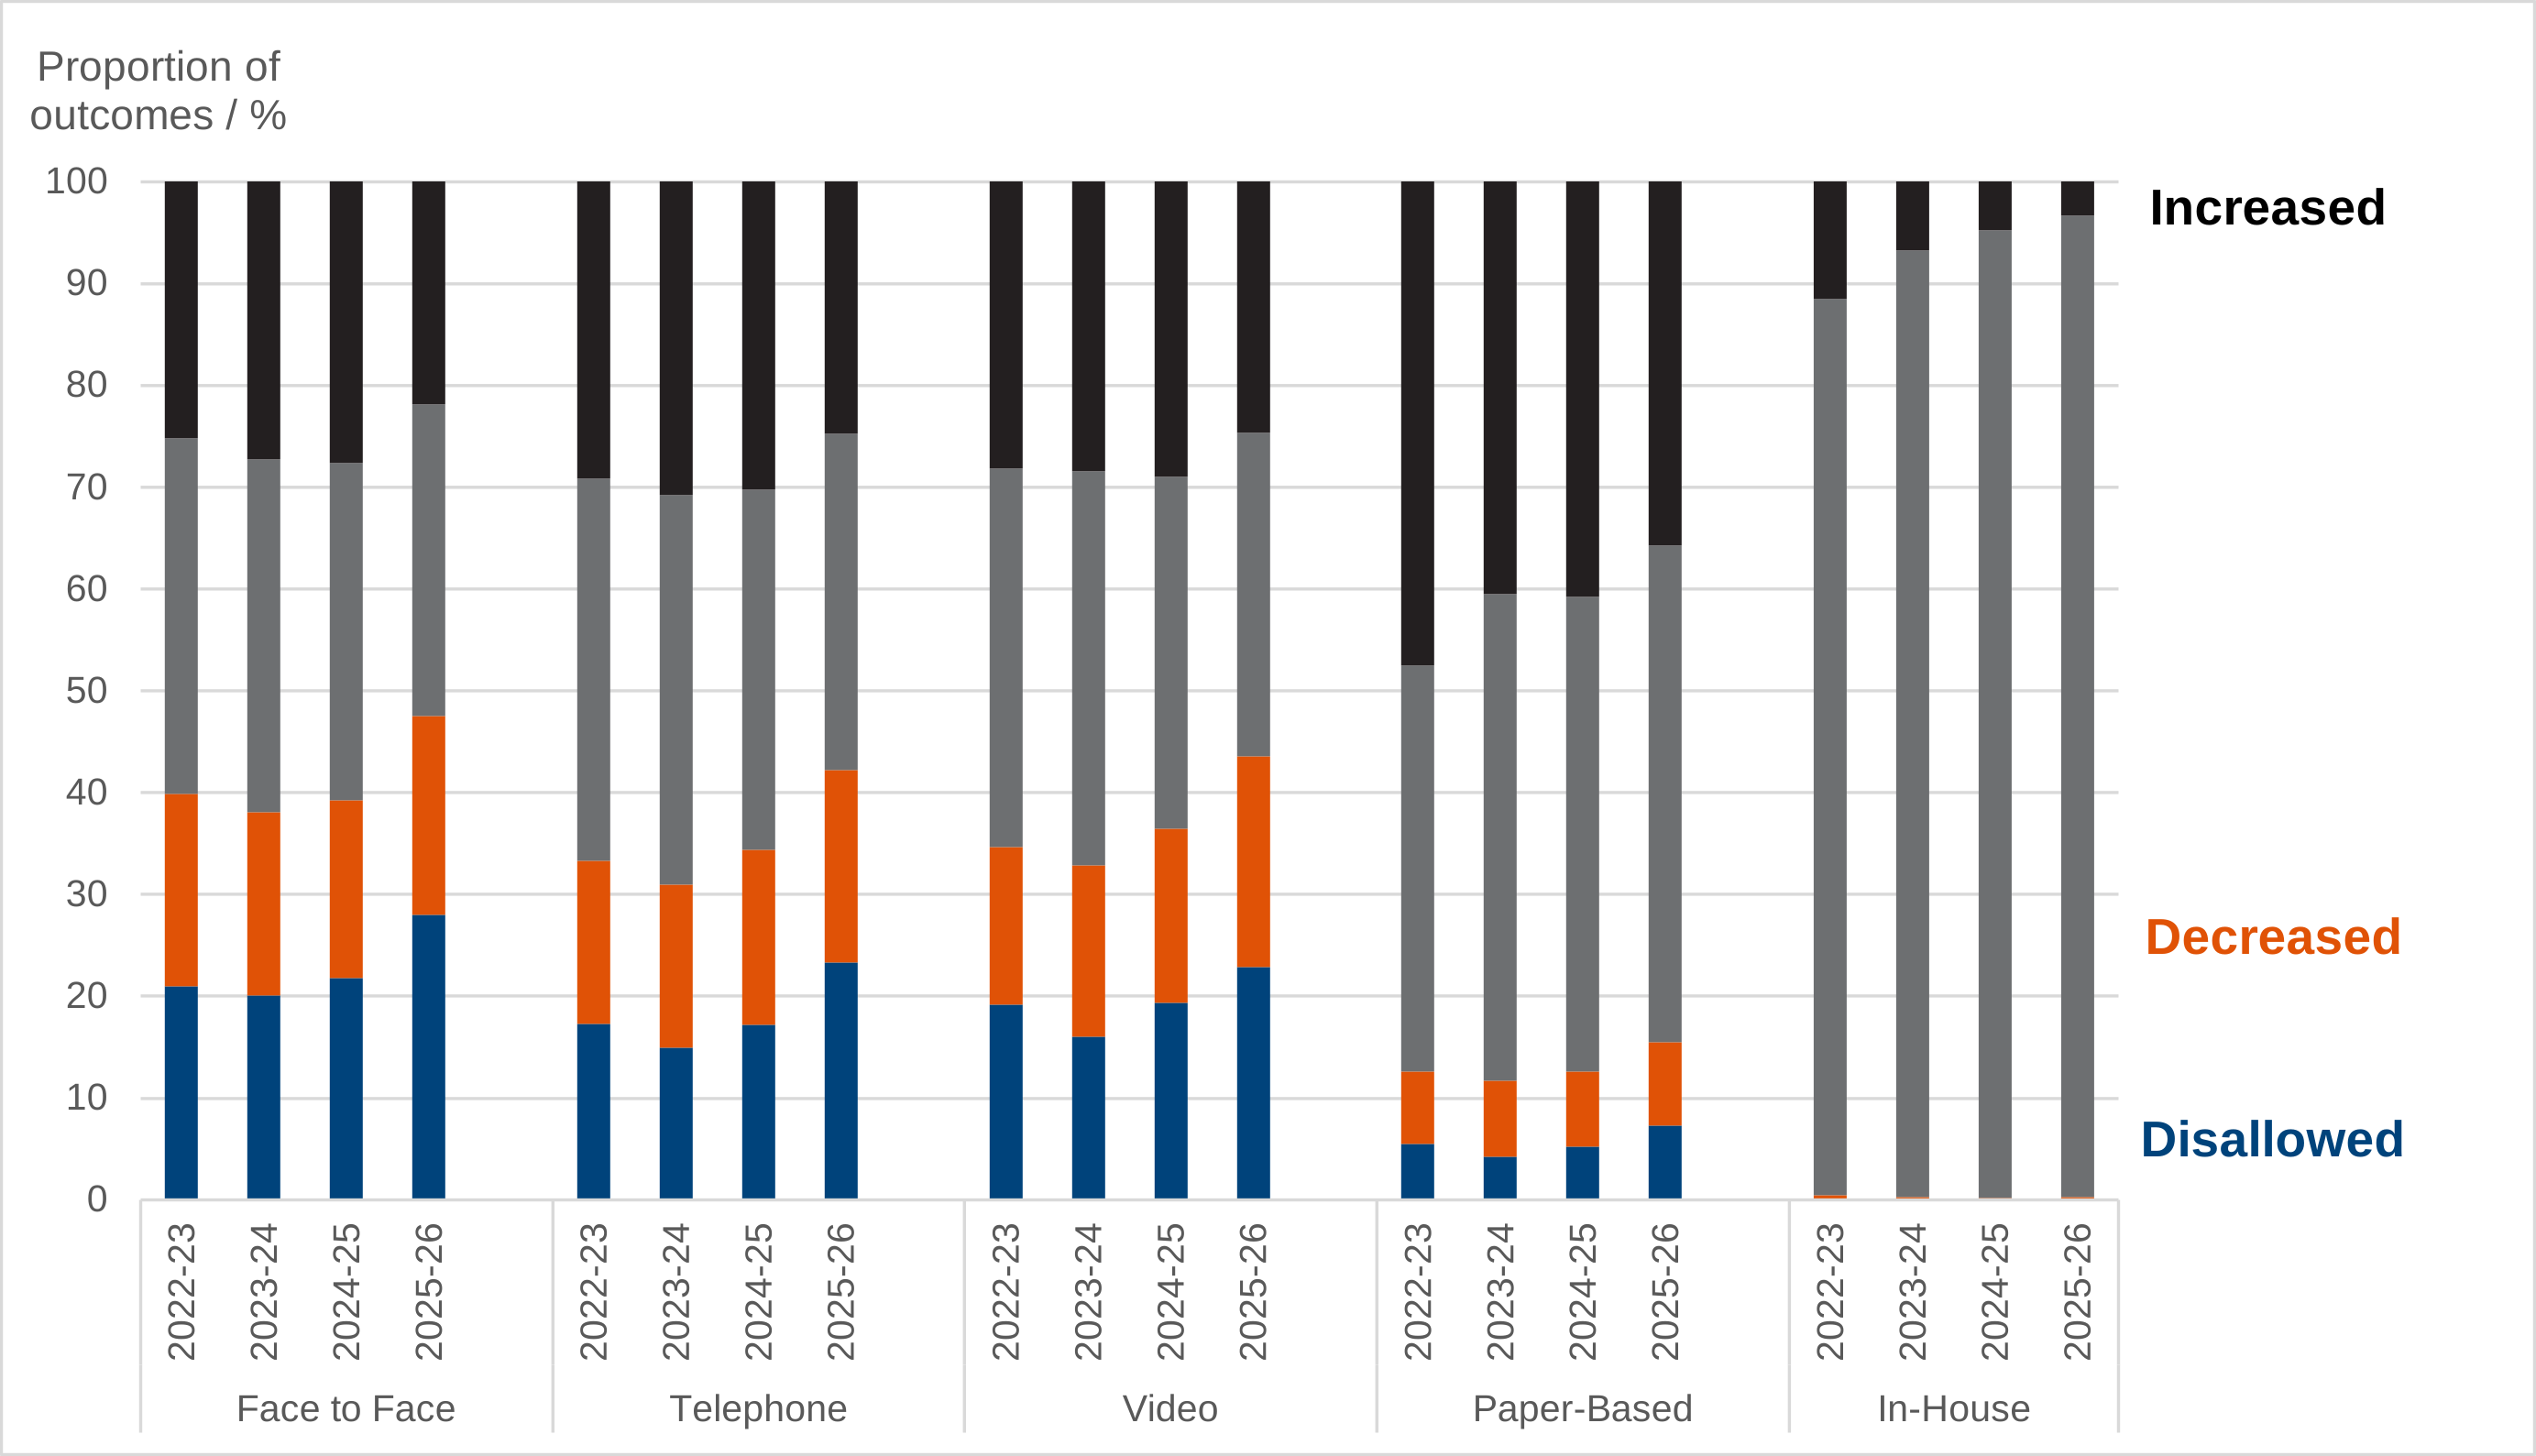
Figure 6: PIP award review outcome rates by assessment mode, financial year 2022 to 2023 to 2025 to 2026
Source: PIP-Atomic Data Store
Figure 6 is a series of stacked bar charts showing how PIP award review outcomes changed between financial years 2022 to 2023 and 2025 to 2026 for each assessment mode. For each financial year, telephone and video consultations show similar breakdown of outcomes, while face-to-face shows lower levels of increased rate outcomes and higher levels of disallowed and decreased rate outcomes compared to the remote consultation channels. Each mode shows increasing levels of disallowed and decreased rate outcomes, and declining levels of increased rate outcomes, over the time period presented. Paper-based and in-house assessment modes also show increasing levels of same rate outcomes over time.
In terms of consultation channels, telephone and video assessments show higher levels of increased and same rate awards than face-to-face by around 3 percentage points on average. Telephone assessments also show lower levels of decreased awards by 1 to 2 percentage points and of disallowed awards by 4 percentage points on average, compared to face-to-face assessments. These differences are consistent across the time period considered.
Changes over time are also evident across assessment modes of declining levels of increased award outcomes and increasing rates of disallowed and decreased award outcomes. In-house assessments have seen a steady decline in increased award outcomes and a comparable increase in same rate decisions.
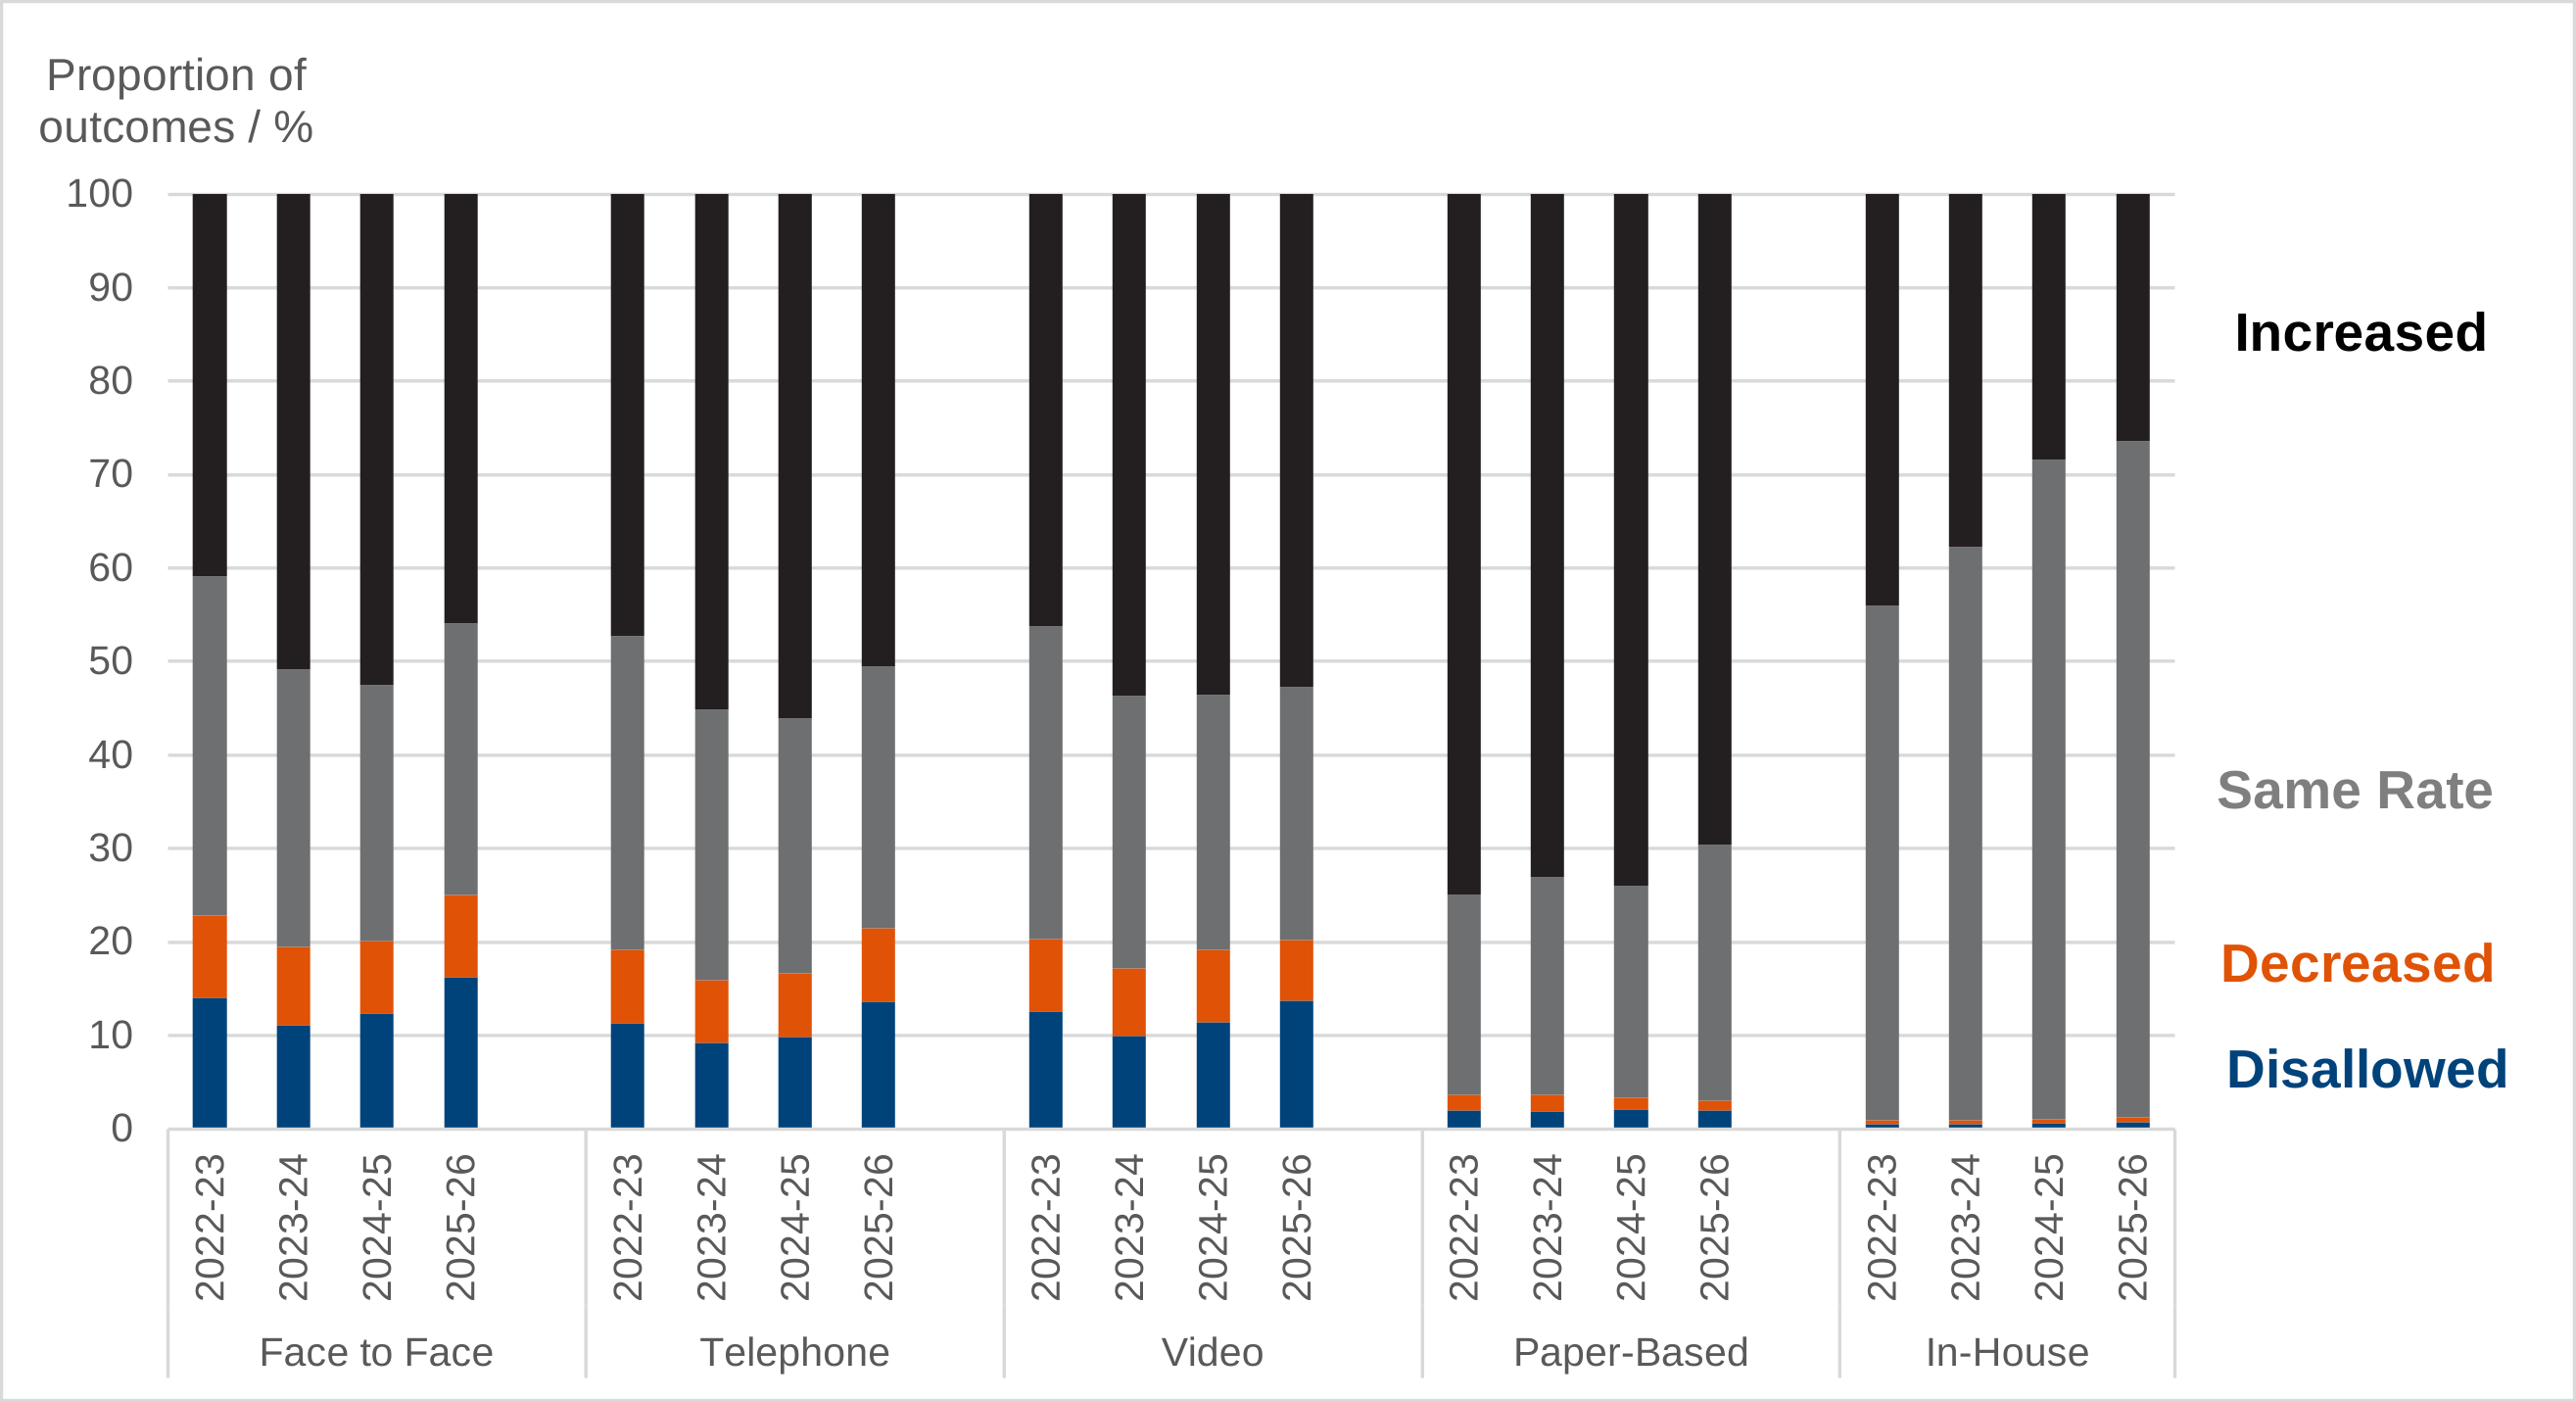
Figure 7: PIP changes of circumstance outcome rates by assessment mode, financial year 2022 to 2023 to 2025 to 2026
Source: PIP-Atomic Data Store
Figure 7 is a series of stacked bar-charts showing how PIP change of circumstance outcomes changed between financial years 2022 to 2023 and 2025 to 2026 for each assessment mode. For each financial year, telephone and video consultations show similar breakdown of outcomes, while face-to-face shows slightly lower levels of increased rate outcomes and slightly higher levels of disallowed and decreased rate outcomes compared to the remote consultation channels. Paper-based and in-house assessment modes also show increasing levels of same rate outcomes over time, along with declines in same rate outcomes.
Changes of circumstance show similar outcome trends to those for Award Reviews, shown above. Telephone and video consultations consistently show slightly higher rates of increased outcomes than face-to-face, and also lower levels of disallowed and decreased outcomes. General trends over the time period are also visible across assessment modes, including declining levels of increased awards and signs of increasing levels of same rates awards especially for in-house and paper-based assessments. Increasing levels of disallowances are also seen, and smaller increases in decreased rate outcomes.
PIP decisions by gender and age
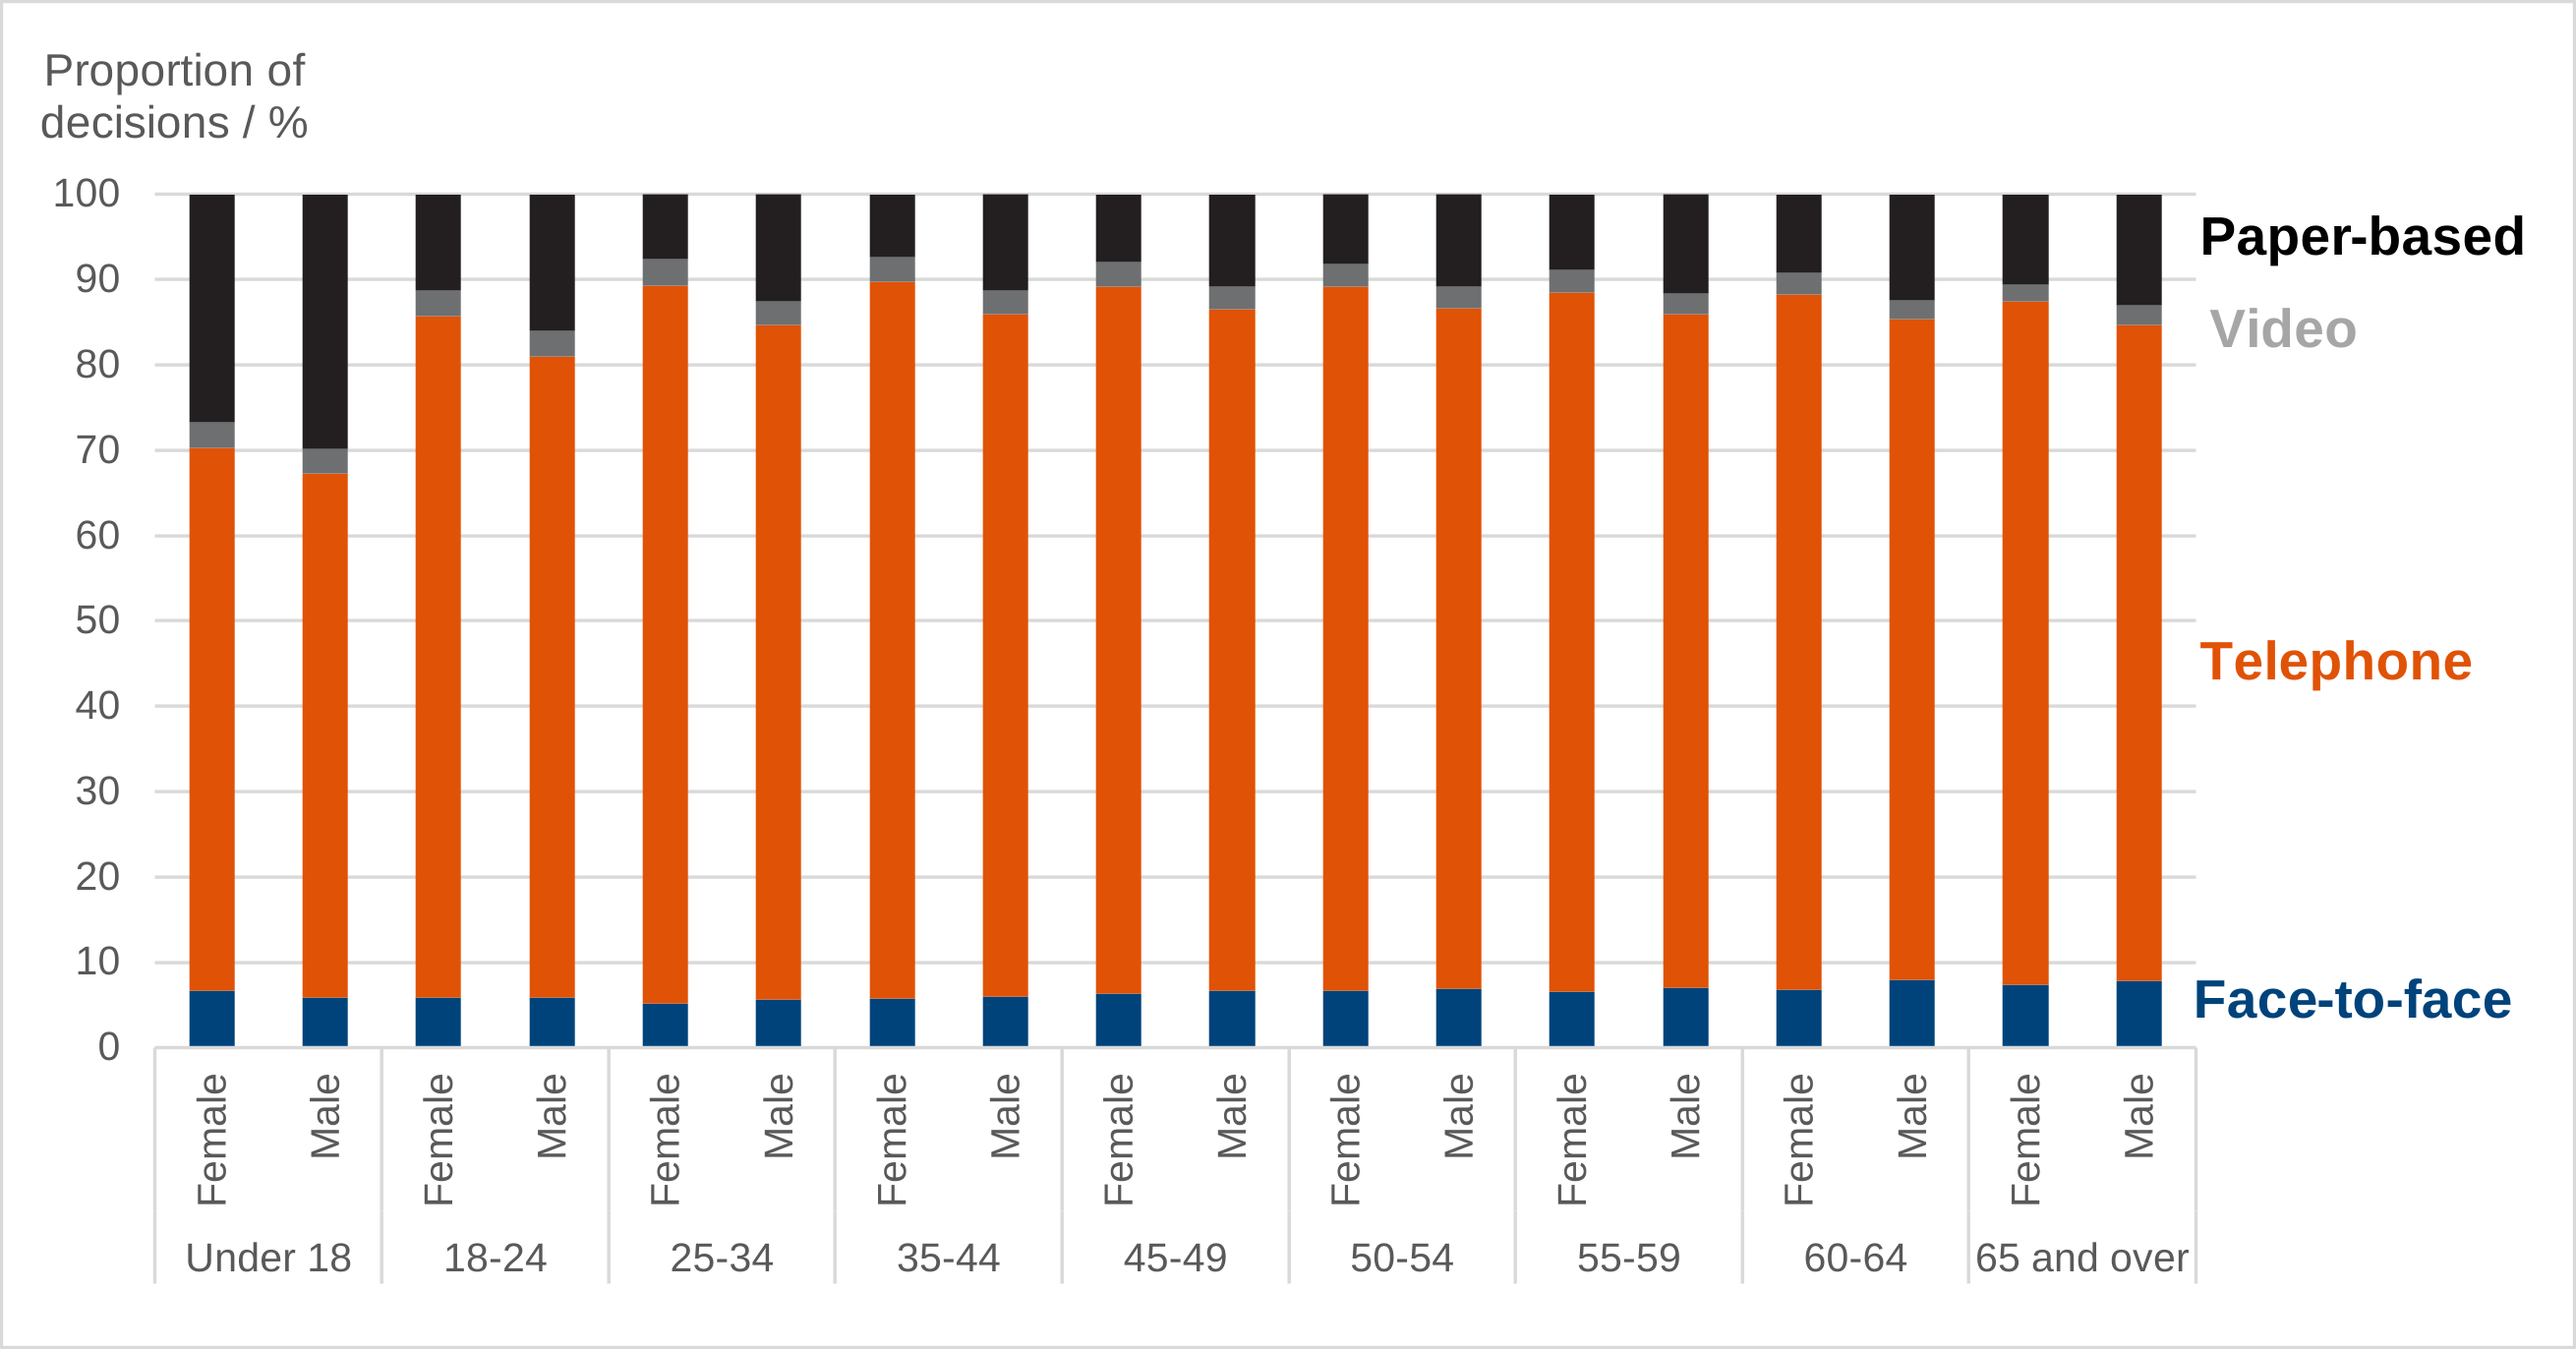
Figure 8: PIP new claim assessment mode by gender and age group, for financial year 2025 to 2026
Source: PIP-Atomic Data Store
Figure 8 is a series of grouped stacked bar charts showing how the distribution of assessment modes compares between genders and age groups for PIP new claims in financial year 2025 to 2026. Gender differences are consistent across age groups, with females having higher rates of telephone consultations and lower rates of paper-based assessments compared to men. The genders show similar variations with age, with proportion of paper-based assessments falling from a high for the youngest claimants to a minimum for the 35 to 44 year old age group and then slowly increasing again with age. The proportion of face-to-face consultations also shows a gradual increase with age from a minimum for the 25 to 34 year old age group.
Distribution of assessment mode by age group for PIP new claims shows that the youngest claimants are the most likely to have a paper-based assessment. This mode reaches its minimum share for the 35 to 44 years old age group and then shows a gradual increase with age, while the share of telephone consultations mirrors the trend for paper-based assessments. The proportion of face-to-face consultations also shows a gradual increase with age after a minimum for the 25 to 34 years age group.
These age group trends were seen to be consistent for both genders. An additional difference between the genders was seen with males more likely to have a paper-based assessment while a higher proportion of females had telephone consultations.
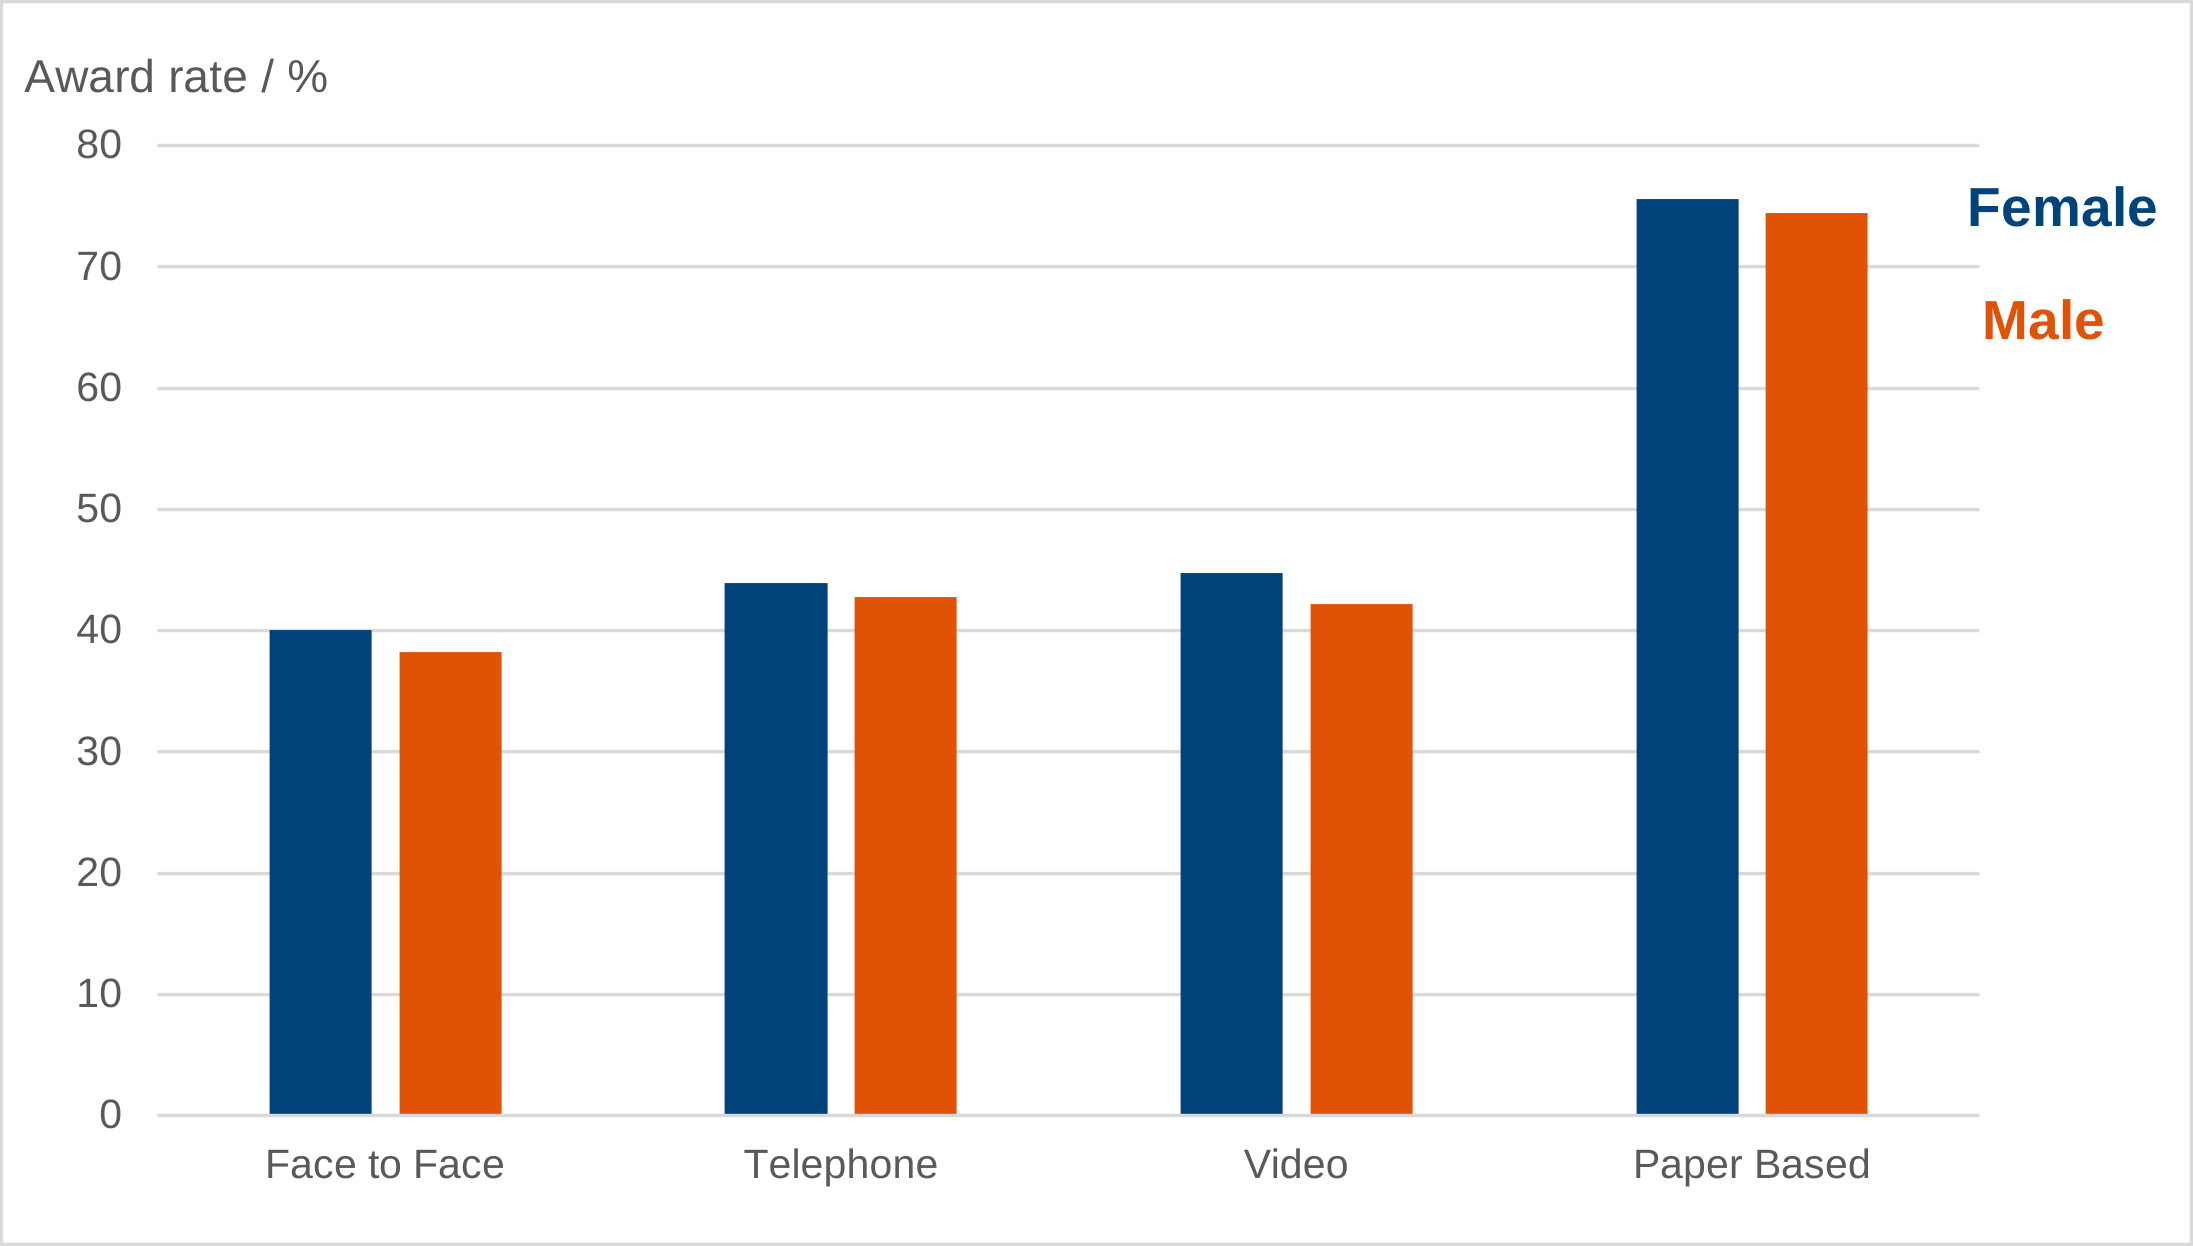
Figure 9: PIP new claim award rate by assessment mode and gender, for financial year 2025 to 2026
Source: PIP-Atomic Data Store
Figure 9 is a bar chart showing PIP new claims award rates by gender and assessment mode. Award rates for females are higher by 1% to 2% across all modes. For both genders video and telephone consultations show award rates 4% to 5% higher than those for face-to-face consultations. Paper-based assessments have significantly higher award rates than other modes.
For PIP new claims, women have slightly higher award rates than men for each assessment mode, typically by 1% to 2%. The relative differences between assessment mode award rates, discussed above, were apparent when considered by gender with face-to-face lower than telephone by similar amounts for both men and women, while video had similar levels to telephone and paper-based was significantly higher.
As noted above men are slightly less likely than women to be assessed by telephone, but more likely to have paper-based assessments. The higher award rates associated with paper-based assessments mean that the overall award rate for men is very similar to that for women, with differences of less than a percentage point seen when considered by financial year.
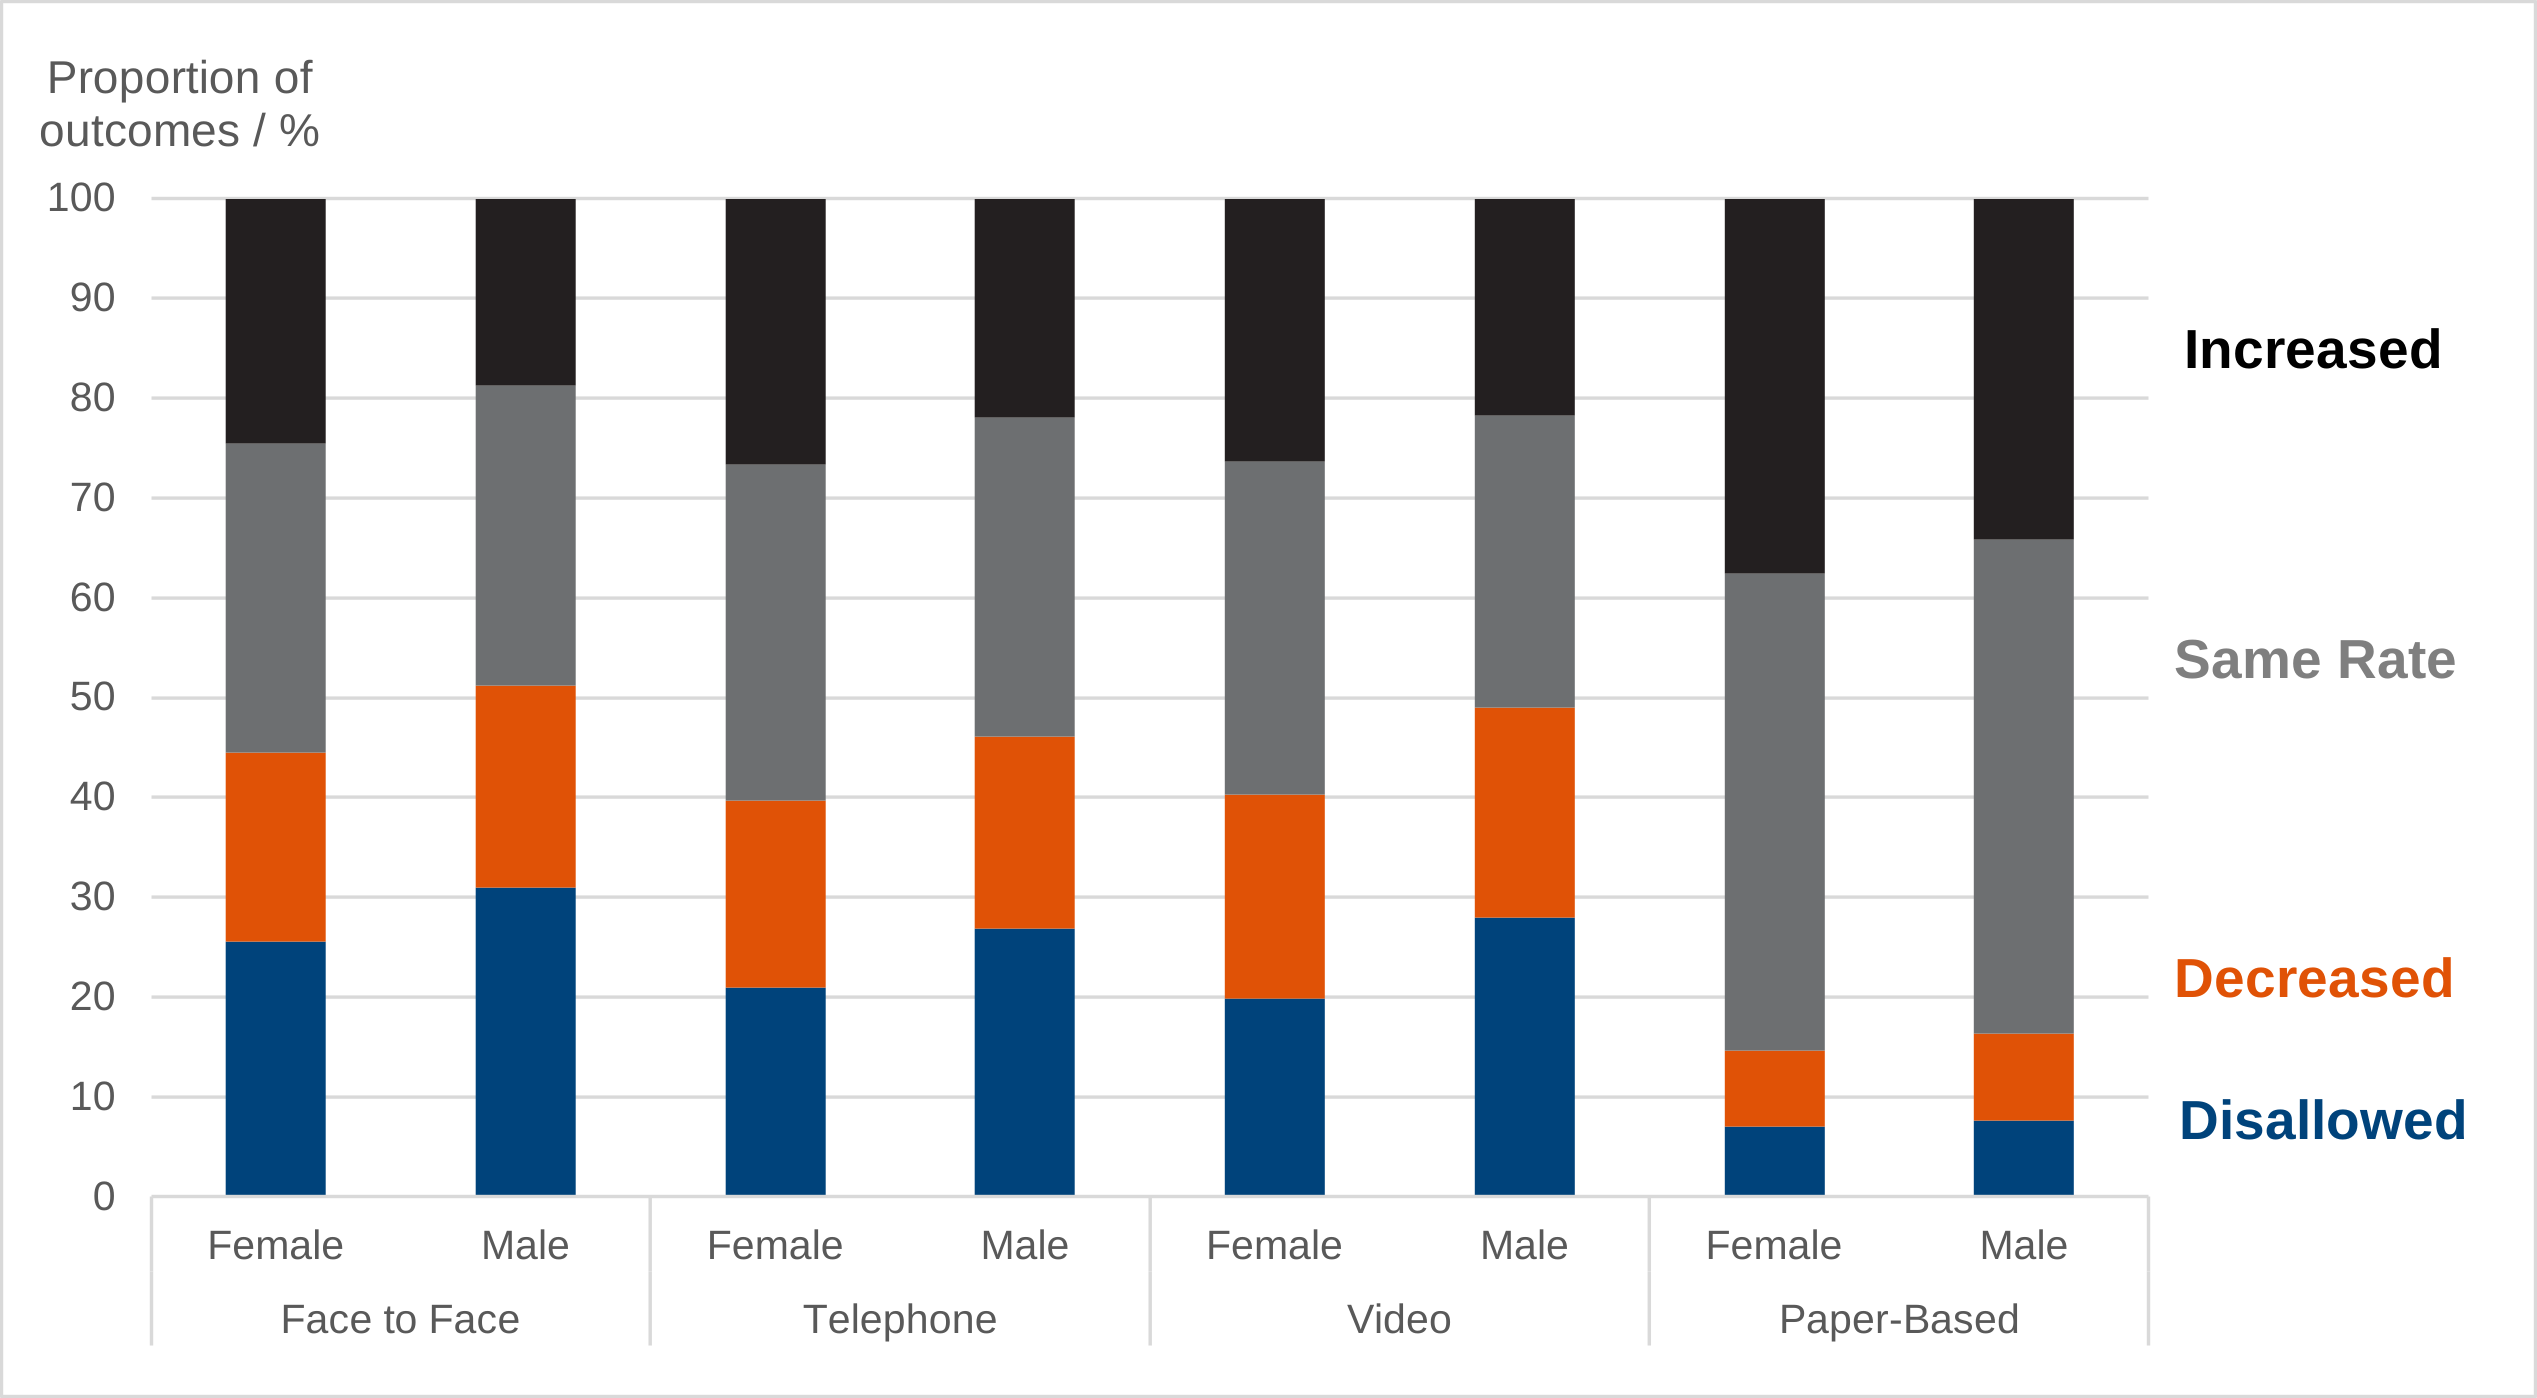
Similar trends were observed for the other PIP decision types. For example, award review outcome rates for financial year 2025 to 2026 show a higher level of increased rate outcomes and lower levels of disallowed outcomes for women compared to men across the assessment modes. This data also shows that remote consultation channels had higher levels of increased rate outcomes and lower levels of disallowances than face-to-face consultations by comparable amounts for both genders. Again, men were less likely to be assessed by telephone and more likely to have paper-based assessments for Award Reviews.
Figure 10: PIP award review outcome rates by assessment mode and gender, for financial year 2025 to 2026
Source: PIP-Atomic Data Store
Figure 10 is a series of grouped stacked bar charts showing how PIP award review outcomes vary between genders for different assessment modes in financial year 2025 to 2026. Gender differences are consistent across modes, with males showing lower levels of increased rate outcomes and higher levels of disallowed outcomes compared to females. Face-to-face consultations also show higher levels of disallowed outcomes and lower levels of increased rate outcomes than remote consultations by similar amounts for both genders.
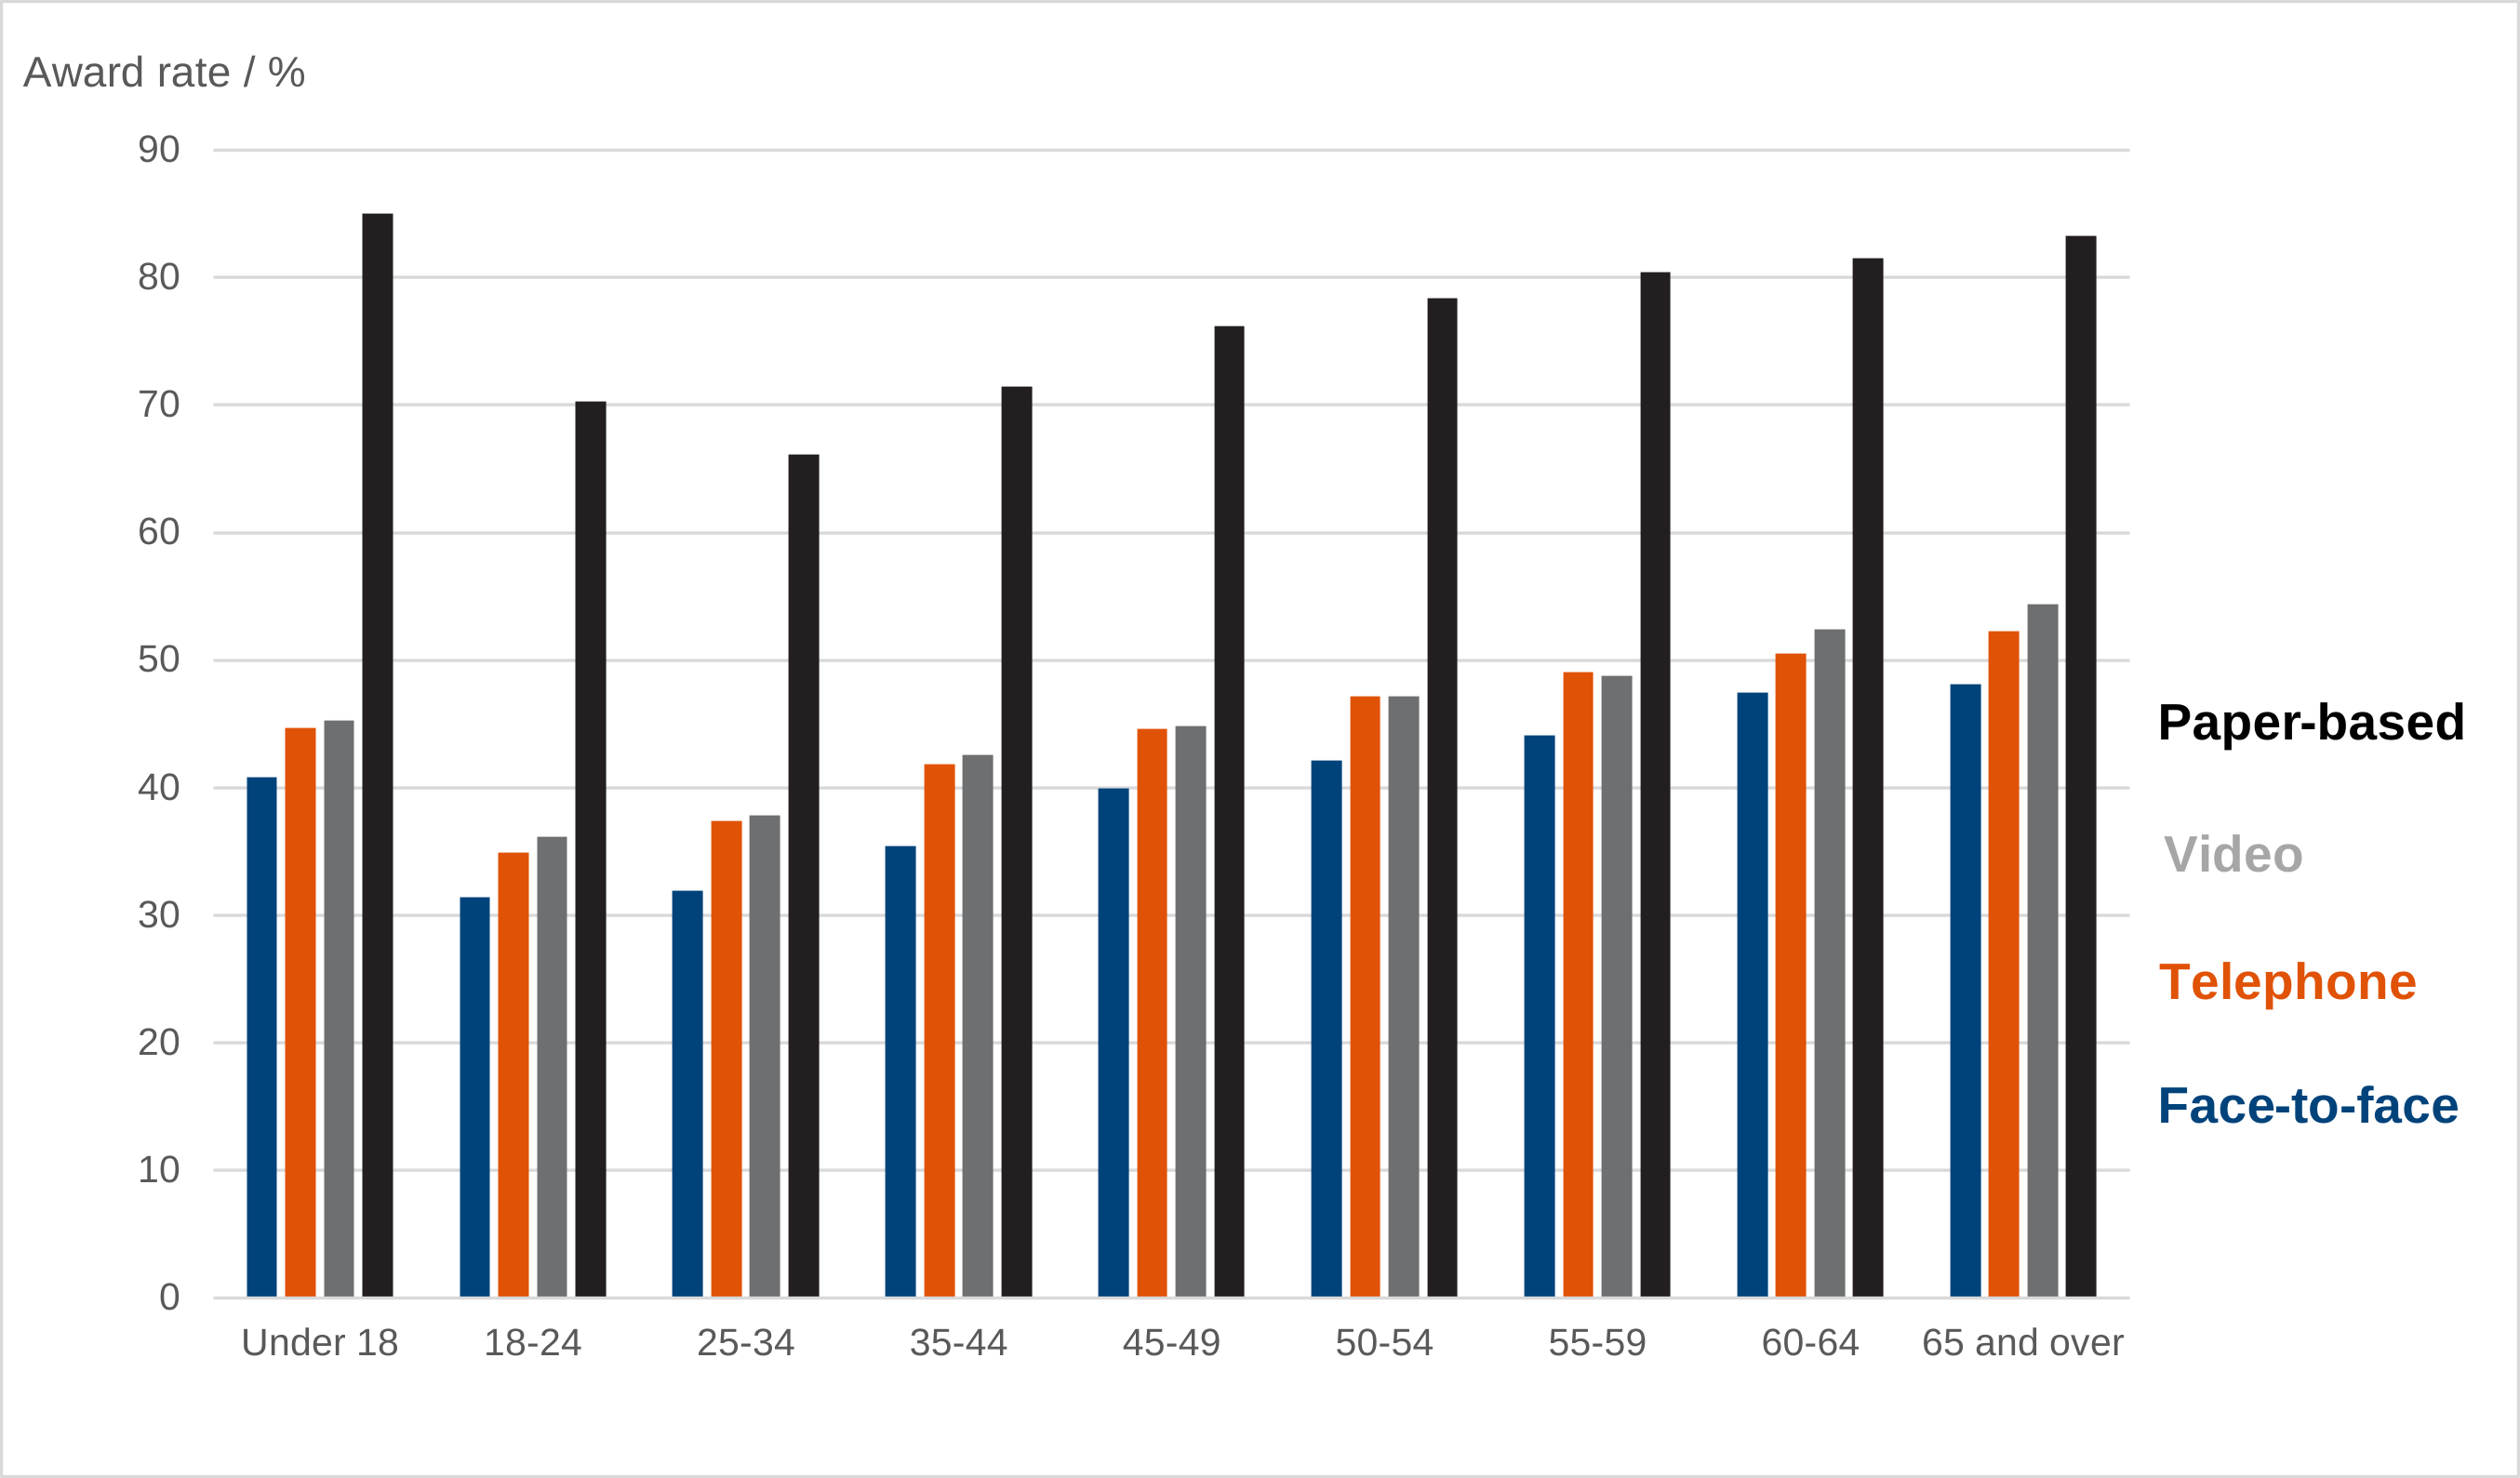
Figure 11: PIP new claims award rate by assessment mode and age group, for financial year 2025 to 2026
Source: PIP-Atomic Data Store
Figure 11 is a series of grouped bar charts showing how PIP new claim award rate varies between age groups for different assessment modes in financial year 2025 to 2026. Similar trends with age group are evident across each mode, with award rates increasing with age other than for the youngest claimants where it is initially higher. Face-to-face consultations also show lower award rates than remote consultations by similar amounts for all age groups.
Relative differences between assessment mode award rates for new claims were evident when considering the data by age group. Data for financial year 2025 to 2026 shows that award rates for remote consultations were consistently above those for face-to-face consultations, while paper-based assessments showed significantly higher rates. Similar trends with age group are evident for each assessment mode, and differences between modes remained very similar for each age group.
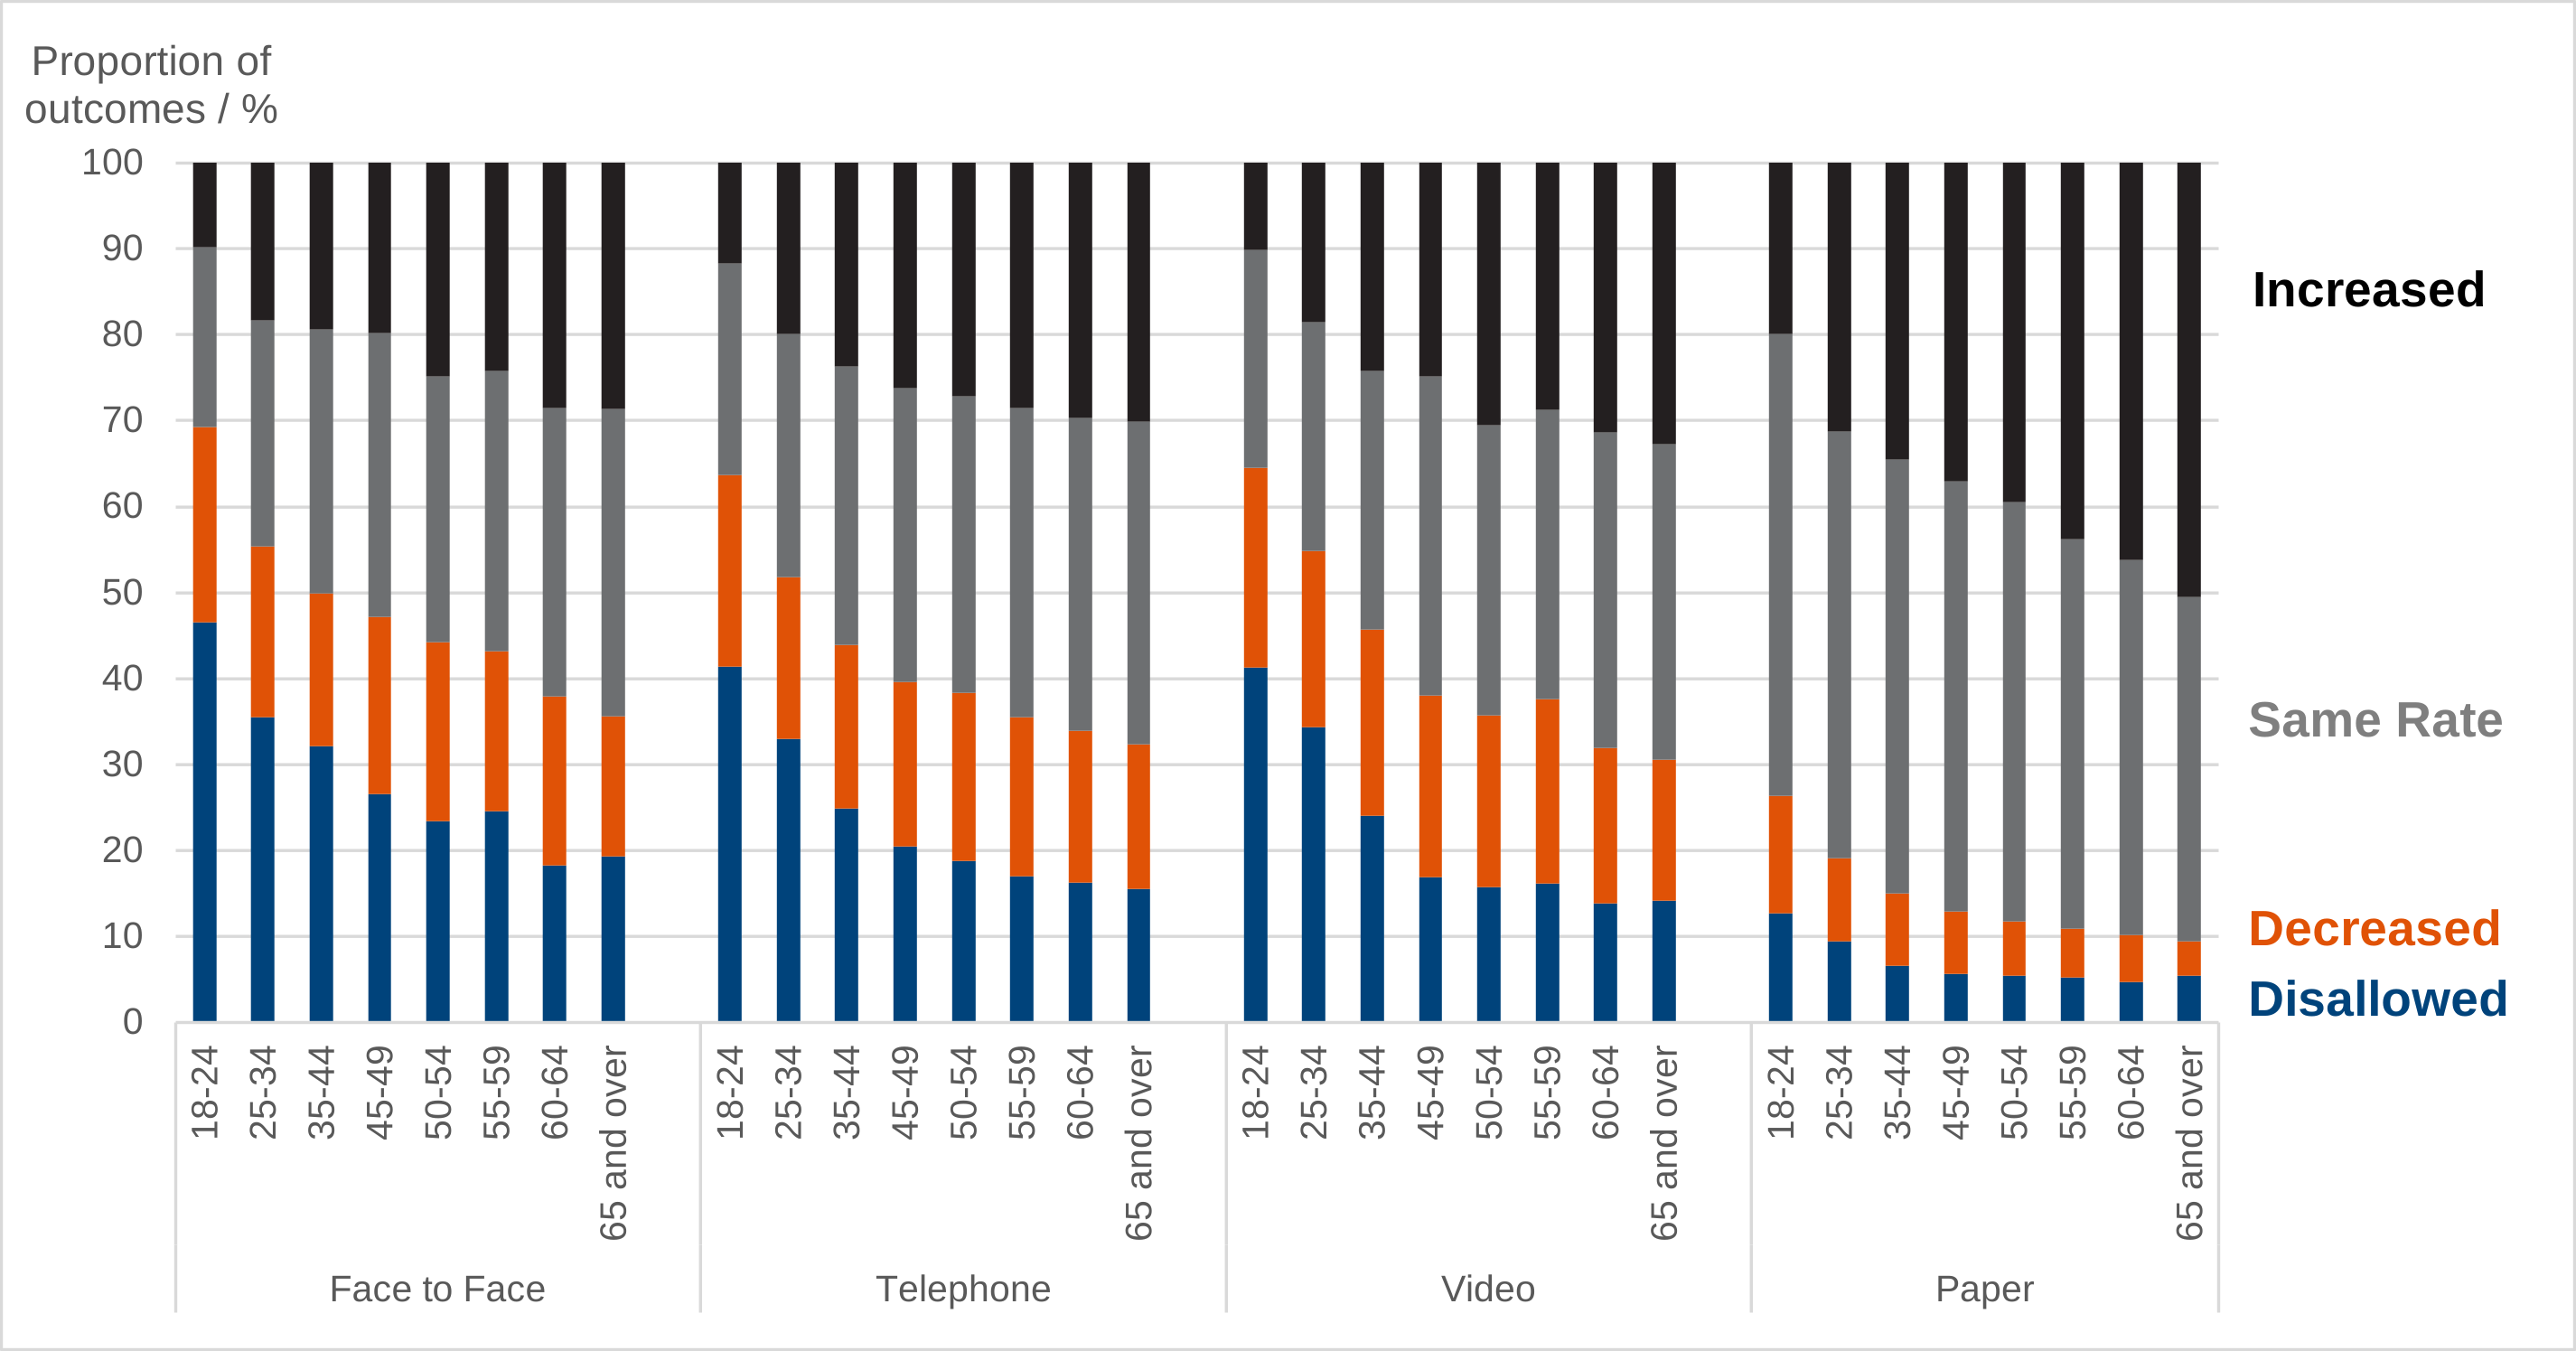
Similar trends were observed for the other PIP decision types. For example, PIP award review outcome rates show similar trends for each mode with age, and levels of increased rate outcomes for remote consultations are slightly higher than those for face-to-face consultations for each age group, along with lower levels of disallowances.
Figure 12: PIP award review outcome rates by assessment mode and age group, for financial year 2025 to 2026
Source: PIP-Atomic Data Store
Figure 12 is a set of grouped stacked bar charts showing how PIP award review outcomes vary with age group for each assessment mode in financial year 2025 to 2026. Each mode shows a similar trend with age group, of higher levels of increased rate outcomes and lower levels of disallowed and decreased outcomes. Also, remote consultation channels show slightly higher levels of increased rate outcomes and lower levels of disallowed and decreased outcomes than face-to-face consultations for each age group.
PIP decisions by health condition
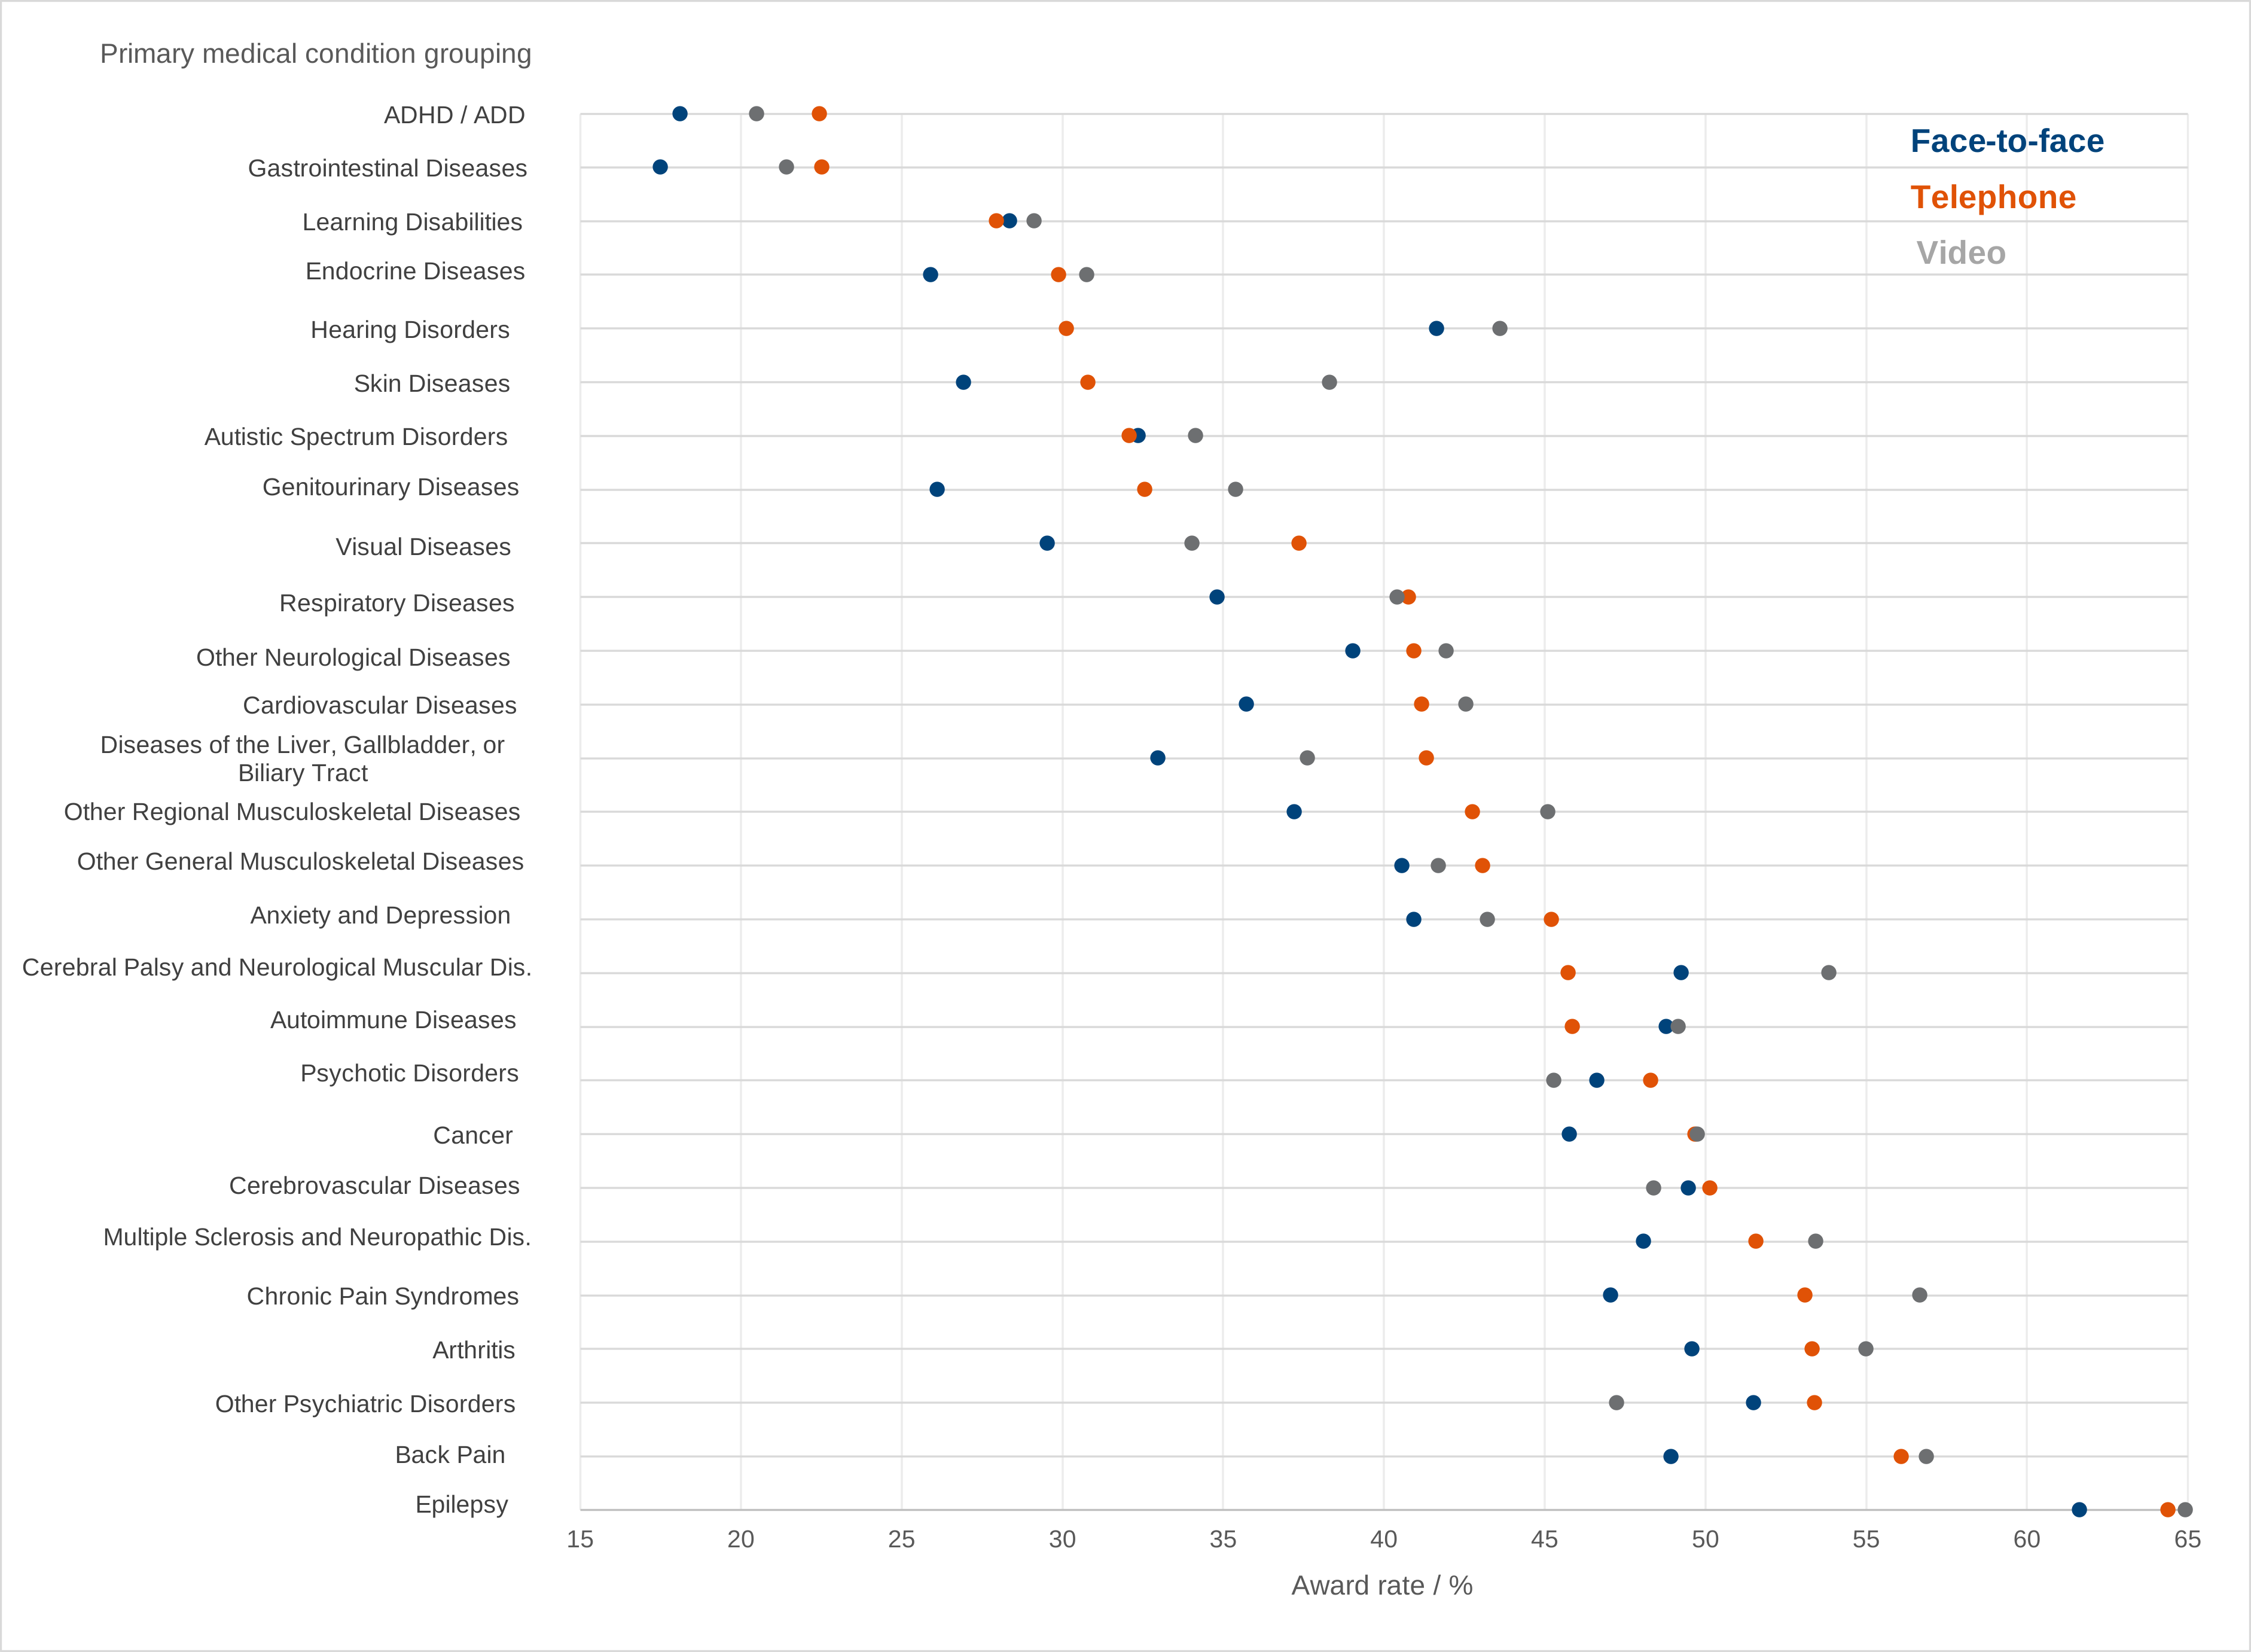
The differences between remote and face-to-face consultations could again be seen in PIP new claims award rates for financial year 2025 to 2026 when considered by health condition grouping. In the majority of cases, the award rate for face-to-face consultations was seen to be lower than that for telephone or video consultations, which had similar award rates. Possible exceptions include Autistic Spectrum Disorders, Learning Disabilities and Cerebrovascular Diseases where the award rates are very similar, and Cerebral Palsy and Autoimmune Diseases where rates for face-to-face are slightly higher.
Most conditions follow the typical distribution of decisions between assessment modes, but exceptions include Cancer, Psychotic Disorders, Other Psychiatric Disorders and Cerebrovascular Diseases having a higher proportion of paper-based assessments, and Hearing Disorders having a higher rate of face-to-face assessments (and lower proportion of telephone-based).
Figure 13: PIP new claim award rate by assessment channel and health condition group, for financial year 2025 to 2026
Source: PIP-Atomic Data Store
Figure 13 is a dot plot showing PIP new claims award rate by primary medical condition grouping for each consultation channel for financial year 2025 to 2026. For most condition groups face-to-face consultations show lower award rates than telephone or video consultations, which typically have similar award rates. Exceptions include Autistic Spectrum Disorders, Learning Disabilities and Cerebrovascular Diseases where the award rates are very similar, and Cerebral Palsy and Autoimmune Diseases where rates for face-to-face are slightly higher. Hearing Disorders show lower award rate for telephone assessments than either face-to-face or video, though the data also shows a lower proportion of assessments carried out by this channel in this case.
About this analysis
The figures presented in this release are based on internal analysis using PIP data. As these are outturn figures, using 100% of decisions following a PIP assessment, the level of statistical uncertainty in the analysis is low. However, the results may not match exactly the totals released as PIP official statistics due to methodological and rounding differences.
Statement of application of the Code of Practice for Statistics
The Code of Practice for Statistics (the Code) is built around 3 main concepts, or pillars:
- trustworthiness – is about having confidence in the people and organisations that produce statistics
- quality – is about using data and methods that produce assured statistics
- value – is about publishing statistics that support society’s needs
The following explains how we have applied the pillars of the Code in a proportionate way.
Trustworthiness
DWP analysts work to a professional competency framework and Civil Service core values of integrity, honesty, objectivity, and impartiality. Analysts have produced these statistics and conducted rigorous quality assurance in line with the standards usually applied to ad hoc releases. Background and methodology information is also included in the release.
The analysis has been signed off by the Lead Analyst and the department’s Chief Statistician/Head of Profession for Statistics. The publication was approved through DWP’s statistical governance process, including review of the rationale for publication, quality assurance arrangements and compliance with the Code of Practice for Statistics. The timing of the publication was pre-announced.
Care has been taken to ensure only those who needed to see the analysis prior to publication had access to it.
Quality
The data which underpins this information is taken directly from departmental systems, which are relied upon by DWP for the administration and operation of PIP.
Quality assurance has taken place in line with the standards usually applied to DWP ad hoc releases, with an internal check that the results shown are robust and checked against published data.
Value
Releasing this information serves the public interest regarding assessment channels.
Contact information
Press enquiries should be directed to the DWP Press Office.