Personal Incomes Statistics 2019 to 2020: Commentary for tables 3.1 to 3.11, 3.16 and 3.17
Published 16 March 2022

© Crown copyright 2022
This publication is licensed under the terms of the Open Government Licence v3.0 except where otherwise stated. To view this licence, visit nationalarchives.gov.uk/doc/open-government-licence/version/3 or write to the Information Policy Team, The National Archives, Kew, London TW9 4DU, or email: psi@nationalarchives.gov.uk.
Where we have identified any third party copyright information you will need to obtain permission from the copyright holders concerned.
This publication is available at https://www.gov.uk/government/statistics/personal-incomes-statistics-for-the-tax-year-2019-to-2020/personal-incomes-statistics-2019-to-2020-commentary-for-tables-31-to-311-316-and-317
1. Introduction
About this publication
Statistics about personal incomes are assessed using the annual Survey of Personal Incomes (SPI). The survey is based on information held by HMRC on individuals who could be liable to UK Income Tax. It is carried out annually by HMRC and covers income assessable to tax for each tax year.
Most tables in this statistics release exclude individuals who are not taxpayers unless otherwise stated. This can occur for a number of reasons, for example if they have no Income Tax liability due to their deductions, reliefs and personal allowances exceeding their total income, or if their income is below the Personal Allowance. Figures cover the United Kingdom and tax year 2019 to 2020 unless stated otherwise. The SPI is compiled to provide information to the public, Members of Parliament, other Government Departments, companies, and organisations. It is a quantified evidence base from which to cost proposed changes to tax rates, personal allowances and other tax reliefs for Treasury Ministers. It is used to inform policy decisions within HMRC, the Treasury and the Devolved Administrations, as well as for tax modelling and forecasting purposes. In addition, it is used to provide summary information for the National Accounts that are prepared by the Office for National Statistics.
Supporting documents to the SPI annual publication are:
-
accompanying statistical tables in Tables 3.1 to 3.11, 3.16 and 3.17 by tax year
-
accompanying statistical tables and supporting documentation on the methodology used to produce these statistics is available in Personal incomes: tables 3.1 to 3.11, 3.16 and 3.17 for the tax year 2019 to 2020
2. Table 3.1 and 3.1a - Percentile points for total income before and after tax, for tax year ending 1993 to tax year ending 2020
Individuals who are not taxpayers are not included in Table 3.1.
Figure 2.1: Total income before tax at selected percentiles
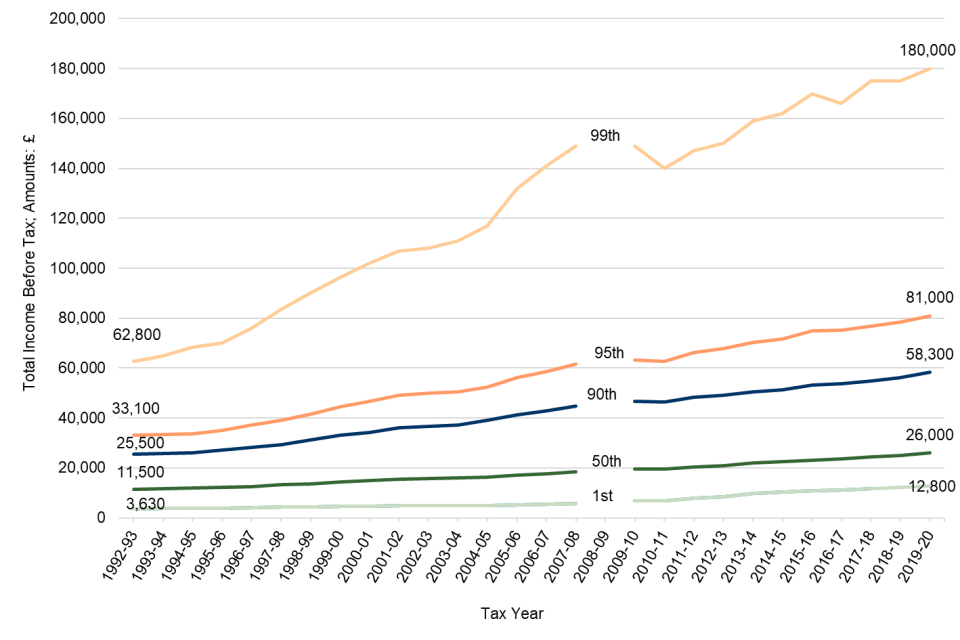
Line chart showing yearly total income before tax at selected percentiles
Source: Survey of Personal Incomes for tax year 2019 to 2020, Table 3.1
The median income before tax has generally increased each year from the tax year ending 1993 to reach £26,000 in the tax year ending 2020, a 4% increase on the previous tax year median income of £25,000.
In addition, the income level of the 99th percentile increased from £62,800 in the tax year ending 1993 to £180,000 in the tax year ending 2020, a 3% increase on the previous tax year 99th percentile income of £175,000.
For those at the 1st percentile, income has increased over the same period, from £3,630 to £12,800. However, as the statistics include only taxpayers, at this end of the income distribution, the increase is largely a result of the increase in the Personal Allowance for Income Tax which increased from £3,445 to £12,500 over the same period and 5% since the previous tax year.
Figure 2.2: Percentile points of total income before tax for the last three tax years
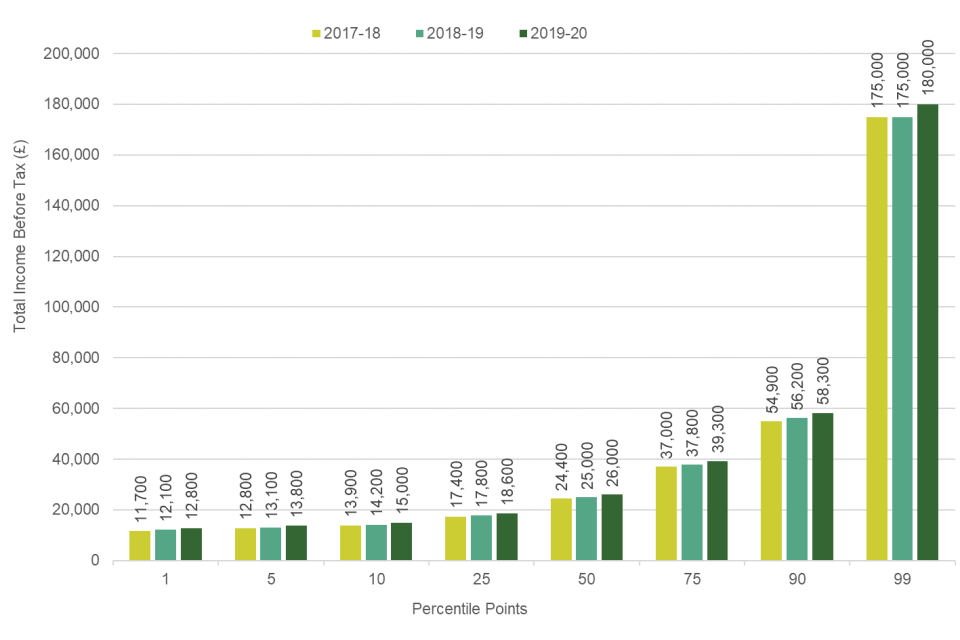
Column chart showing percentile points of total income before tax for the last three tax years
Source: Survey of Personal Incomes for tax year 2019 to 2020, Table 3.1 and Table 3.1a
Figure 2.2 shows that in the tax year 2019 to 2020, 10% of taxpayers had an income before tax of less than £15,000. At the upper end of the distribution, 10% of taxpayers had an income before tax of more than £58,300.
3. Table 3.2 - Distribution of median and mean income and tax, by age range and gender, tax year 2019 to 2020
The data presented in Table 3.2 relates to total income for the tax year and comprises of employment, profit and pension income plus property, interest, dividend and other income. The survey has no information on hours worked and alternative working patterns, for example, part-time working.
Figure 3.1: Number of taxpayers and median income before tax by age and gender
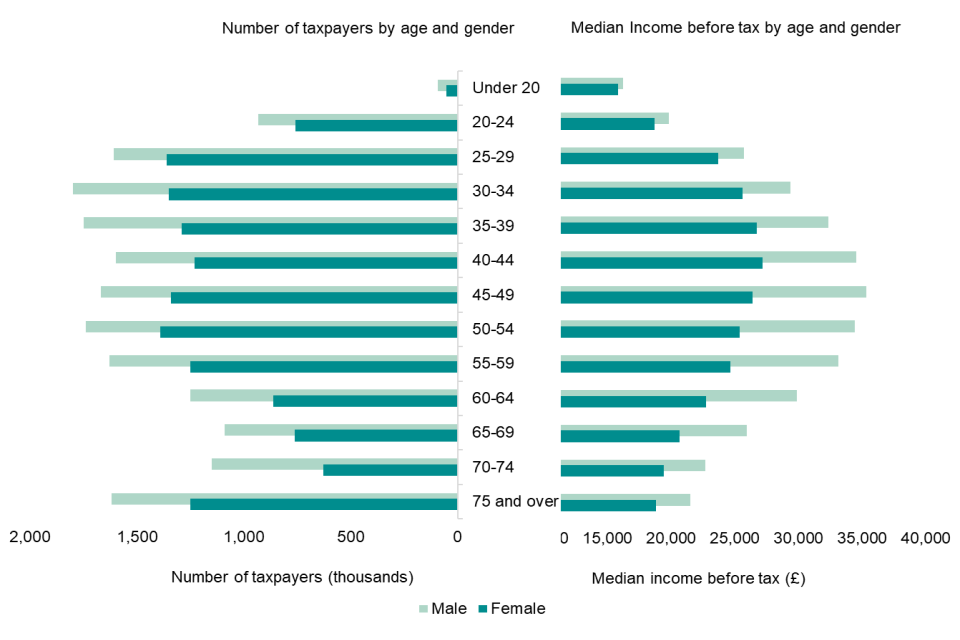
Bar chart showing number of taxpayers and median income before tax by age and gender
Source: Survey of Personal Incomes for tax year 2019 to 2020, Table 3.2
Figure 3.1 shows that there were more male than female taxpayers in every age range and males had higher median income throughout. The number of taxpayers peaks at the 30-34 age range for males (at 1.8 million) and at the 50-54 age range for females (at 1.4 million). The median income across all age groups was £28,400 for males and £23,300 for females. The highest median income was found in the 45-49 age range (£35,400) for males and in the 40-44 age range (£27,200) for females.
4. Table 3.3 – Distribution of total income before and after tax by gender, tax year 2019 to 2020
Table 3.3 provides estimates of taxpayer numbers, amounts of total income (before and after tax) and of total tax liabilities by gender and range of total income (before and after tax).
Figure 4.1: Total income before tax and total tax by gender and range of income
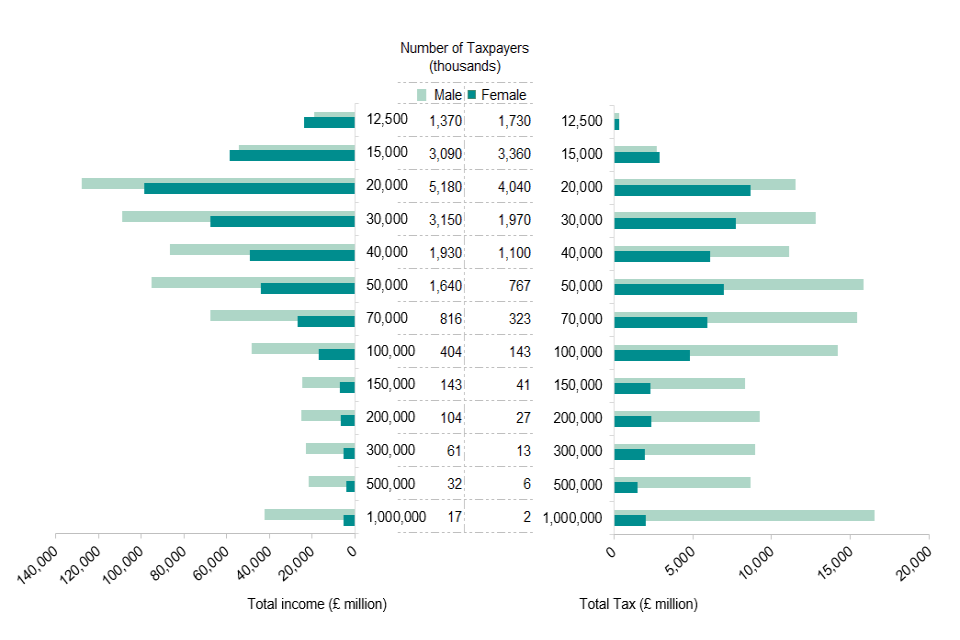
Bar chart showing total income before tax and total tax by gender and range of income
Source: Survey of Personal Incomes for tax year 2019 to 2020, Table 3.3
A relatively small number of taxpayers (4.5 million, 14%) have total income over £50,000 but these taxpayers account for a significant proportion of total income (£462 billion, 40%) and an even greater proportion of total tax (£125 billion, 66%). More information on percentile shares of total income and tax are given in Table 3.1
5. Table 3.4 – Income tax liabilities of “savers”, basic, higher and additional rate taxpayers, by largest source of income, tax year 2019 to 2020
Table 3.4 categorises taxpayers by their highest marginal rate of Income Tax, range of total income and largest source of income, showing the number of taxpayers and amount of tax. An individual’s marginal tax rate is the proportion of an extra pound of income that would be paid in Income Tax, which depends on their total taxable income and its composition.
This table can include individuals liable to tax at the additional rate but whose income is below the £150,000 threshold for additional rate due to the Pension Tax Charge, which occurs when a taxpayer makes contributions to their pension above the annual (or lifetime) threshold for tax relief.
Devolved Income Tax
Income Tax due on non-savings/non-dividend (NSND) income is devolved to Scotland and Wales. Some individuals may be liable to a different marginal tax rate depending on where they are liable to Income Tax.
From the tax year 2018 to 2019 the Scottish Government introduced new tax bands, rates and thresholds for Scottish Income Tax, diverging from the structure of the UK Government Income Tax system. In addition, from 5 April 2019, the Welsh Government controls the three Welsh Rate of Income Tax (WRIT), which combined with the UK Government rates sets the overall rate paid by Welsh taxpayers. The WRIT impacts the basic, higher and additional rates of income tax; however, for the tax year 2019 to 2020 tax year, these were set such that the overall rates paid by Welsh taxpayers remained the same as elsewhere in the UK in the 2019 to 2020 tax year. These changes are discussed in more detail in the supporting documentation and further statistics are set out in tables 3.16 and 3.17.
For table 3.4, individuals who are classed as Scottish taxpayers and have total taxable NSND income in the starter, basic or intermediate rates for Scottish taxpayers (but no total taxable income above the UK basic rate limit) are classified as a basic rate taxpayer within this publication, or as Income Tax payers below the higher rate. A Scottish Income Tax payer with only savings and/or dividend income within this band (and no total taxable income above the UK basic rate limit) is also classified as a basic rate Income Tax payer.
Individuals who are classed as Scottish taxpayers and have total taxable NSND income in the higher or additional rates (which have different rates to the rest of the UK) are grouped with the equivalent higher and additional rate taxpayers in all other regions. Any remaining cases with positive total taxable income lying at or below the UK government’s basic rate limit (or Scottish basic rate limit for Scottish Income Tax payers) are classified as either savers rate or basic rate Income Tax payers according to the composition of their total taxable income. Individuals with any taxable earnings (NSND income) are classified as basic rate Income Tax payers, while those with solely taxable dividends or taxable savings income exceeding the starting rate limit are classified as ‘savers’ rate Income Tax payers. From the 2015 to 2016 tax year the savings rate below the starting rate limit for savings income was changed to zero and therefore individuals with savings income below the starting rate limit for savings are no longer Income Tax payers.
As the Welsh rates of Income Tax do not currently diverge from the UK Income Tax system, they are classified in line with taxpayers in the rest of the UK and resulting tax liability calculation is the same. Therefore, the tax bands that are applied to all taxpayers in this table are savers rates, basic, higher and additional rates. Please refer to the Income Tax liabilities statistics publication for further details of how the tax liability calculations are performed. A link to this publication can be found here: Income Tax Liabilities Statistics
Scottish and Welsh individuals have been identified on the basis of postcode (rather than the Scottish or Welsh taxpayer indicator, as defined in the supporting documentation) for this table and then the appropriate tax system is applied for each year.
Table 3.4 summary
Most taxpayers (26.5 million, 84%) are basic rate taxpayers and account for £64.9 billion (34%) of tax. Higher rate taxpayers (3.8 million, 12%) account for £62.4 billion (33%) of tax. Additional rate taxpayers (0.4 million, 1%) account for £60.9 billion (32%) of tax.
The number of additional rate taxpayers increased by 22,000 between the tax years 2018 to 2019 and 2019 to 2020 to 421,000. Income Tax liabilities of additional rate taxpayers increased by £2.3 billion to £60.9 billion. The increase was mainly driven by increases in employment income. The growth in the total income and tax liability due to additional rate taxpayers is also partly due to the additional rate threshold remaining unchanged at £150,000. Their share of total tax increased from 31% to 32%.
There was a decrease in the number of higher rate taxpayers (400,000 less than in the tax year 2018 to 2019) and a decrease of £3.2 billion of tax. The decrease is likely to be due to the increase in the income threshold for higher rate tax, which increased from £46,350 in the tax year 2018 to2019 to £50,000 in the tax year 2019 to 2020 and the additional rate threshold being maintained at £150,000, resulting in a narrower higher rate tax band.
The decrease in the overall number of taxpayers (200,000) is likely to be due to the increase in the Personal Allowance, it increased from £11,850 in the tax year 2018 to 2019 to £12,500 in the tax year 2019 to 2020. This represents an increase of 5% which is higher than growth seen in incomes in the tax year 2019 to2020. This has resulted in some individuals now falling below the Personal Allowance and therefore are no longer liable to Income Tax. Despite the increase in the Personal Allowance, the number of taxpayers at the basic rate increased by 200,000 and the basic rate tax liability increased by £3.3 billion since the tax year 2018 to 2019, this is likely to be due to the increase in the higher rate threshold of 8%, which resulted in some individuals moving out of the higher rate band and into the basic rate tax band because this increase is higher than growth seen in incomes in the tax year 2019 to 2020.
Figure 5.1: Taxpayers by their largest source of income, percentages in each marginal rate band
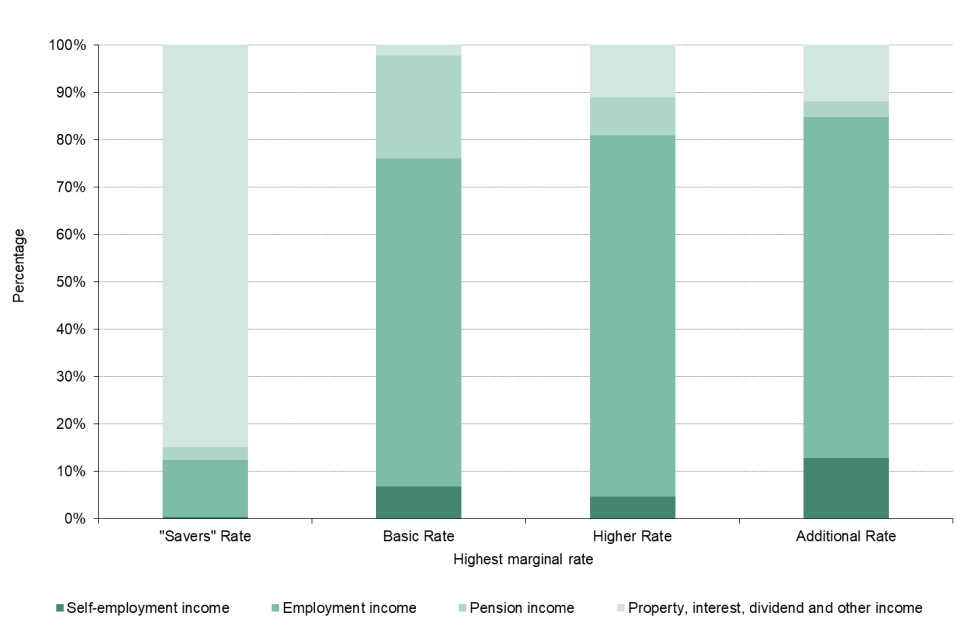
Column chart showing taxpayers by their largest source of income, percentages in each marginal rate band
Source: Survey of Personal Incomes for tax year 2019 to 2020, Table 3.4
Figure 5.1 shows that employment income is the largest source of income for taxpayers in the basic, higher and additional rates. For most taxpayers liable at the starting rate for savings income (or “savers” rate), income from the property, interest, dividend and other income category was their largest source.
Figure 5.2: Income tax from taxpayers by their largest source of income, percentages in each marginal rate band
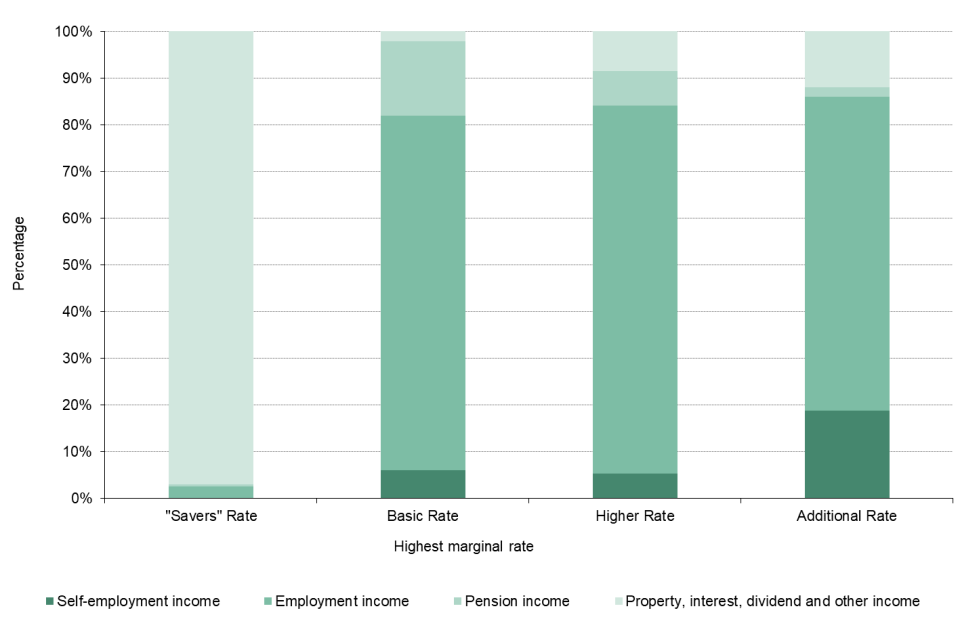
Column chart showing Income tax from taxpayers by their largest source of income, percentages in each marginal rate band
Source: Survey of Personal Incomes for tax year 2019 to 2020, Table 3.4
Figure 5.2 shows that the proportion of tax from self-employment income was larger than average among additional rate taxpayers. Pension income accounted for a larger than average proportion of tax among basic rate taxpayers. At the starting rate for savings income (or “savers” rate), almost all of the tax came from those with property, interest, dividend and other income as their largest source of income.
6. Table 3.5 – Income and deductions, tax year 2019 to 2020
Table 3.5 shows, for ranges of total income, how total income comprises employment, profit and pension income plus property, interest, dividend and other income, the levels of deductions and reliefs and personal allowances set against that income, the Income Tax arising and the amount of income after tax. The table also shows the ratio of tax liabilities to total income as the average rate of tax, the share of total income in each income range and the percentage of total income that arises from (a) profit, employment and pension income, (b) property, interest, dividend and other income and (c) sheltered by deductions and reliefs.
Figure 6.1: Percentage of taxpayers with each income type by range of total income and percentage of income by type and deductions
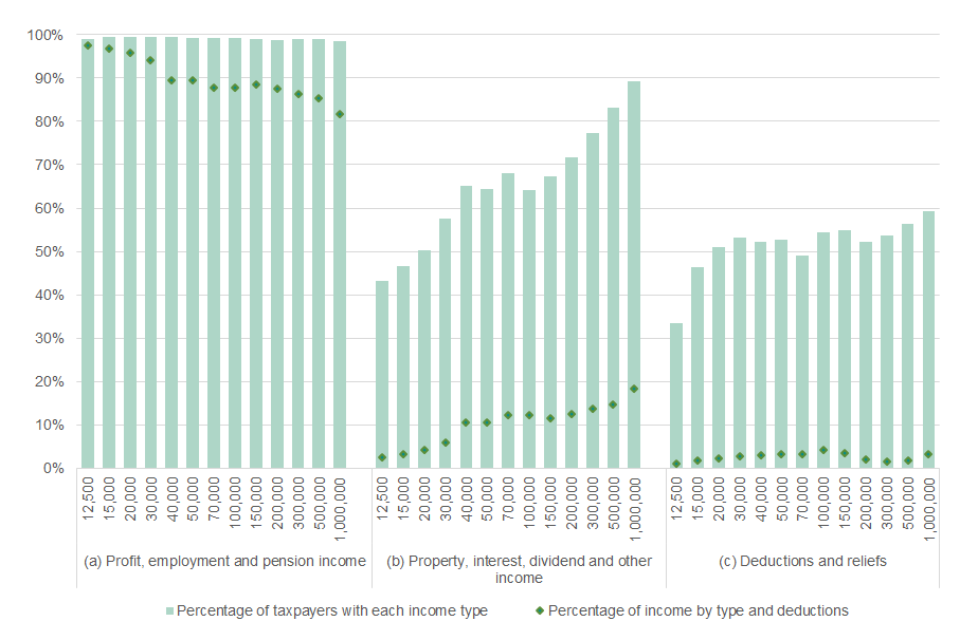
Column chart showing percentage of taxpayers with each income type by range of total income and percentage of income by type and deductions
Source: Survey of Personal Incomes for tax year 2019 to 2020, Table 3.5
Almost all taxpayers had some profit, employment and pension income in (a). The proportion of taxpayers with property, interest, dividend and other income increases as income rises, from 43% in the lowest income range to 89% for incomes above £1 million in (b). The proportion with deductions is relatively stable for income ranges above £20,000 (ranging from 51% to 59%) however decreases as income decreases for income ranges below £20,000, to 33% in the lowest income range in (c).
Employment, profit, and pension income, the largest component of total income, generally accounted for a decreasing share as total income increased in (a). Property, interest, dividend and other income generally accounted for a higher proportion of total income among the highest income ranges compared to the lower ranges in (b). The proportion of total income affected by deductions and reliefs was small, at 2.6% on average; 2.2% or less for incomes under £20,000 and 3.3% in the highest income range in (c).
From tax year ending 2011 the Personal Allowance is reduced by £1 for every £2 of taxable income over £100,000 until fully withdrawn. There are also some taxpayers who are not entitled to a Personal Allowance due to residence/ domicile rules or who choose not to receive it and are taxed on the remittance basis. Finally, the tax charge will include the liability arising from recovery of excess pension relief.
7. Table 3.6 – Profit, employment and pension income, tax year 2019 to 2020
Table 3.6 presents the (a) employment, (b) total profit (self-employment income), (c) state pension and (d) other pension income for taxpayers in each range of total income, the level, average amount and percentage share by type of income along with the percentage of total profit, employment and pension income in each total income range. This table does not include property, interest, dividend and other income. Note that as taxpayers can have more than one type of income in this table, the proportions in Figure 7.1 can sum to more than 100%.
Figure 7.1: Percentage of taxpayers and income, by type and range of total income
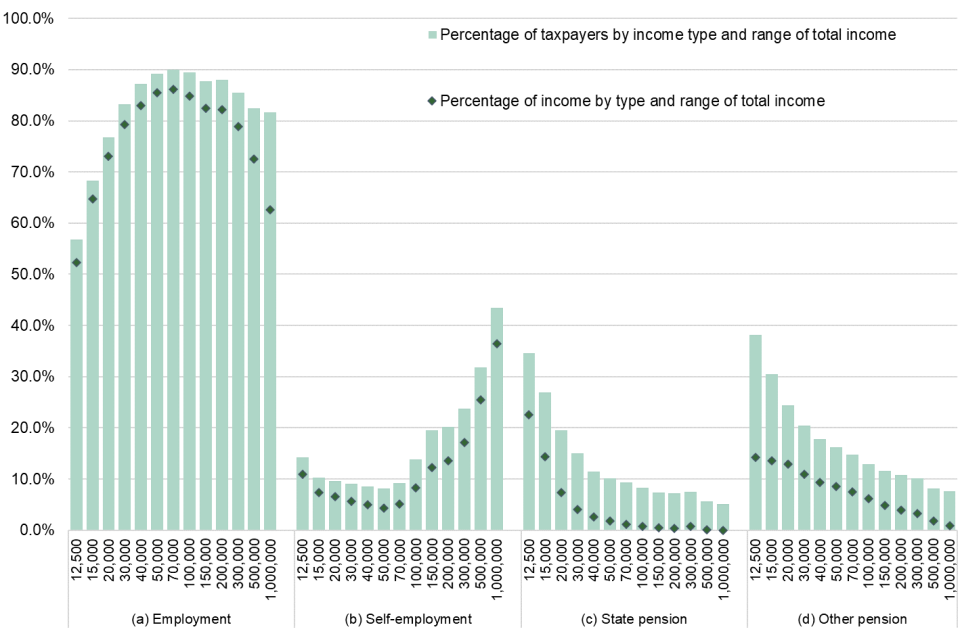
Column chart showing percentage of taxpayers and income, by type and range of total income
Source: Survey of Personal Incomes for tax year 2019 to 2020, Table 3.6
Figure 7.1 shows that in all income ranges taxpayers with employment, self employment profits and pension income are most likely to have employment income, ranging from 57% to 90% in (a). The proportion of taxpayers with self-employment income decreases as income rises for incomes under £70,000 but rises with the income for ranges above £70,000 to reach around 43% for incomes of £1 million and above in (b).
About 20% of taxpayers presented in Figure 7.1 have State pension income and 24% have other pension income in (c, d), with the numbers peaking at 35% and 38% respectively at the lowest income band and decreasing steadily as income increases. This highlights the position of state pensioners and others with pension income within the overall taxpayer income distribution (taxpayers in the lower income ranges are more likely to have pension income).
Employment income accounts for the largest share of income in each income range. Pensions (National Insurance / state pension and all other pensions) account for significant shares of the overall amount where total income is between £12,500 and £30,000. For total income above £1 million the self-employment share is at 36.5%. The self-employment share is at its lowest at around the £50,000 to £70,000 income level at 4.3%.
8. Table 3.7 – Property, interest, dividend and other income, tax year 2019 to 2020
Table 3.7 shows the types of income that comprise (a) property; (b) interest from banks and building societies; (c) dividend and (d) other income for taxpayers in each range of total income. It also shows the level, average amount and percentage share of each of these types of income by total income range.
The proportions can sum to more than 100% because taxpayers can have more than one type of income.
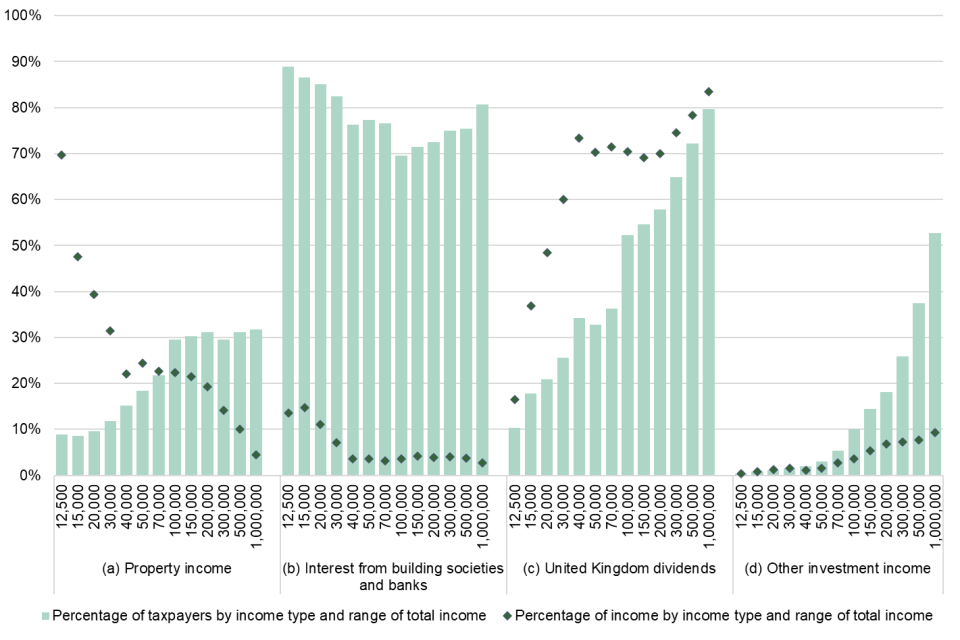
Figure 8.1 (a) shows that the proportion of individuals with property income is less than 15% in income ranges under £50,000. However, it rises with higher incomes to 32% for incomes above £1 million.
Figure 8.1 (b) shows that more than 70% of taxpayers across all income ranges with property, interest, dividend and other income have interest from building societies and banks.
Figure 8.1 (c) shows if someone’s income is less than £30,000 then around 48% or less of their property, interest dividend and other income is from dividends but for higher income ranges the proportion of income from dividends grows, to reach over 84% at the £1 million income range.
Figure 8.1 (d) shows it is relatively rare for taxpayers with total income below £50,000 to have other investment income. However, in the total income ranges between £500,000 and £1 million and over £1 million, 37% and 53% of taxpayers respectively have other investment income.
Figure 8.1: Percentage of taxpayers and percentage of (a) property, (b) interest, (c) dividend and (d) other income by income type and range of total income
Column chart showing percentage of taxpayers and percentage of (a) property, (b) interest, (c) dividend and (d) other income by income type and range of total income
Source: Survey of Personal Incomes for tax year 2019 to 2020, Table 3.7
Figure 8.1 also shows the percentage share of (a) property, (b) interest, (c) dividend and (d) other income attributed to each income type. For example, for individuals in the income range £12,500 to £15,000, 70% of property, interest, dividends and other income is from property, around 14% from interest, around 17% from dividends and a negligible amount from other income.
Amongst total income ranges above £40,000, around 70% is due to dividends while for the ranges below £30,000 of total income dividends account for between 17% and 48% of property, interest, dividend and other income in (c). Interest accounts for around 14% of income from property, interest, dividends and other income in the lower income bands, below 20,000. However, it falls sharply and to less than 3% in higher income ranges in (b). Property income declines as a share of property, interest, dividend and other income from just under 70% at lower income levels to around 5% for total incomes of £1 million or more in (a).
The tax year 2019 to 2020 statistics include the effects of the Landlords Interest Restriction. From 6 April 2017, landlords are no longer able to deduct all of their finance costs from their property income to arrive at their profits. Instead, they receive a basic rate reduction from their Income Tax liability for their finance costs. This restriction is being tapered in over 4 years. In the tax year 2019 to 2020 deductions for finance costs were restricted to 25%, therefore the property income that is subject to tax in these tables is higher than in previous years. The remaining 75% of finance costs are given as a tax relief at basic rate which is accounted for in the total tax liability.
The number of taxpayers with income from banks and building societies increased from 10.5 million to 13.9 million. The amount of interest from banks and building societies also increased from £4.3 billion to £5 billion. The increase is likely to be largely due to some operational changes, and higher interest rates in the tax year 2019 to 2020 than the tax year 2018 to 2019. Since the tax year 2018 to 2019 release, data on interest from banks and building societies have been received through National Insurance and PAYE Service data (as well as Self-Assessment data) and no longer estimated through imputation. There were two uploads of data from banks and building societies in the tax year 2019 to 2020 in order to capture late submissions compared to only one upload the previous year.
9. Table 3.8 – Deductions and reliefs, tax year 2019 to 2020
Table 3.8 shows the size and relative importance of each relief type by income range and the share of total deductions and reliefs that arise in each total income range.
Deductions and reliefs are the amounts deducted from total income, along with personal allowances, to arrive at the amount of taxable income subject to an Income Tax charge. This includes amounts for contributions to ‘net pay’ and ‘relief at source’ pensions, and a variety of other deductions and reliefs including charitable giving and loss relief etc. Please see the supporting documentation for further details.
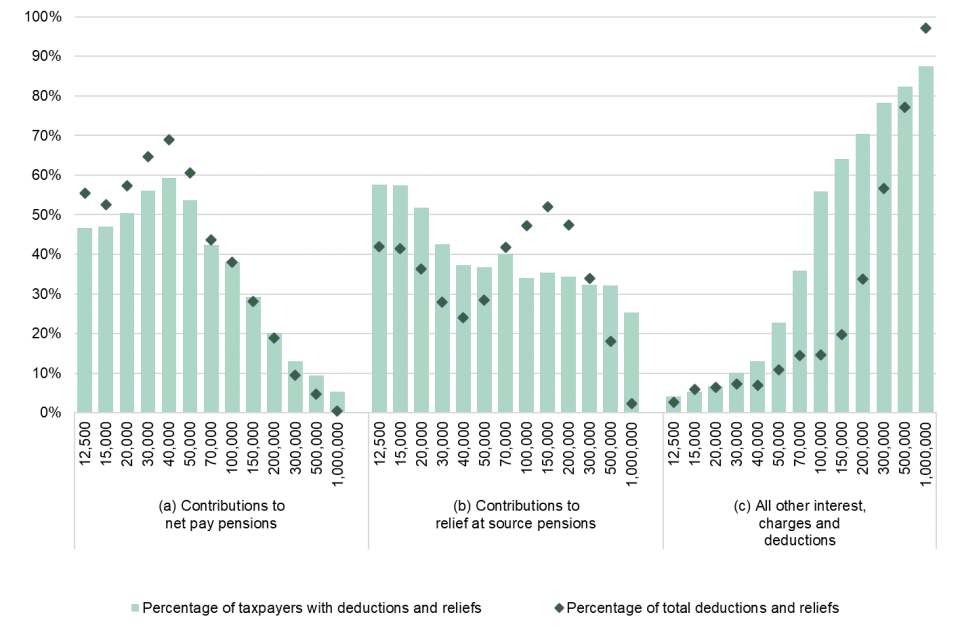
Figure 9.1: Percentage of taxpayers who have deductions and reliefs, and percentage of all deductions and reliefs by type and range of total income
Column chart showing percentage of taxpayers who have deductions and reliefs, and percentage of all deductions and reliefs by type and range of total income
Source: Survey of Personal Incomes for tax year 2019 to 2020, Table 3.8
Figure 9.1 provides analysis of the taxpayers who have deductions and reliefs only. The chart shows what the proportion of all taxpayers with deductions and reliefs have each type of deduction and relief. It also shows the share of total deductions and reliefs accounted for by each type.
Across all ranges of total income, between 5% and 59% of the taxpayers in this group have reliefs for contributions to net pay pensions. The likelihood of having such a relief exceeds 46% where total income is below £70,000. Where total income is above £70,000 the likelihood of having such a relief decreases as income increases.
Looking at the taxpayers with deductions only, the proportion of those with relief at source pension contributions varies from between 25% for those with income over £1 million to 58% for those in the lowest income range.
The proportion of taxpayers with reliefs for other interest, charges and deductions is at most 13% in income ranges under £50,000. However, for incomes over £50,000 the proportion rises steeply alongside income and reaches a high of 88% for total incomes of £1 million and higher. Note that taxpayers may have more than one relief type, so the proportions can sum to more than 100%.
In figure 9.1 (a), contributions to net pay pensions account for between 1% to 69% of all deductions and reliefs, depending on total income. They exceed 52% of all deductions and reliefs where total income is less than £70,000 but fall to 19% and below where total income exceeds £200,000.
In figure 9.1 (b), contributions to relief at source pensions account for around 2% to 52% of all deductions and reliefs, again depending on total income. They exceed 18% in income ranges from £70,000 to £1 million. But for incomes above £1 million, they only account for around 2% of total deductions and reliefs. Notably, the income bands which receive the largest proportion of deductions are the lowest income band and those in the £70,000 to £300,000 range.
In figure 9.1 (c), for total income below £200,000, other deductions and reliefs account for at most 20% of total deductions and reliefs which tails off to close to zero at lower income ranges. For higher incomes, such reliefs account for an increasing share as income rises, rising sharply and peaking at 97% for incomes over £1 million.
10. Table 3.9 – Self-employment income assessable to tax, 2019 to 2020
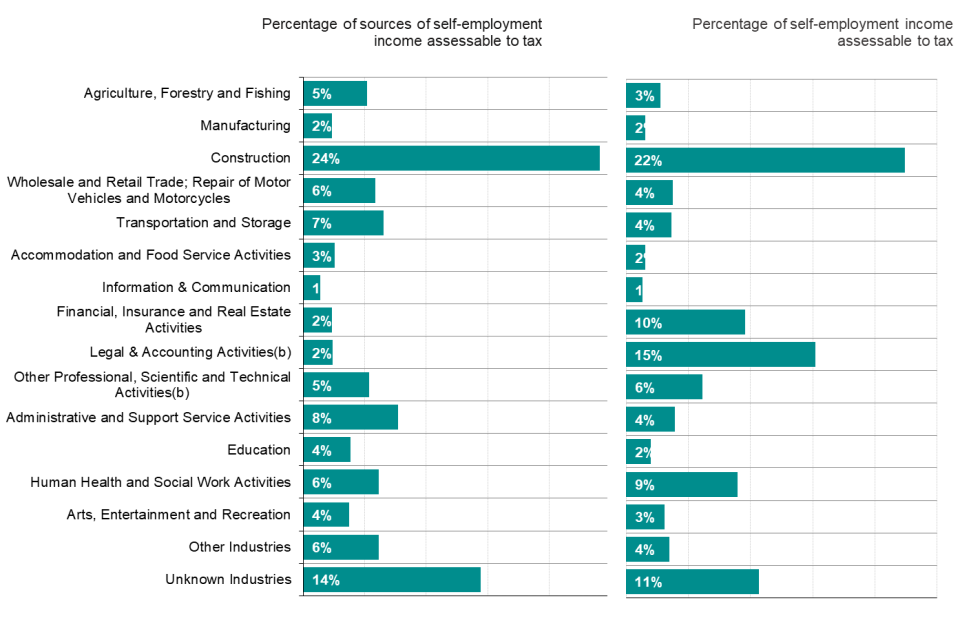
Sources of income for individuals by range and industry
The sources of all individuals with self-employment income in the survey, whether taxpayers or not, are included in this table. The figure shows the proportion of sources and profit by industry group based on Standard Industry Classification (SIC) 2007. The supporting documentation shows the composition of each category in the table.
An individual may have several instances of self-employment income from activity both as a sole trader and as a partner in a partnership. Therefore, an individual may have two or more sources of self-employed income. Where there are multiple instances as a sole trader, one instance is designated the primary source and all other instances are amalgamated into a single secondary source. Similarly, for multiple instances of partner income, one instance is designated the primary source and all other instances are amalgamated into a single secondary source. Where multiple instances exist, the secondary source record contains the sum of income amounts and is allocated to the industry of the most significant of those secondary sources. Consequently, the table may count up to four sources of self-employment income for each individual. The number of individuals underlying this table is shown in Table 3.10.
Table 3.9 shows that there were 5.48 million self-employment sources, accounting for £99.9 billion profit. The loss making sources are shown in the zero range of self-employment income.
This table shows that the industry which accounts for the highest share of sources and profit is the construction industry with 24% of all sources and 22% of all profits. Legal & Accounting Activities; Financial, Insurance and Real Estate Activities; and Human Health and Social Work Activities each account for a significantly higher proportion of total profit than number of sources, indicating average profits above the norm.
Figure 10.1: Self-employment income sources and percentage of self-employment income assessable to tax
Bar chart showing self-employment income sources and percentage of self-employment income assessable to tax
Source: Survey of Personal Incomes for tax year 2019 to 2020, Table 3.9
11. Table 3.10 – Income of individuals with self-employment sources, tax year 2019 to 2020
By range of self-employment income and source
Table 3.10 sets out information about self-employment income for individuals whether they are taxpayers or not. It shows, for ranges of self-employment income, the composition of total income, average total income and the proportion of total income that is accounted for by self-employment income.
The sources of all individuals with self-employment income in the survey, whether taxpayers or not, are included in this table.
The number of individuals with at least one self-employment income source is 5.33 million, of which 3.18 million are taxpayers (Table 3.6).
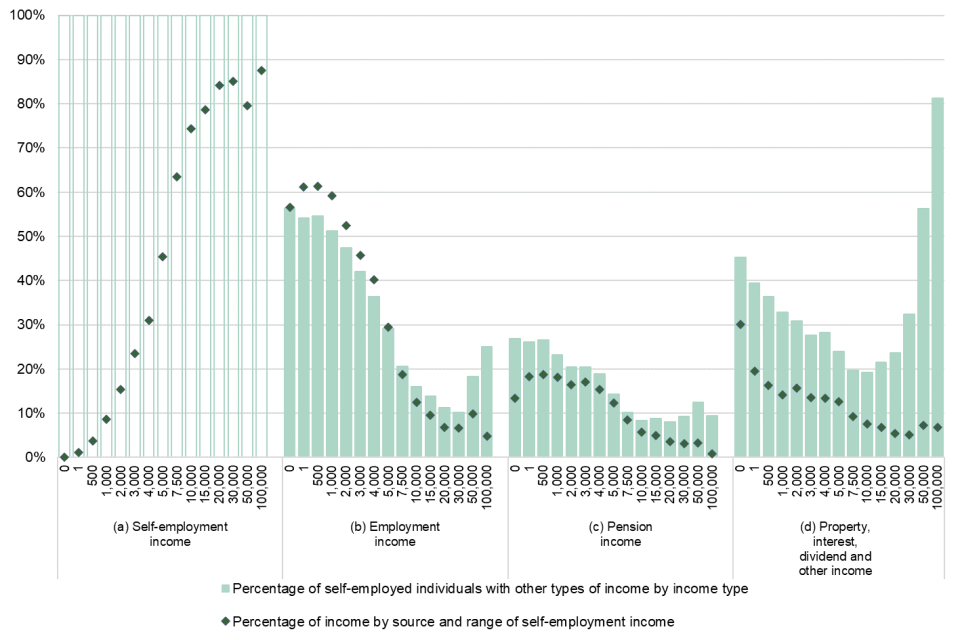
Figure 11.1: Income from self-employed individuals with other income sources
Column chart showing income from self-employed individuals with other income sources
Source: Survey of Personal Incomes for tax year 2019 to 2020, Table 3.10
Figure 11.1 looks at the forms of income received by those with some self-employment income.
The proportion of self-employed individuals with employment income varies between 10% and 56%. Over half of the individuals in the low profits or loss making income bands also receive employment income, with the proportions decreasing to around 10% for those making profits of up to £50,000. There is a significant increase in the number of individuals with employment income at the top end (25%), however, these profits account for a small proportion of their overall income (5%).
The proportion of cases with pension income is 20% or more for profit levels under £3,000 and fluctuates between around 8% and 12% for higher income ranges (above 10,000).
The proportion with property, dividend and other income is at 31% or higher in the lowest profit ranges (below £3,000) but falls to about 19% for profits from £7,500 and under £15,000, then rises with income to 81% where profits are £100,000 or more.
For individuals with self-employment income of £5,000 or more, their self-employment income is the largest income type and it constitutes 45% to 88% of total income. At lower profit levels, the proportion of total income accounted for by employment income predominates and peaks at 61%.
12. Table 3.11 – Income and tax, by gender, region and country, tax year 2019 to 2020
Table 3.11 shows the sources of income that comprise total income and tax for taxpayers in each total income band by gender, region and country.
Figure 12.1: Number of taxpayers and Income type by region/country
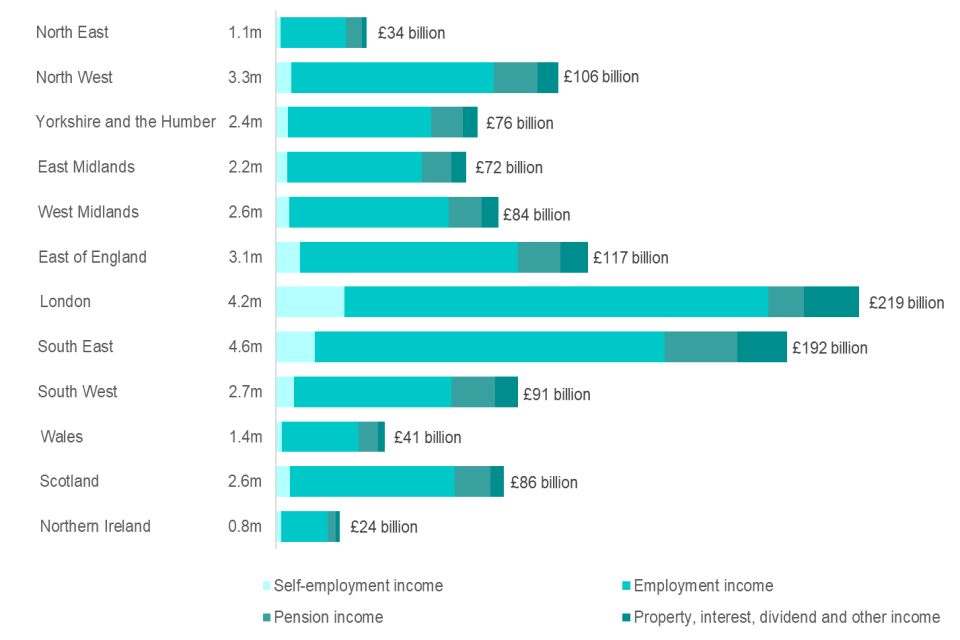
Bar chart showing number of taxpayers and Income type by region/country
Source: Survey of Personal Incomes for tax year 2019 to 2020, Table 3.11
Figure 12.1 shows that the South East had the highest number of taxpayers (4.6 million), followed by London (4.2 million). In contrast, Northern Ireland had the lowest number of taxpayers (0.8 million).
The figure also shows that London had the highest amount of total income (£219 billion), followed by the South East (£192 billion). Northern Ireland had the least total income (£24 billion).
13. Tables 3.16 and 3.17 – Income tax liabilities on non-savings/non-dividend income for Scotland, Wales and the rest of the UK, tax year 2019 to 2020
Tables 3.16 and 3.17 reflect the devolution of Income Tax to Scotland and Wales. They show estimates constructed from the SPI of the amount of tax that is due from non-savings/ non-dividend (NSND) income, ‘earned income’.
Figure 13.1: The number of taxpayers and Income Tax due on earned income based on the Scottish and Welsh taxpayer indicators and the residential postcodes in Scotland and Wales
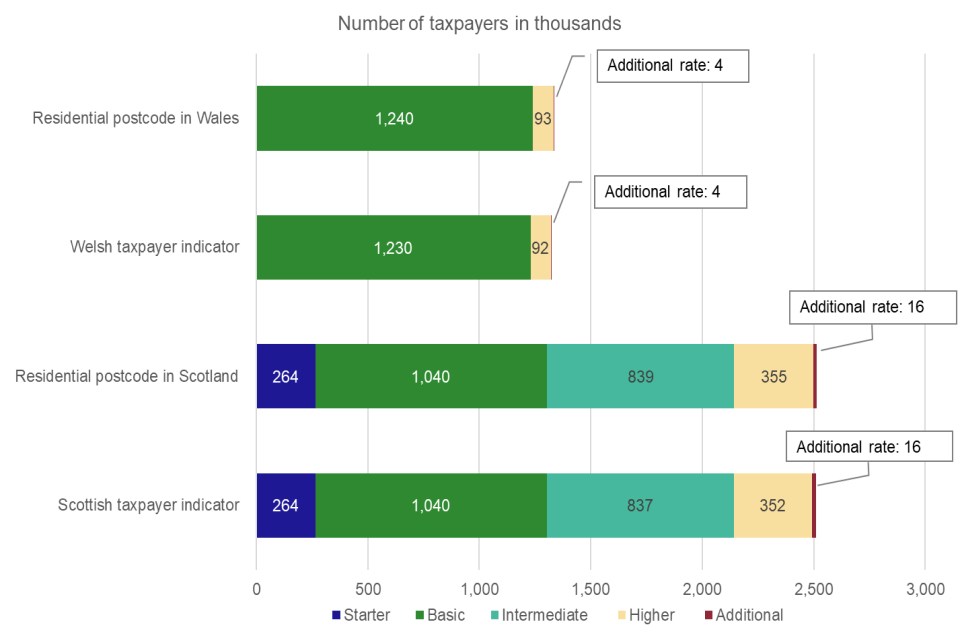
Bar chart showing the number of taxpayers and Income Tax due on earned income based on the Scottish and Welsh taxpayer indicators and the residential postcodes in Scotland and Wales
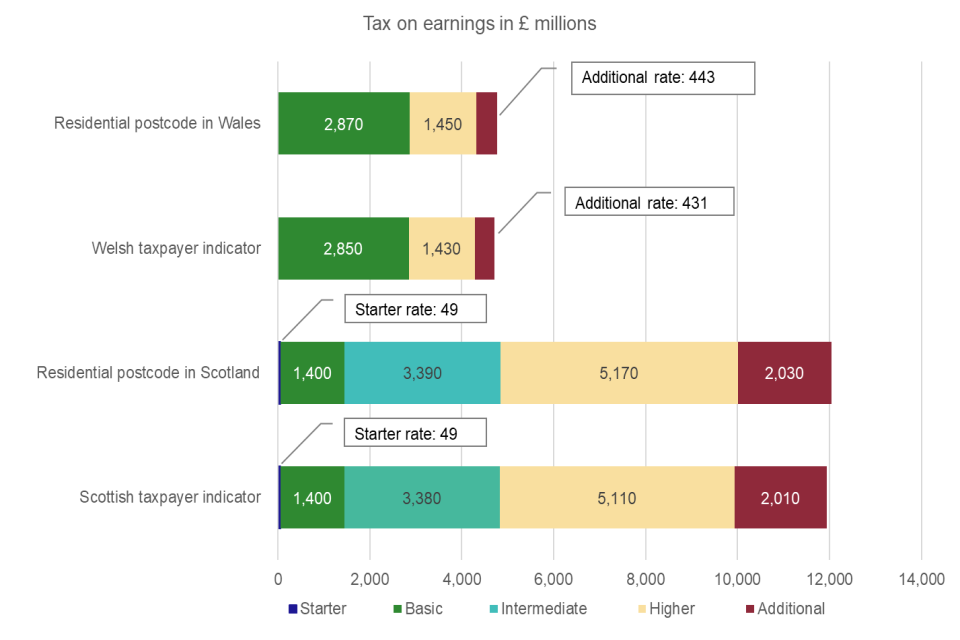
Bar chart showing the number of taxpayers and Income Tax due on earned income based on the Scottish and Welsh taxpayer indicators and the residential postcodes in Scotland and Wales
Source: Survey of Personal Incomes for tax year 2019 to 2020, Table 3.16 and Table 3.17
Table 3.16 presents estimates of the number of taxpayers and Income Tax due on earned income for Scottish taxpayers, Welsh taxpayers and taxpayers in the rest of the UK (rUK) for tax year 2019 to 2020. Please refer to the supporting documentation for further information on Scottish and Welsh Income tax applicable for this tax year.
Table 3.17 presents estimates of the number of taxpayers and Income Tax due on earned income based on the residential postcode of the taxpayer. It shows separate figures for taxpayers with a residential postcode in Scotland or Wales and those with a residential postcode in rUK. This table classifies each individual based on their residential postcode on 5th April 2020, the end of tax year 2019 to 2020.
These tables reflect the Scottish Income Tax bands and rates first introduced in the tax year 2016 to 2017 and new Welsh Income Tax bands which are applicable from 5 April 2019. The five tax rates for Scottish taxpayers remain the same as the 2018 to 2019 tax year, however, the higher rate threshold for UK increased to £50,000 in 2019 to 2020 but remained unchanged at £43,430 for Scotland. From April 2019, the UK government reduced each of the three main rates of income tax – basic, higher and additional rate – paid by Welsh taxpayers by 10 percentage points (ppts). The Wales Act 2014 enables the Welsh Government to control the three Welsh Rates of Income Tax (WRIT) which are added to the reduced UK Government rates. These were all set at 10 ppts for the 2019 to 2020 tax year. The combination of reduced UK rates plus the Welsh rates determine the overall rate of income tax paid by Welsh taxpayers, so the overall rates paid by Welsh taxpayers remained the same as elsewhere in the UK in the 2019 to 2020 tax year.
Comparison between the two tables shows that, overall, the differences between classifying taxpayers based on their residential postcode and using the Scottish or Welsh taxpayer indicators are relatively small. Slightly more taxpayers are identified as having a Scottish or Welsh residential postcode at the end of the tax year as compared with those having a corresponding Scottish or Welsh taxpayer indicator. There were 2.52 million taxpayers with Scottish postcodes compared with 2.51 million individuals with a Scottish taxpayer indicator in the 2019 to 2020 tax year. Additionally, there were 1.34 million taxpayers with Welsh postcodes compared with 1.33 million individuals with a Welsh taxpayer indicator the 2019 to 2020 tax year. The total tax on earnings was also slightly higher for those with residential addresses in Scotland and Wales at the end of the tax year at £12.0 billion for Scottish residents compared to £11.9 billion for taxpayers using the Scottish taxpayer indicator and £4.76 billion for Welsh residents compared to £4.71 billion for those with a Welsh taxpayer indicator.
14. Related publications
Income Tax liabilities HMRC also produce statistics on Income Tax liabilities. Use these to find out detailed breakdowns of the number of people paying Income Tax and the distribution of Income Tax liabilities across taxpayers and tax bands.
PAYE Real Time Information (RTI) Statistics Experimental monthly estimates of pay rolled employees and their pay from HM Revenue and Customs’ (HMRC’s) Pay As You Earn (PAYE) Real Time Information (RTI) data. This is a joint release between HMRC and the Office for National Statistics (ONS).
ONS guide to sources of data on income and earnings This guide outlines the different data sources and outputs that feed into the analysis of income and earnings within the UK. It explains important information for each data source, including what data are available and the sources’ main uses, strengths and limitations.
GSS interactive tool The Government Statistic Service has also produced a tool to browse income and earnings official statistics and can be found at the following link: GSS Income and Earnings interactive tool
15. Contact Information
If you have any queries regarding this publication, please use the contact information below to get in touch.
Statistical contact: M Whent, spi.enquiries@hmrc.gov.uk
Media contact: HMRC Press Office, news.desk@hmrc.gov.uk
Website: Personal Income Statistics
Frequency: Published annually
Publication date: 16 March 2022
Next publication date: February/ March 2023