Perceptions of Vocational and Technical Qualifications in England - wave 5
Published 7 July 2022
Applies to England

© Crown copyright 2022
This publication is licensed under the terms of the Open Government Licence v3.0 except where otherwise stated. To view this licence, visit nationalarchives.gov.uk/doc/open-government-licence/version/3 or write to the Information Policy Team, The National Archives, Kew, London TW9 4DU, or email: psi@nationalarchives.gov.uk.
Where we have identified any third party copyright information you will need to obtain permission from the copyright holders concerned.
This publication is available at https://www.gov.uk/government/statistics/perceptions-of-vocational-and-technical-qualifications-wave-5/perceptions-of-vocational-and-technical-qualifications-in-england-wave-5
Executive summary
Background
This report presents the findings of wave 5 of the Perceptions of vocational and technical qualifications survey and should be read alongside the background information document. To best appreciate the display of the data, this report should be viewed in colour.
The project was commissioned by Ofqual and conducted by YouGov. The aim of this longitudinal study is to investigate learners’, providers’ and employers’ perceptions of vocational and technical qualifications in England. In the context of this report, “learners” refers to students and apprentices of all ages. The survey also explored perceptions of a number of topical aspects of the system for vocational and technical qualifications.
The survey was conducted using an online method. The fieldwork for this wave was conducted between 21 December 2021 to 14 February 2022.
The final achieved samples were structured to be representative of the relevant target populations. While the sampling approach aimed to identify groups of participants who were representative, given that a survey of this kind only captures the views of those involved, throughout this report responses attributed to groups reflect only those respondents included in the study. Further information on sampling and methodology is available in the accompanying background information document.
YouGov have conducted the wave3, wave 4 and wave 5 surveys, using a consistent sampling approach and survey mode. YouGov and Ofqual urge caution when drawing conclusions based on differences in the data in comparison with wave 1 and wave 2. This is due to key changes in the sampling approach and survey mode which were put in place for later waves:
-
the sample for learners and employers was drawn from the YouGov panel in waves 3, 4 and 5, as well as a portion of the provider group sample. By comparison, each sample was selected from targeted contact databases in previous waves
-
fieldwork for the employers’ survey was conducted online in waves 3, 4 and 5, whereas in previous waves it was done by telephone
-
weighting was applied to the waves 3, 4 and 5 results to produce representative samples, which was not done previously
Throughout the report, all references to differences in findings between waves and stakeholder groups refer to statistically significant differences (at a level of significance of 0.95). In some instances, apparent differences between figures may not be considered ‘statistically significant’ due to sample sizes. Non-statistically significant findings do not necessarily mean that no change has occurred (for example year on year), but a failure to detect differences due to change, from differences due to sampling variation.
There are various charts throughout the report that report on levels of agreement and disagreement. Please note that although not shown, there were also options provided in the survey for “Neither agree nor disagree” and “Don’t know”. Where the sum of the proportion who agreed and disagreed appears particularly low, this is due to the fact that large proportions of respondents fit within these other response categories.
Throughout the analysis, organisations are categorised by number of employees into four categories: micro (2 to 9 employees), small (10 to 49 employees), medium (50 to 249 employees) and large (250+ employees) organisations.
The circumstances in 2020 and 2021
The outbreak of the coronavirus (COVID-19) pandemic, and the resulting measures applied across England from March 2020, has had a multitude of impacts on the education sector. For significant parts of 2020 and 2021, schools and colleges in England were closed and there was a shift to remote and online learning for almost all students. Given the unusual and unprecedented circumstances of that year, formal assessments and exams for vocational and technical qualifications did not take place; likewise this was the case for GCSEs, AS and A Levels. Ofqual has established rules that allow alternative arrangements, and further information on these can be found in the background notes document.
Given the uniqueness of 2020 and 2021, the wave 4 and 5 surveys included a 2020 or 2021 specific section to gauge perceptions of vocational and technical qualifications based solely on that year. Where the original perceptions questions were asked upfront in the survey, respondents were asked to think about each of these qualifications generally and were informed that a 2020 or 2021 section would follow later in the survey. These modifications were made so that we could track key measures over time despite that exceptional year.
Key findings
Perceptions of the qualifications system in 2021
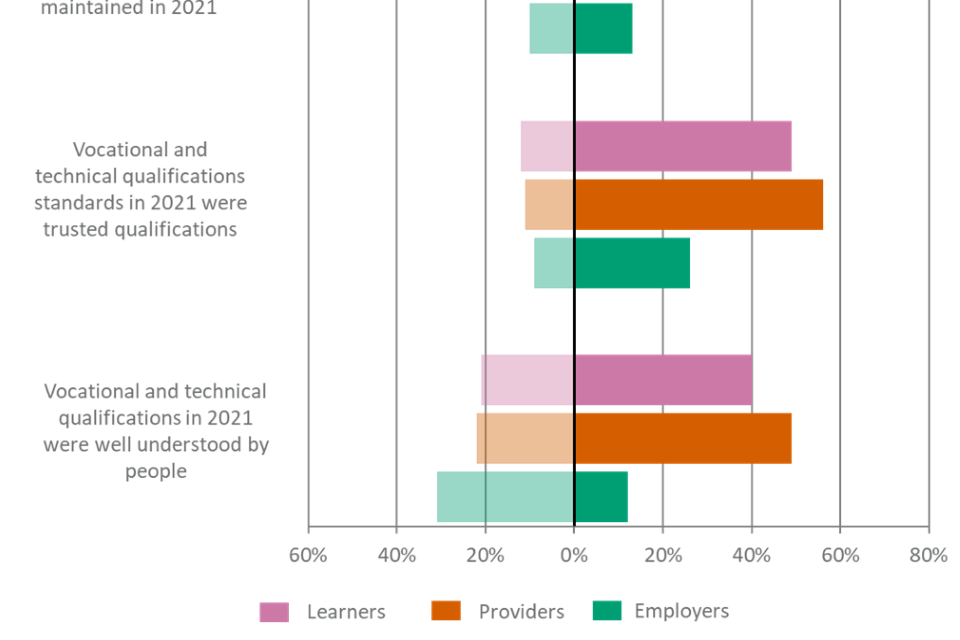
Overall, providers and learners were more positive than employers towards each qualification type in 2021. It is worth noting, however, that employers were particularly likely to return neutral responses such as “Don’t know” or “Neither agree nor disagree”, rather than specifically indicating either agreement or disagreement. There was relatively high agreement that in 2021 vocational and technical qualifications (VTQs) were trusted qualifications among providers (56%) and learners (49%) compared to just 26% of employers. This was also the case for Functional Skills qualifications (FSQs), where providers (51%) and learners (45%) were more likely to agree that in 2021 FSQs were trusted qualifications than employers (15%) were. The same patterns were seen for end-point assessment of apprenticeships (EPAs), with providers (43%) and learners (29%) again being more likely to agree it was a trusted qualifications than employers (15%).
Learner perceptions
In general, learners were knowledgeable about VTQs, FSQs, and apprenticeship EPAs, often having similar perceptions to providers. Approximately two-thirds (69%) of learners agreed that they understand the purpose of VTQs, which has decreased slightly from 74% in wave 4 (although this level was comparable to wave 3).
Around three-fifths (58%) of learners said that they value FSQs, with a similar proportion agreeing that these qualifications offer good value for money (56%). These figures were broadly comparable to wave 4 findings.
When it comes to key reasons why learners had undertaken an FSQ in the previous three years, the most common were to progress in their studies (32%) or to improve their English, maths or ICT skills (31%). Among learners who had started taking an FSQ, the top perceived benefits of doing so were to be more confident using (27%) or improving (29%) their English, maths or ICT skills.
Comparably, it was most common for learners to say that they decided to take an apprenticeship because they can learn new skills on the job (37%), in order to find a better job (30%), or to improve their skills (28%). Learners also had a lower understanding of apprenticeship EPAs than providers, but higher than employers, with under half (45%) of learners reporting a good (very or quite good) understanding.
All provider perceptions
Overall, providers were more knowledgeable and showed higher levels of agreement towards each of the qualifications than learners and employers. This was the case for VTQs, FSQs and apprenticeship EPAs.
The vast majority of providers (85%, a decrease from 92% in wave 4) reported that they value VTQs, compared to 71% of learners and 45% of employers, which was comparable to wave 4. Approximately two-thirds (68%) agreed that VTQs offer value for money among providers, which was a decrease from 76% in wave 4. This was, however, comparable (not statistically different) to wave 3 (63%).
Providers were also the most likely group to agree that they value FSQs, with 65% agreeing. This finding was also observed in wave 4. Just under half of providers (47%) agreed that FSQs offer value for money, which was again broadly comparable to wave 4.
Understanding of apprenticeship EPAs was higher among the provider group in comparison with employers, with three-fifths (58%) of the provider group reporting having a very or quite good understanding of these. This was comparable with wave 4 (61%).
Awareness that EPAs are specific to apprenticeship standards was also highest among the provider group at 78%, followed by learners (69%), with employers reporting a much lower understanding (18%). These figures were broadly comparable with wave 4 findings.
Employer perceptions
In comparison with providers and learners, employers tended to be less knowledgeable and less positive about qualifications. As previously observed, employers were particularly likely to return neutral responses. This was the case for VTQs, FSQs and apprenticeship EPAs. Whilst over two-fifths (45%) of employers reported that they value VTQs (comparable with wave 3 findings), this was lower than the value reported amongst the provider and learner groups. A similar proportion of employers (42%) also reported having a very or quite good understanding of VTQs. Employers’ understanding of FSQs was lower than of VTQs, with approximately one in four (26%) having a very or quite good understanding of them, which was broadly comparable with wave 4 levels (28%).
Organisation size remained a key factor influencing levels of understanding of qualifications and EPAs and employers’ likelihood of holding positive perceptions of them. Large employers were more likely than smaller employers to be aware of each of the qualifications. Additionally, among employers who have at least some understanding of apprenticeship EPAs in their sector, 15% reported having a very or quite good understanding of apprenticeship EPAs, the same proportion as wave 4.
Section 1: Perceptions of vocational and technical qualifications, Functional Skills qualifications and end-point assessments in 2021
For waves 4 and 5, a new series of questions were added to the survey to investigate perceptions specific to the qualifications system in 2020 and 2021.
These questions were asked alongside questions asking about general perceptions of each qualification. For example, all stakeholder groups were presented with statements and questions such as:
-
vocational and technical qualifications are good preparation for further study
-
vocational and technical qualifications in 2021 were good preparation for further study
This section of the report explores the general perceptions of VTQs, FSQs and EPAs of assessments in relation to 2021.
Key findings – Perceptions of VTQs, FSQs and EPAs in 2021
-
Overall, providers and learners were more positive about each qualification type in 2021 than employers, as also seen in 2020. For example, they were more likely to agree that each was good preparation for work and study, and well understood by people.
-
There was higher agreement among providers (56%) than among learners (49%) that in 2021 VTQs were trusted qualifications, with less agreement indicated among employers (26%).
-
This was also the case for FSQs, where providers (51%) and learners (45%) were more likely to agree than employers (17%).
-
The same patterns were seen for EPAs, though overall trust was slightly lower. Providers (43%) and learners (39%) had higher agreement than employers (15%).
-
Almost the same proportion of each stakeholder group agreed that each qualification was good preparation for both work and further study in 2021. For example, 65% of providers agreed that VTQs were good preparation for work, and 62% for further study. Among employers, a lower proportion agreed that VTQs were good preparation for work (31%) and further study (28%).
Perceptions of Vocational and Technical Qualifications, Functional Skills qualifications and end-point assessments in 2021
For figures 1, 2 and 3, the wave 5 unweighted base is: All employers, n=2,002, all providers, n=539, all learners, n=533.
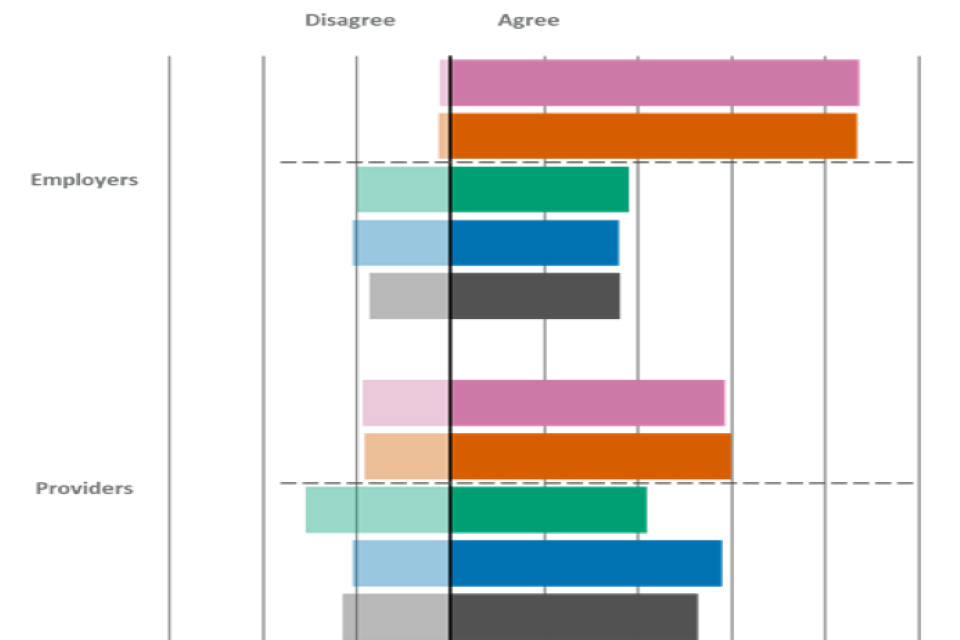
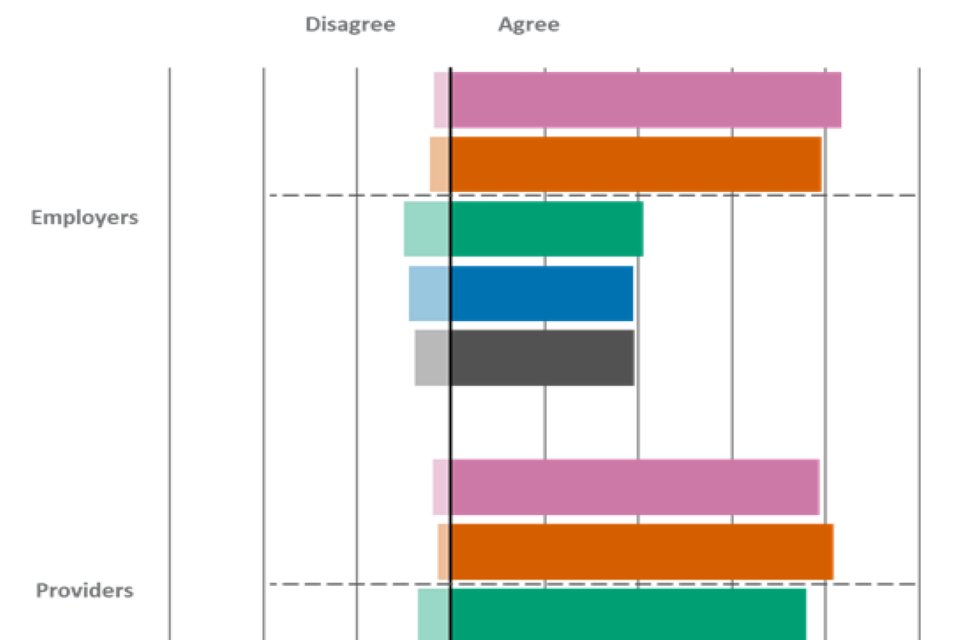
Overall, as shown in Figure 1, providers and learners were more positive about VTQs in 2021 than employers, as also seen in 2020. For example, they were more likely to agree that they were good preparation for work and further study, and well understood by people. The results below were comparable with 2020 findings, when we asked about qualifications in 2020 specifically.
Approximately three in five providers agreed that in 2021, VTQs were good preparation for work (65%) and further study (62%). These were also the statements about VTQs that learners were most likely to agree with, with similar proportions saying they were good preparation for work (54%) and further study (57%).
There was relatively high agreement that in 2021 VTQs were trusted qualifications among providers (56%) and learners (49%), with less agreement indicated among employers (26%).
Reflecting on 2021, 49% of providers and 40% of learners agreed that VTQs were well understood by people. Only 12% of employers agreed and a sizeable minority (29%) said they did not know. In fact, for each of the statements shown in figure 1, a relatively high proportion of employers were unsure.
Approximately half (48%) of providers, 39% of learners and 13% of employers agreed that in 2021 standards were maintained in VTQs.
Figure 1. Results for perceptions of VTQs in 2021 (Learners, Providers, Employers)
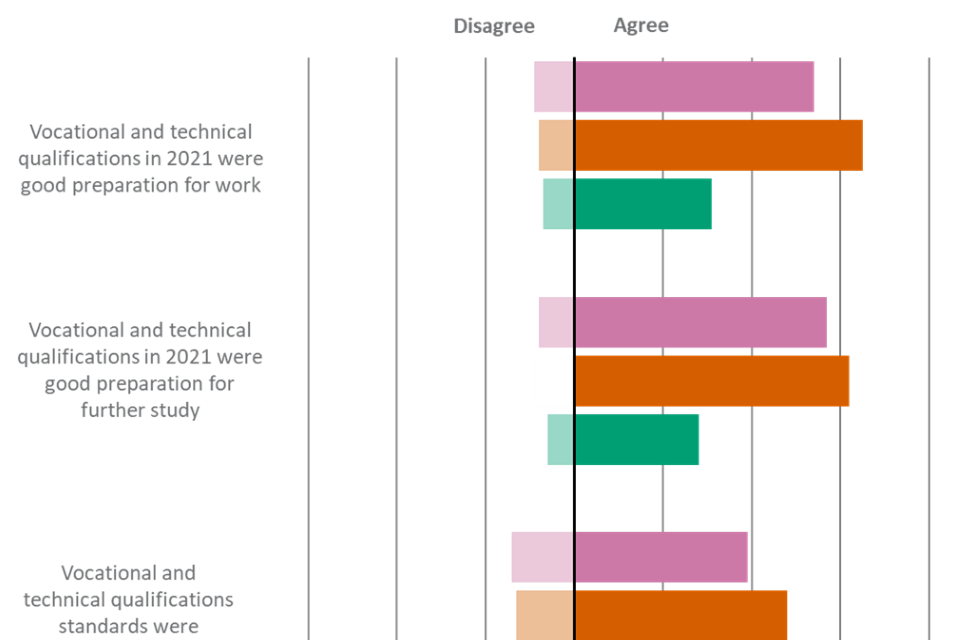
Note: There were also options provided in the survey for “Neither agree nor disagree” and “Don’t know”. Where the sum of the proportion who agreed and disagreed appears particularly low, this is due to the fact that large proportions of respondents fit within these other response categories.
| Statement | Employers - Agree | Employers - Disagree | Providers - Agree | Providers - Disagree | Learners - Agree | Learners - Disagree |
|---|---|---|---|---|---|---|
| Vocational and technical qualifications in 2021 were good preparation for work | 31% | 7% | 65% | 8% | 54% | 9% |
| Vocational and technical qualifications in 2021 were good preparation for further study | 28% | 6% | 62% | 9% | 57% | 8% |
| Vocational and technical qualifications standards were maintained in 2021 | 13% | 10% | 48% | 13% | 39% | 14% |
| Vocational and technical qualifications in 2021 were trusted qualifications | 26% | 9% | 56% | 11% | 49% | 12% |
| Vocational and technical qualifications in 2021 were well understood by people | 12% | 31% | 49% | 22% | 40% | 21% |
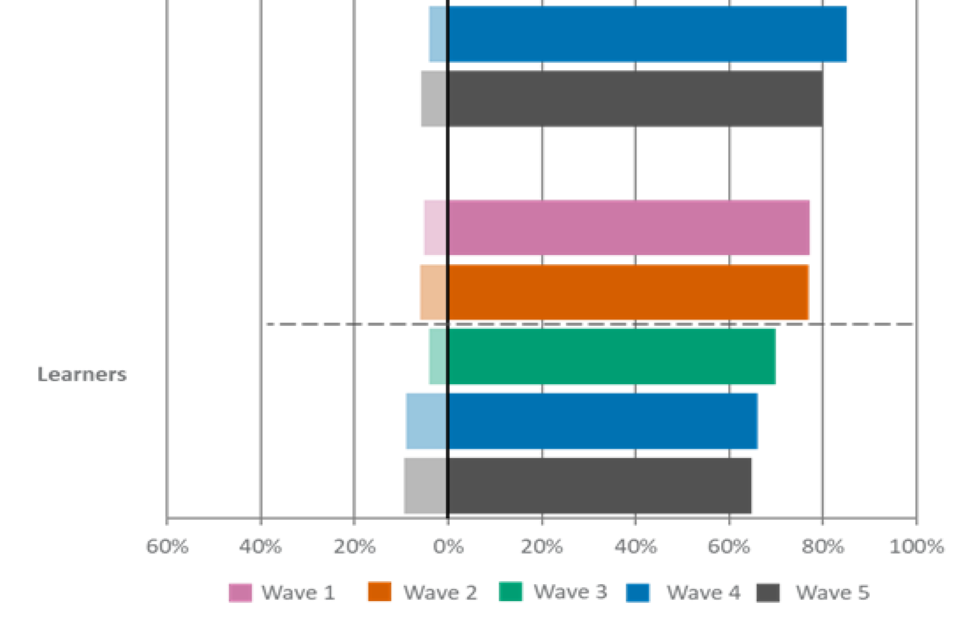
Overall, as shown in Figure 2, providers and learners were also more positive about FSQs in 2021 than employers, as seen in 2020. The results below were comparable with 2020 findings, when we asked about qualifications in 2020 specifically.
Providers were most likely to agree that in 2021 FSQs were trusted qualifications (51%). Agreement was also higher among learners (45%), than among employers (17%). Agreement that FSQs in 2021 were well understood by people was slightly lower for each group, though again this was comparable with 2020 findings. It was highest among learners (41%) and providers (39%), and much lower among employers (dropping to 11%). This was due to a large proportion (40%) saying they did not know, as opposed to disagreement (22%).
Reflecting on 2021, 45% of providers and 40% of learners agreed that FSQs standards were maintained that year, higher than for employers (12%).
When thinking about whether FSQs in 2021 were good preparation, perceptions among providers and learners were similar. Approximately half of providers agreed that in 2021 FSQs were good preparation for further study (49%) or work (48%). Almost the same proportion of learners agreed that in 2020 FSQs were good preparation for further study (52%) and work (49%).
Figure 2. Results for perceptions of Functional Skills qualifications in 2021 (Learners, Providers, Employers)
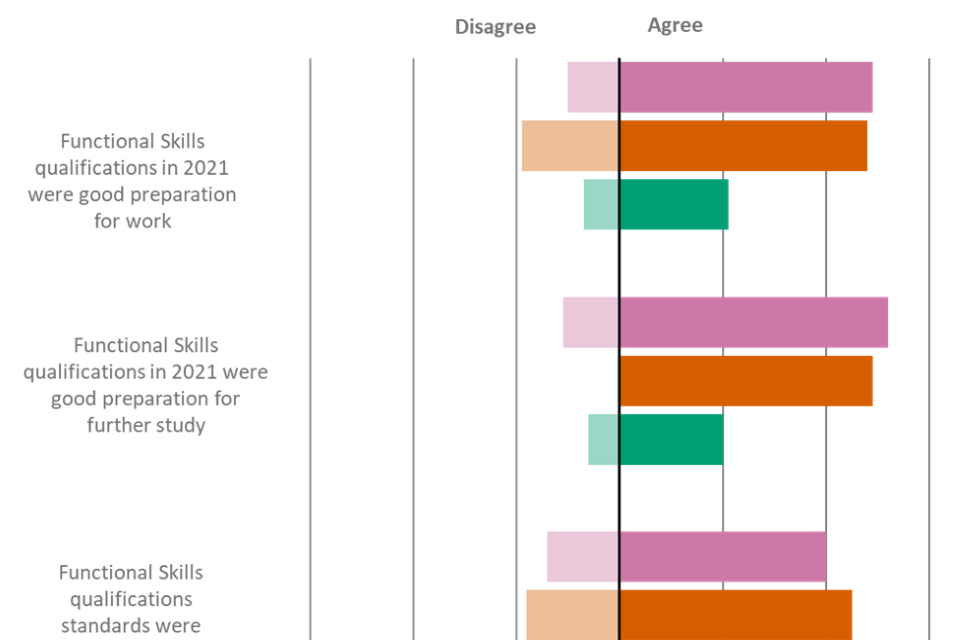

Note: There were also options provided in the survey for “Neither agree nor disagree” and “Don’t know”. Where the sum of the proportion who agreed and disagreed appears particularly low, this is due to the fact that large proportions of respondents fit within these other response categories.
| Statement | Employers - Agree | Employers - Disagree | Providers - Agree | Providers - Disagree | Learners - Agree | Learners - Disagree |
|---|---|---|---|---|---|---|
| Functional Skills qualifications in 2021 were good preparation for work | 21% | 7% | 48% | 19% | 49% | 10% |
| Functional Skills qualifications in 2021 were good preparation for further study | 20% | 6% | 49% | 19% | 52% | 11% |
| Functional Skills qualifications standards were maintained in 2021 | 12% | 8% | 45% | 18% | 40% | 14% |
| Functional Skills qualifications in 2021 were trusted qualifications | 17% | 9% | 51% | 17% | 45% | 12% |
| Functional Skills qualifications in 2021 were well understood by people | 11% | 22% | 39% | 25% | 41% | 19% |
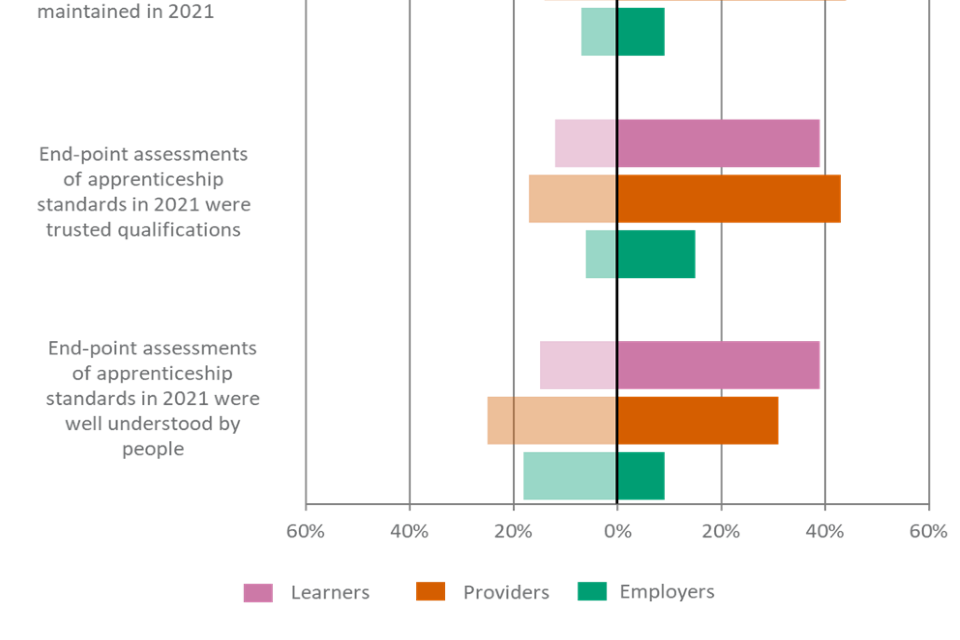
The same pattern was seen for EPAs (see Figure 3), with providers and learners expressing more positivity towards these than employers. The results below were comparable with 2020 findings, when we asked about qualifications in 2020 specifically.
Reflecting on 2021, 39% of learners and 31% of providers agreed that EPAs were well understood by people. This was much higher than for employers, of whom only 9% agreed. Notably though, half (50%) of this group said they did not know, broadly consistent with their lower levels of knowledge overall. For each of the statements shown in figure 3, a relatively high proportion of employers were unsure.
There was relatively higher agreement that in 2021 EPAs were trusted qualifications, as 43% of learners, 39% of providers and 15% of employers agreed that VTQs were trusted.
Thinking about 2021, 44% of providers and 34% of learners agreed that standards were maintained in EPAs. This was much higher than for employers (9%, although only 7% disagreed, with 85% responding that they neither agreed nor disagreed or did not know).
Figure 3. Results for perceptions of EPAs in 2021 (Learners, Providers, Employers)
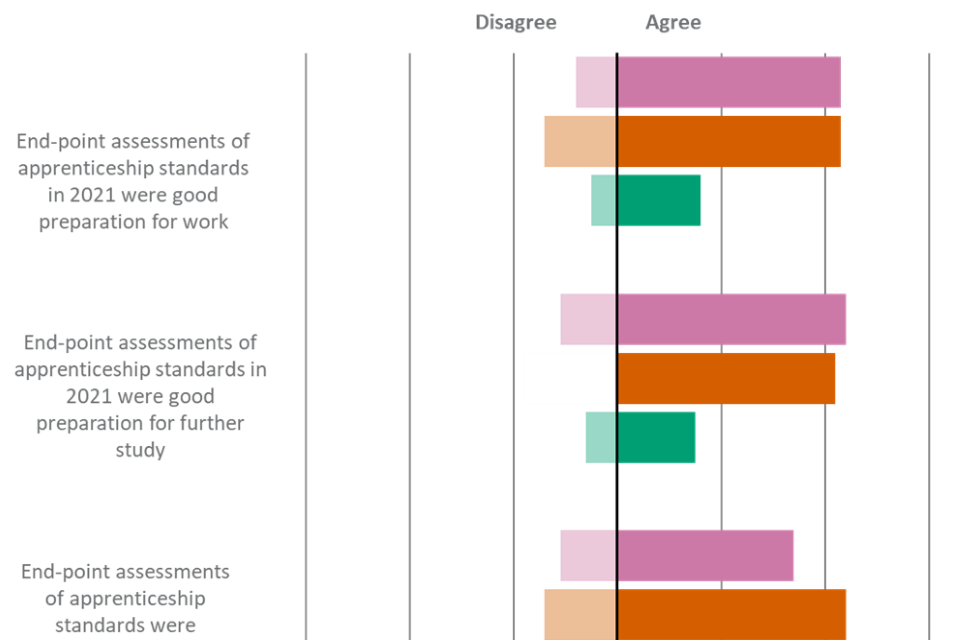
Note: There were also options provided in the survey for “Neither agree nor disagree” and “Don’t know”. Where the sum of the proportion who agreed and disagreed appears particularly low, this is due to the fact that large proportions of respondents fit within these other response categories.
| Statement | Employers - Agree | Employers - Disagree | Providers - Agree | Providers - Disagree | Learners - Agree | Learners - Disagree |
|---|---|---|---|---|---|---|
| End-point assessments of apprenticeship standards in 2021 were good preparation for work | 16% | 5% | 43% | 14% | 43% | 8% |
| End-point assessments of apprenticeship standards in 2021 were good preparation for further study | 15% | 6% | 42% | 18% | 44% | 11% |
| End-point assessments of apprenticeship standards were maintained in 2021 | 9% | 7% | 44% | 14% | 34% | 11% |
| End-point assessments of apprenticeship standards in 2021 were trusted qualifications | 15% | 6% | 43% | 17% | 39% | 12% |
| End-point assessments of apprenticeship standards in 2021 were well understood by people | 9% | 18% | 31% | 25% | 39% | 15% |
Section 2: Perceptions of vocational and technical qualifications
The following sections in this report relate to general perceptions of qualifications, and not 2021 specifically. Comparisons are given with wave 3 and wave 4 findings.
This section covers perceptions of vocational and technical qualifications other than FSQs and EPAs.
Key Findings – Vocational and technical Qualifications
-
Overall, approximately two-fifths (42%) of employers reported having a very or quite good understanding of vocational and technical qualifications (VTQs) in their sector, comparable with wave 4 findings (43%). Understanding increased with organisation size, with large and medium employers (both 59%) more likely to have a good understanding compared to small (49%) and micro (40%) employers.
-
Additionally, roughly three-fifths (64%, 63% in wave 4) of employers said they were aware of the changes that have been or are currently being made to VTQs. Fewer (7%) employers were aware and said they fully understand the changes that are proposed or taking place.
-
Learners who decided to take VTQs were most likely to say that they did so because they wanted to improve their skills (34%), wanted to progress in studies (23%), followed by interest in the area or progressing in a current job (both 22%).
-
The vast majority (85%, a decrease since 92% wave 4) of the provider group value VTQs. Levels of agreement among providers remains higher than for learners (71%) and employers (45%), with figures comparable to the previous wave.
-
Agreement that VTQs offer value for money among providers has remained high across tracking, with around two-thirds (68%) agreeing in wave 5. This is a decrease in comparison to wave 4 (76%), though is comparable (not statistically significantly different) to wave 3 (63%).
-
Agreement that the availability of VTQs is sufficiently flexible was comparable with wave 4 findings. Roughly half (49%) of learners agreed that the availability of VTQs is sufficiently flexible, comparable with the previous wave (52%). Agreement among employers remained much lower, with approximately a quarter (25%) reporting this, broadly consistent with wave 4 findings (24%).
-
Agreement that the purpose of VTQs is well-understood by employers is highest among providers (53%) and learners (51%), and lower among employers (36%). These results are all comparable with wave 4 findings.
-
For both learners and providers, levels of agreement for understanding the purpose of VTQs has decreased since wave 4, though is comparable to wave 3. Approximately two-thirds (69%) of learners agreed that they understand the purpose of VTQs (74% in wave 4). Agreement is slightly lower among providers (61%, 68% in wave 4).
-
Overall, agreement that VTQs prepare learners well for the workplace was comparable with wave 4. It was highest among providers (80%), followed by learners (65%) and employers (39%).
-
The proportion agreeing that people achieving VTQs have the skills needed by employers, or their organisation, also remained comparable with wave 4. There were stark differences in levels of agreement among employers and providers. Seven in ten (72%) providers agreed with this, compared to three in ten (33%) employers
-
Levels of agreement that VTQs are good preparation for further study remained comparable with wave 4. Approximately, seven in ten providers (71%) and learners (69%) agreed with this.
-
Two-thirds (67%) of employers who have arranged or funded training for employees in the last 12 months said that for their employees who achieve a VTQ outside of an apprenticeship, this leads to new responsibilities. Sixty-two percent reported that this led to a promotion or improved job status, and a comparable proportion (59%) said this leads to a pay rise at least some of the time.
Understanding of vocational and technical qualifications by employers
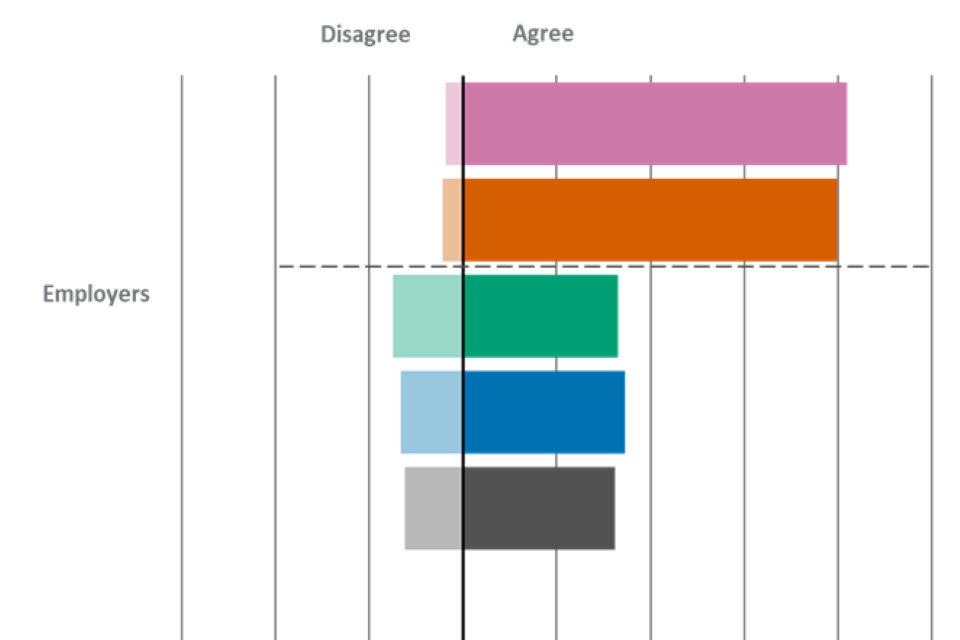
For figure 4, the wave 5 unweighted base is: All employers, n=2,002.
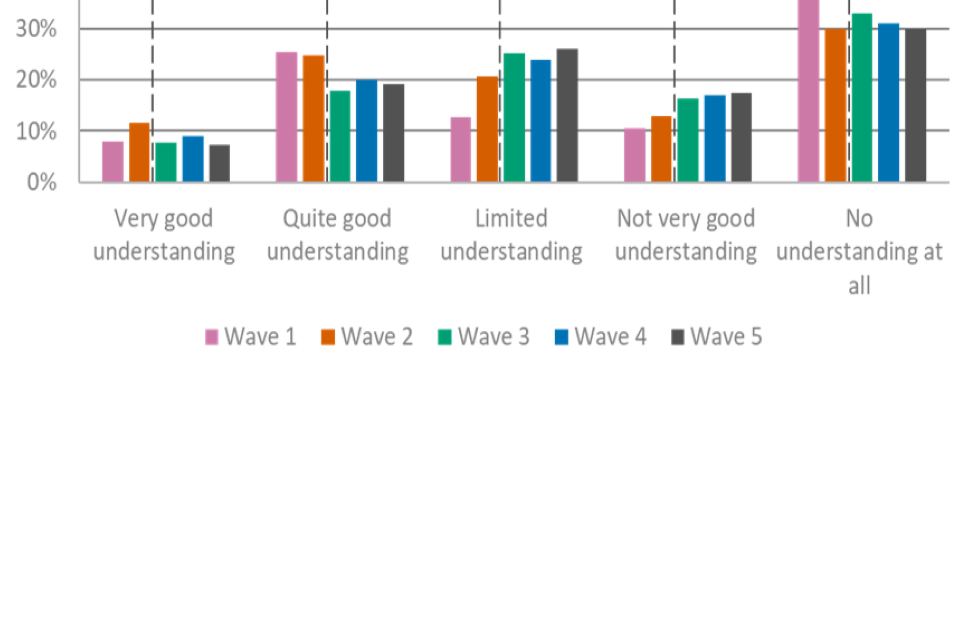
Overall, approximately two-fifths (42%) of employers reported having a very or quite good understanding of VTQs in their sector, comparable with wave 4 findings (43%) (see Figure 4). This is comprised of 13% stating that they have a ‘very good’ understanding and 29% saying that they have a ‘quite good’ understanding. One fifth (21%) of employers feel that they have no understanding at all of VTQs in their sector.
As observed in wave 4, large (59%) and medium (59%) employers were more likely than small (49%) and micro (40%) employers to say that they have a good understanding of VTQs in their sector. Micro employers were more likely than any other employer size to say that they have no understanding at all (23% vs. small 10%, medium 11% and large 7%). There were no differences in levels of agreement by organisation size in comparison to wave 4.
Employers working in the public sector (55%) were more likely than those working in the private sector (42%) to have a good understanding of VTQs in their sector, likely reflecting organisation size.
Figure 4. Results for ‘Please indicate which of the following statements best describes your understanding of vocational and technical qualifications in my sector’ (Employers)


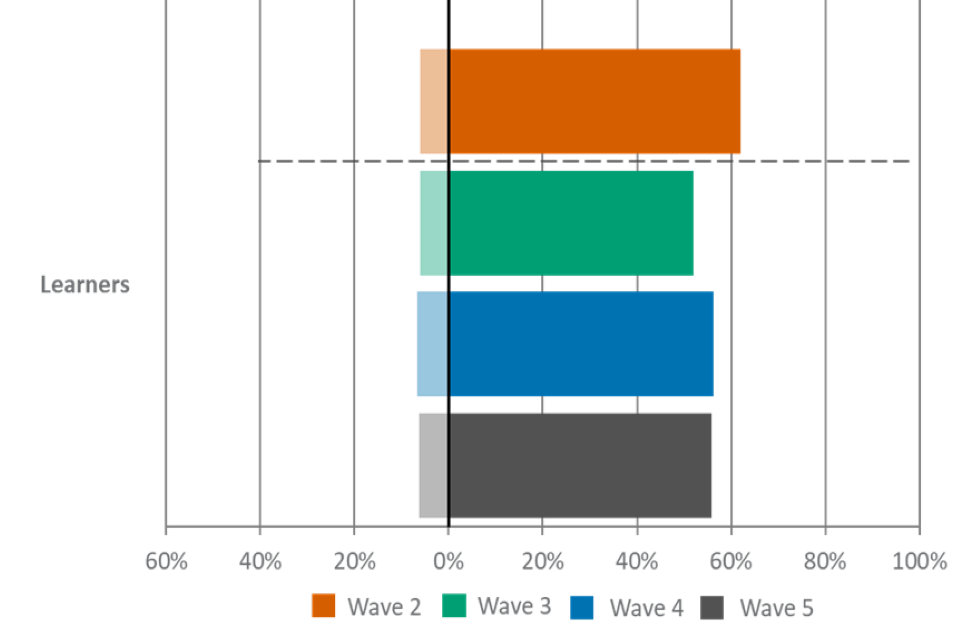
Please note that YouGov and Ofqual urge caution when drawing conclusions based on differences in the data in comparison with waves 1 and 2. This is due to key changes in the sampling approach and survey mode made for wave 3 onwards, which are outlined in more detail in the Introduction. The dotted line marks when the methodology changed.
| Level of understanding | Wave 1 | Wave 2 | Wave 3 | Wave 4 | Wave 5 |
|---|---|---|---|---|---|
| Very good understanding | 11% | 16% | 14% | 14% | 13% |
| Quite good understanding | 34% | 32% | 27% | 29% | 29% |
| Limited understanding | 15% | 21% | 24% | 25% | 24% |
| Not very good understanding | 8% | 12% | 13% | 11% | 14% |
| No understanding at all | 32% | 19% | 22% | 20% | 21% |
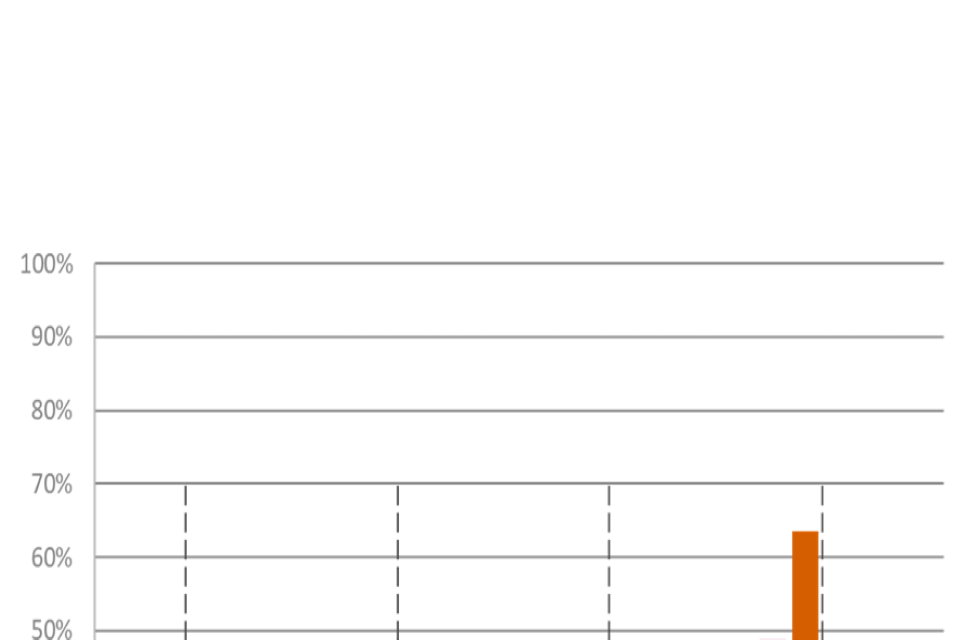
For figure 5, the wave 5 unweighted base is: All employers who have at least a limited understanding of VTQs in their sector, n=1,394.
Employers were asked to describe their understanding of the changes that have been, or are currently being made, to vocational and technical qualifications in their sector. They were not asked about specific changes.
Awareness of the changes that had been made, or were currently being made, to VTQs in their sector was comparable with wave 4 findings. Overall, roughly three-fifths (64%, 63% in wave 4) of employers were aware of the changes that had been made, or were currently being made, to VTQs in their sector (see Figure 5). Broken down, only 7% of employers said they were aware and fully understand the changes proposed or taking place, whilst larger proportions had some understanding (23%), or were aware but did not know what changes had taken place in their sector (35%).
Thirty-six percent of employers were not aware of any changes at all in their sector. This was predominantly seen among micro employers (40%), higher than for small (27%), medium (23%) and large (22%) employers, demonstrating that awareness of changes in their sector increases with organisation size.
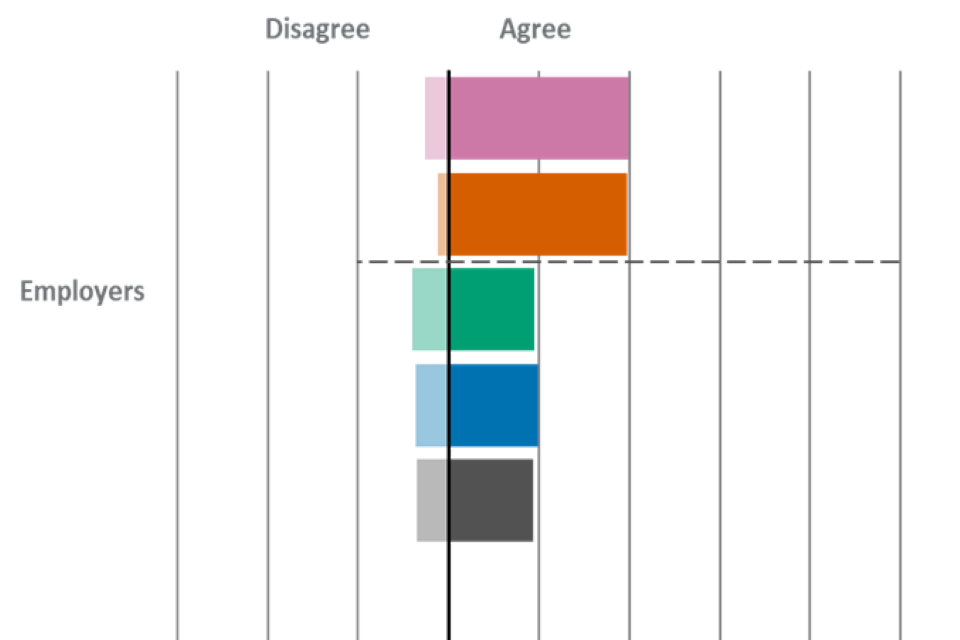
Figure 5. Results for ‘Please say which of the following statements best describes your understanding of the changes that have been, or are currently being made to vocational and technical qualifications in your sector’ (Employers)
Please note that YouGov and Ofqual urge caution when drawing conclusions based on differences in the data in comparison with waves 1 and 2. This is due to key changes in the sampling approach and survey mode made for wave 3 onwards, which are outlined in more detail in the Introduction. The dotted line marks when the methodology changed.
| Statement | Wave 1 | Wave 2 | Wave 3 | Wave 4 | Wave 5 |
|---|---|---|---|---|---|
| Aware of and fully understand the changes proposed or taking place | 7% | 8% | 7% | 7% | 7% |
| Aware of and have some understanding of the changes proposed or taking place | 20% | 14% | 22% | 21% | 23% |
| Aware of, but don’t know what changes are proposed or taking place | 24% | 14% | 31% | 35% | 35% |
| Not aware of any changes at all | 49% | 64% | 40% | 37% | 36% |
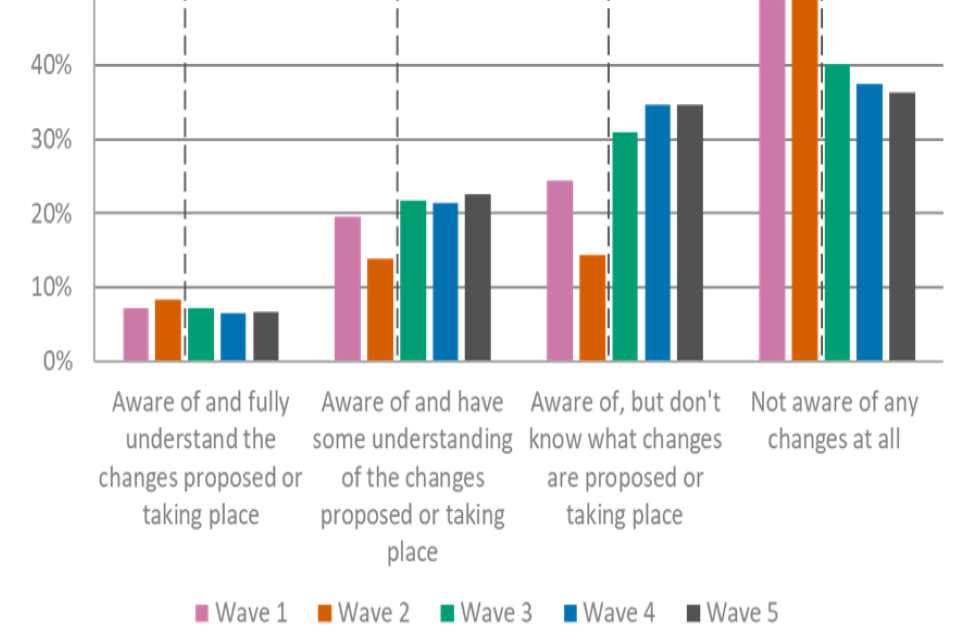
Why learners chose vocational and technical qualifications
For figure 6, the wave 5 unweighted base is: All learners who are studying a VTQ, n=371.
Learners were asked their reasons for choosing to take a VTQ, before being asked about the benefits of this (see page 22).
As shown in Figure 6, wanting to improve their skills was the most common reason (34%) given by learners as to why they decided to take a VTQ; this was also the most common reason given in wave 4. Wanting to progress in their studies was the next most common (23%) reason, following by interest in the area or progressing in a current job (both 22%).
Younger learners aged 18 or under were more likely than those aged 25+ to say that they decided to take a VTQ to progress in their studies (43% vs. 15%). By contrast, those aged 25+ were more likely than those aged 18 or under to cite to progress in their current job (32% vs. 6%) or because their employer advised or required them to (22% vs. 5%) as reasons for taking a VTQ.
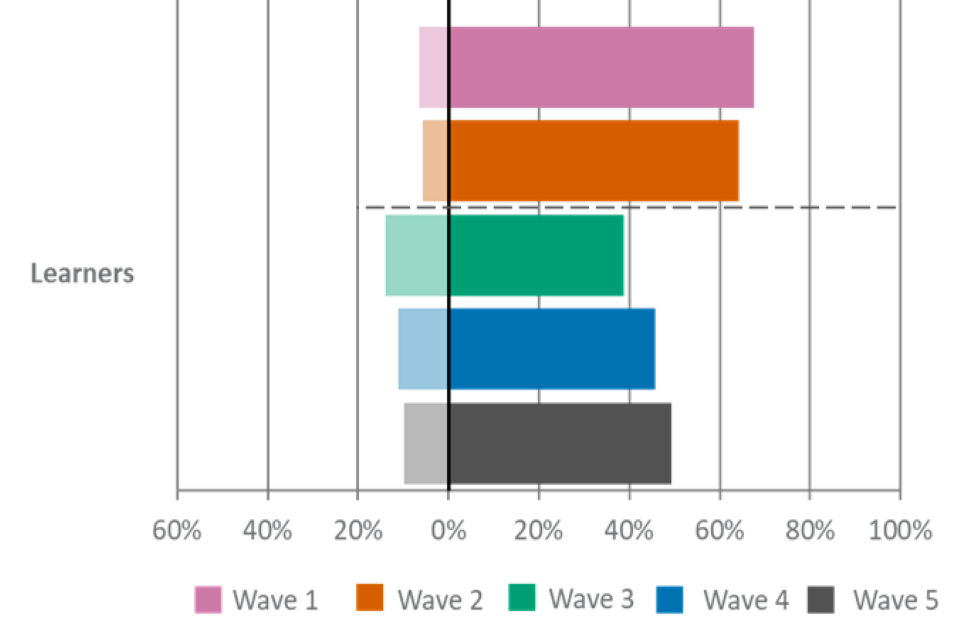
Figure 6. Results for ‘Why did you decide to take a vocational or technical qualification?’ (Learners)
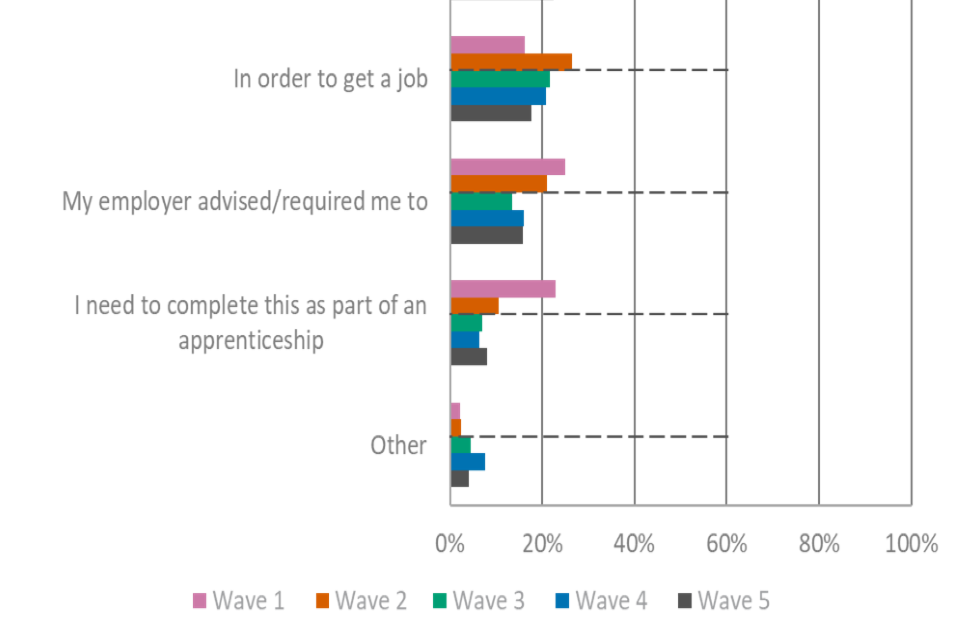
Please note that YouGov and Ofqual urge caution when drawing conclusions based on differences in the data in comparison with waves 1 and 2. This is due to key changes in the sampling approach and survey mode made for wave 3 onwards, which are outlined in more detail in the Introduction. The dotted line marks when the methodology changed.
| Statement | Wave 1 | Wave 2 | Wave 3 | Wave 4 | Wave 5 |
|---|---|---|---|---|---|
| I wanted to improve my skills | 53% | 41% | 38% | 36% | 34% |
| To progress in my studies | 16% | 26% | 28% | 23% | 23% |
| To progress in my current job | 25% | 38% | 23% | 22% | 22% |
| I am interested in the vocational/technical area | 31% | 32% | 28% | 24% | 22% |
| In order to get a job | 16% | 26% | 22% | 21% | 18% |
| My employer advised/required me to | 25% | 21% | 13% | 16% | 16% |
| I need to complete this as part of an apprenticeship | 23% | 11% | 7% | 6% | 8% |
| Other | 2% | 2% | 4% | 8% | 4% |
Benefits associated with other vocational and technical qualifications by learners
For figure 7, the wave 5 unweighted base is: All learners who are studying a VTQ, n=371.
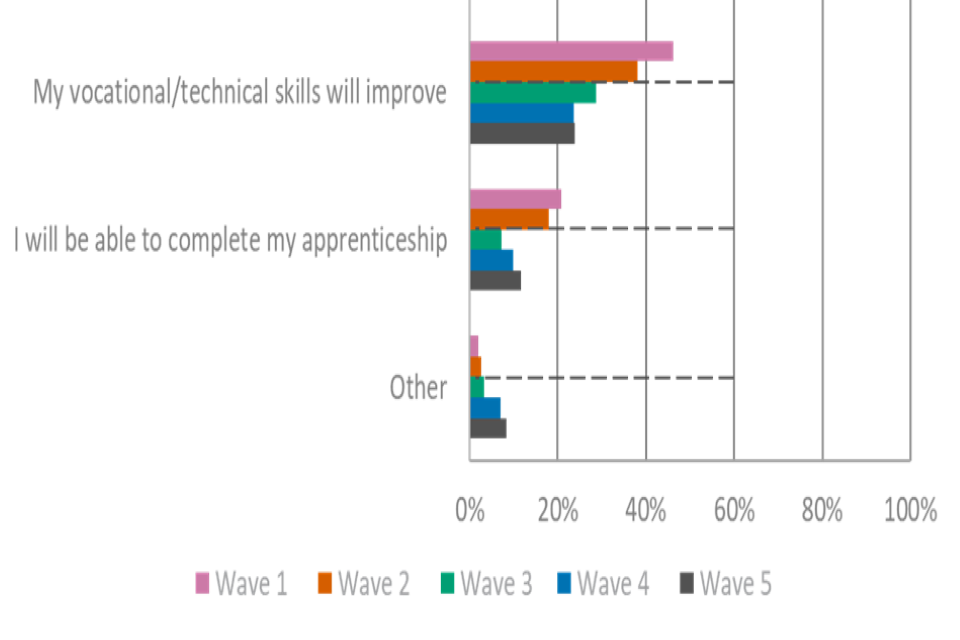
As shown in Figure 7, the most frequently perceived benefit of taking VTQs, among those who have started or completed one, is being more confident using their vocational or technical skills (30%). This is followed by being able to find a job (or better job) or being able to progress in studies (both 27%).
Younger learners aged 18 and under were more likely than those aged 25+ to feel a benefit of taking a VTQ would be the ability to progress in their studies (46% vs. 18%), whilst older learners are more likely to cite being able to progress in their current job (32% vs. 11%).
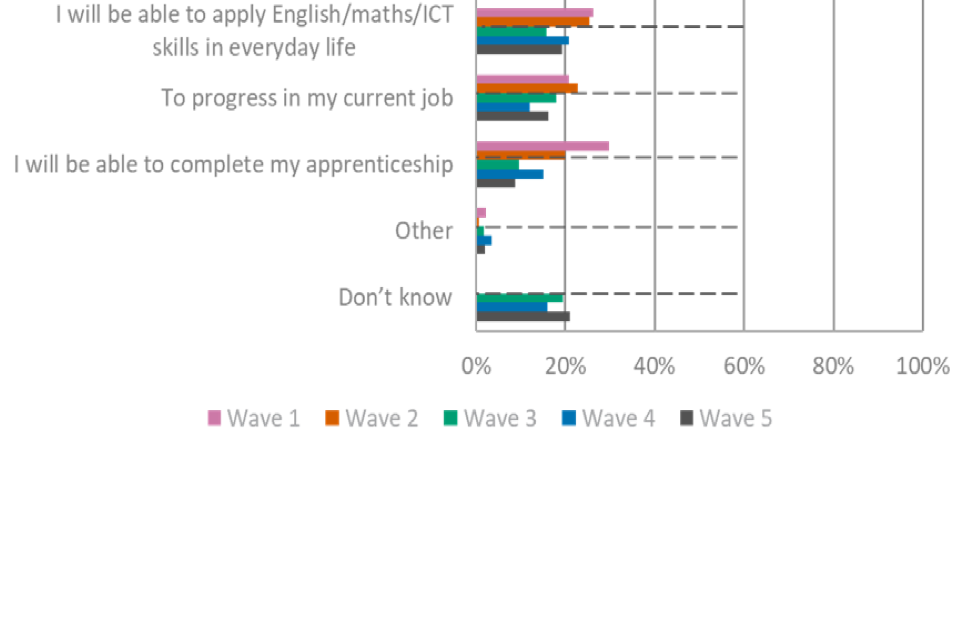
Figure 7. Results for ‘Now that you have started learning/have completed learning, what benefits do you expect from taking a vocational and technical qualification?’ (Learners)
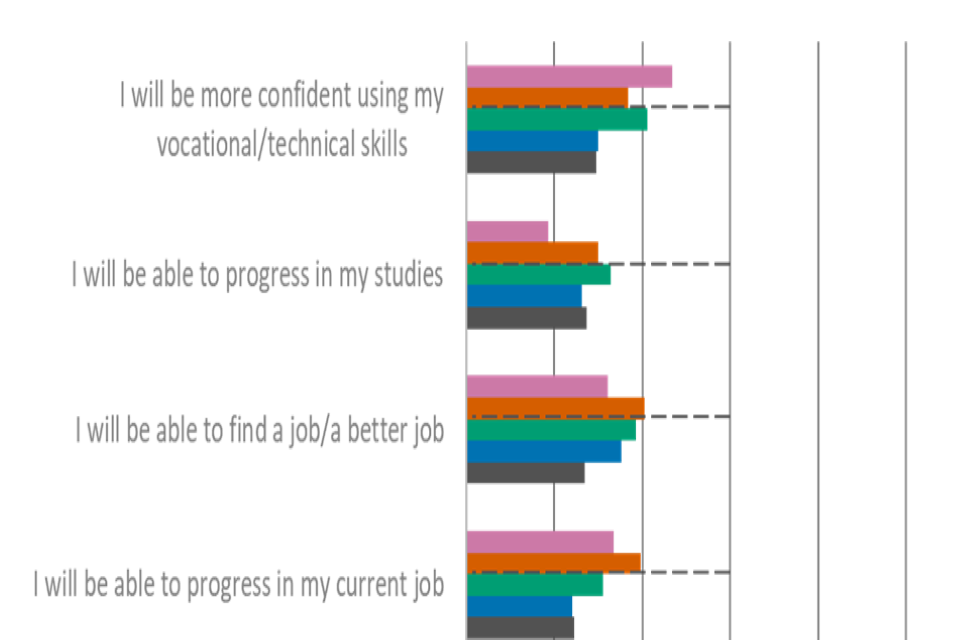
Please note that YouGov and Ofqual urge caution when drawing conclusions based on differences in the data in comparison with waves 1 and 2. This is due to key changes in the sampling approach and survey mode made for wave 3 onwards, which are outlined in more detail in the Introduction. The dotted line marks when the methodology changed.
| Statement | Wave 1 | Wave 2 | Wave 3 | Wave 4 | Wave 5 |
|---|---|---|---|---|---|
| I will be more confident using my vocational/technical skills | 47% | 37% | 41% | 30% | 30% |
| My vocational/technical skills will improve | 46% | 38% | 29% | 24% | 24% |
| I will be able to progress in my current job | 34% | 40% | 31% | 24% | 25% |
| I will be able to find a job/a better job | 32% | 41% | 39% | 35% | 27% |
| I will be able to complete my apprenticeship | 21% | 18% | 7% | 10% | 12% |
| I will be able to progress in my studies | 19% | 30% | 33% | 26% | 27% |
| Other | 2% | 3% | 3% | 7% | 8% |
| I will be more confident in my work/better at my job | 0% | 0% | 0% | 0% | 28% |
Perceptions of vocational and technical qualifications: value and flexibility
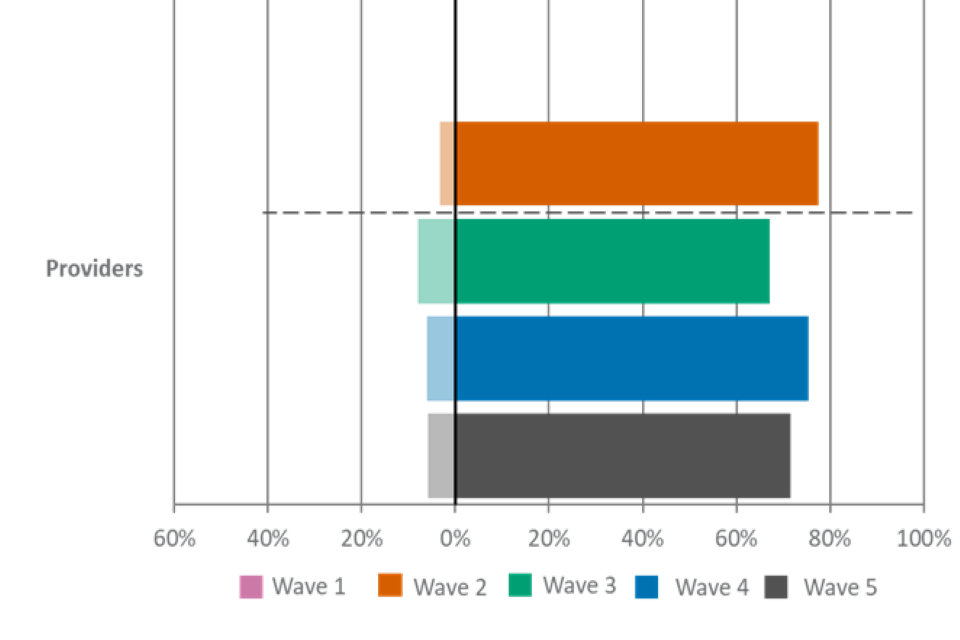
For figure 8, the wave 5 unweighted base is: All employers n=1,656; All types of providers, n=539; All learners, n=533.
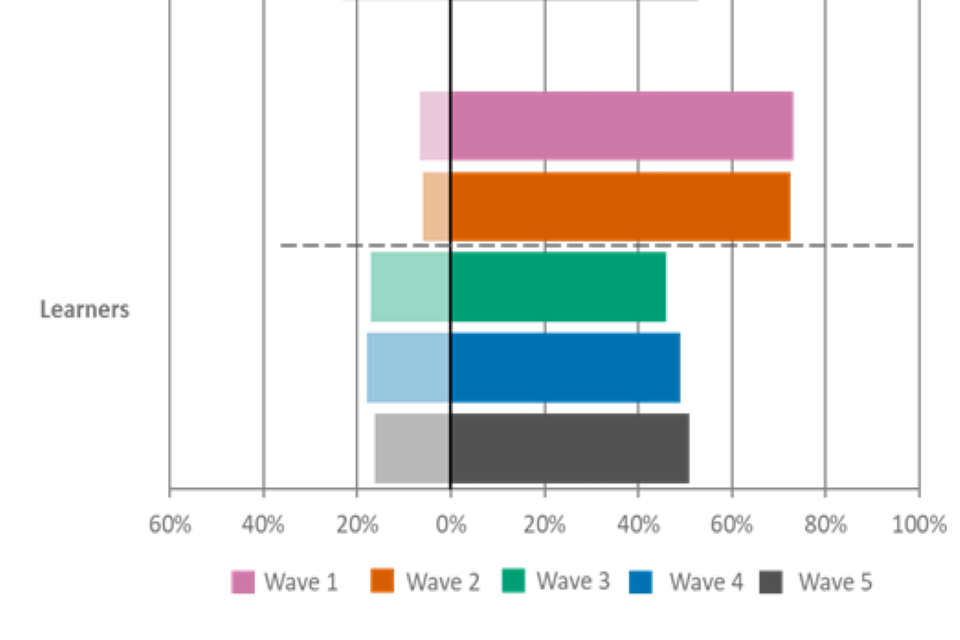
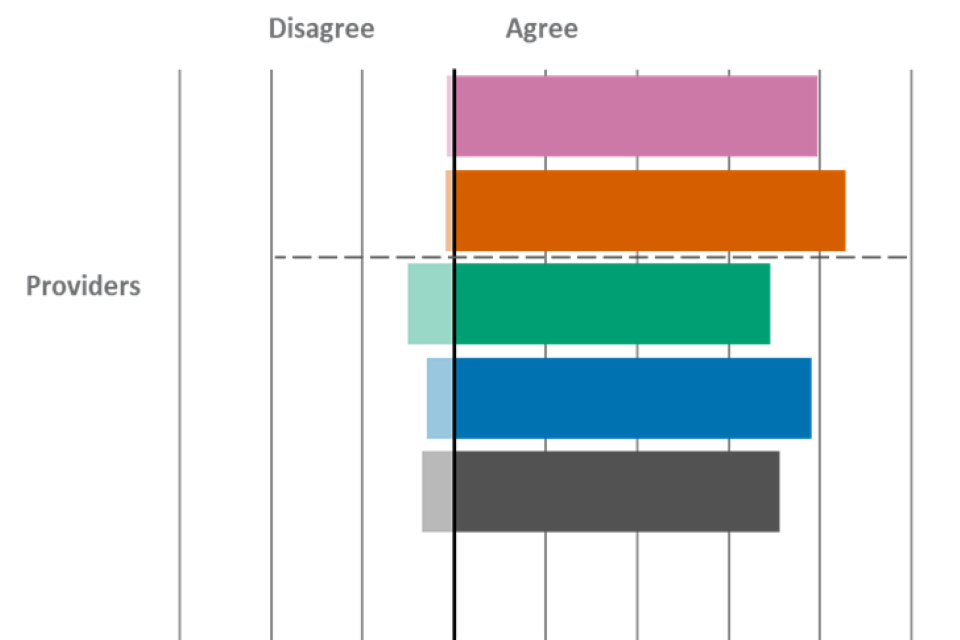
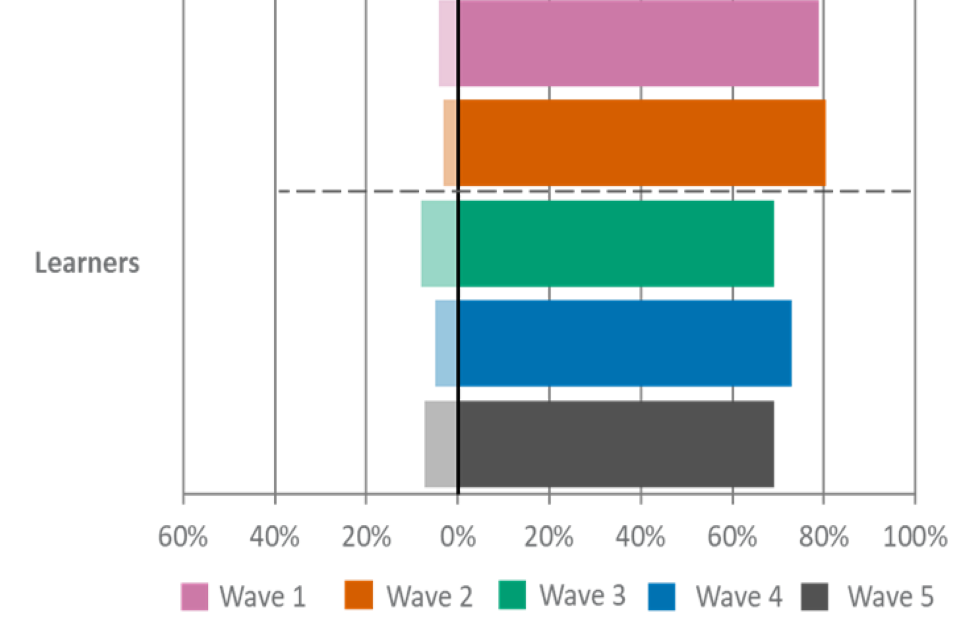
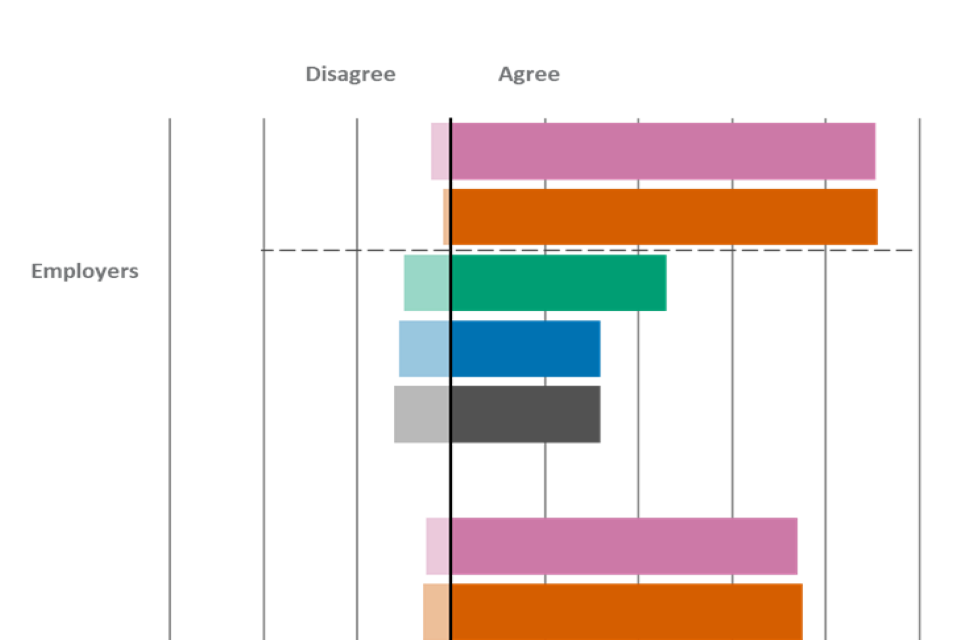
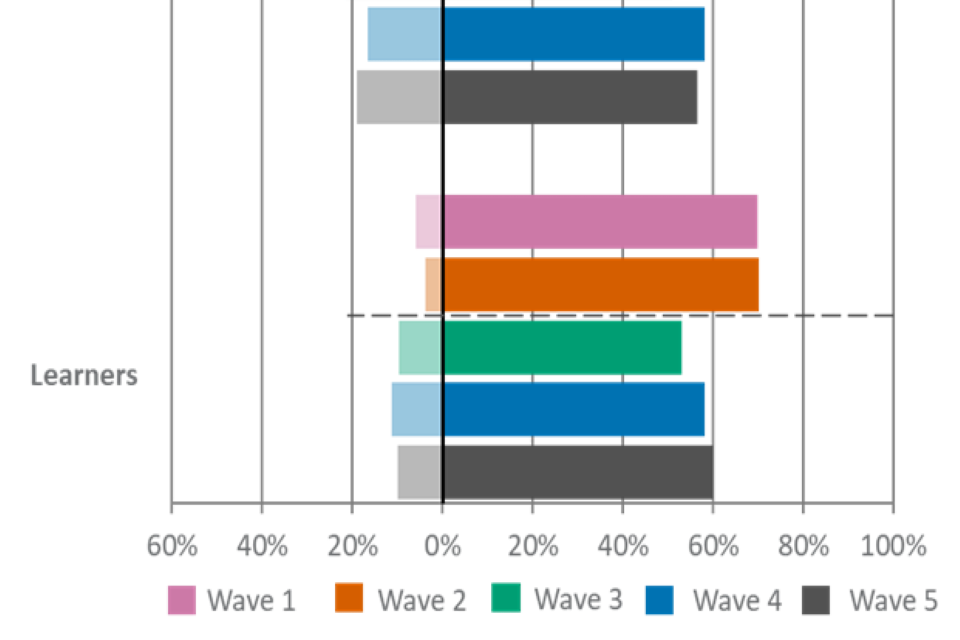
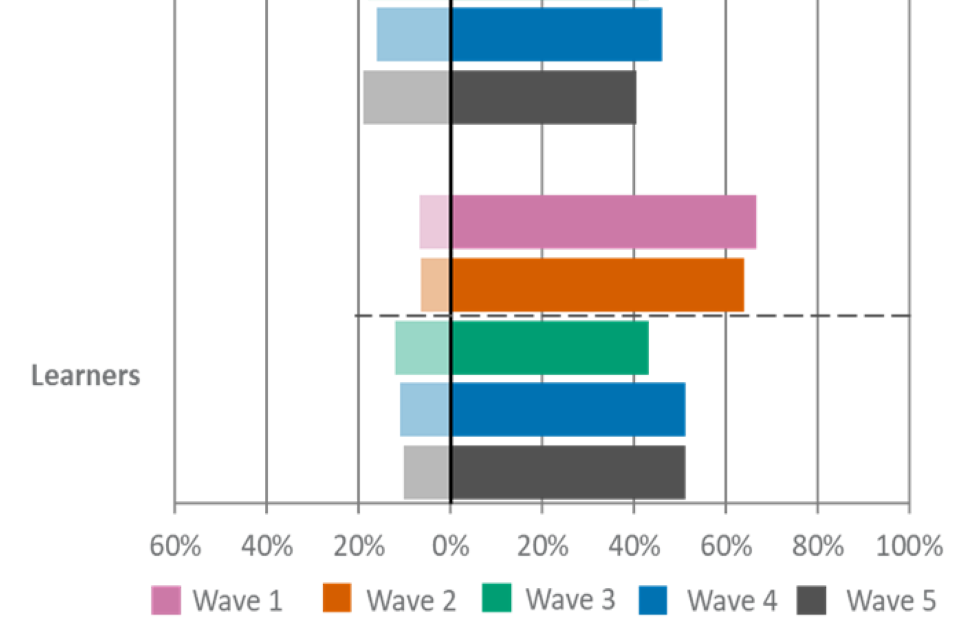
As shown in Figure 8, agreement that different stakeholder groups value VTQs was comparable with wave 4 findings for learners (66%) and employers (45%). Levels of agreement were highest among providers (85%), which has decreased since wave 4 (92%) though is comparable to wave 3 (88%).
Among employers, agreement increases with organisation size. Large employers (65%) were more likely than medium (58%), small (53%) and micro (42%) employers to agree that they value VTQs.
Figure 8. Results for ‘We value vocational and technical qualifications’ (Employers) - ‘I value vocational and technical qualifications’ (All types of providers, Learners)
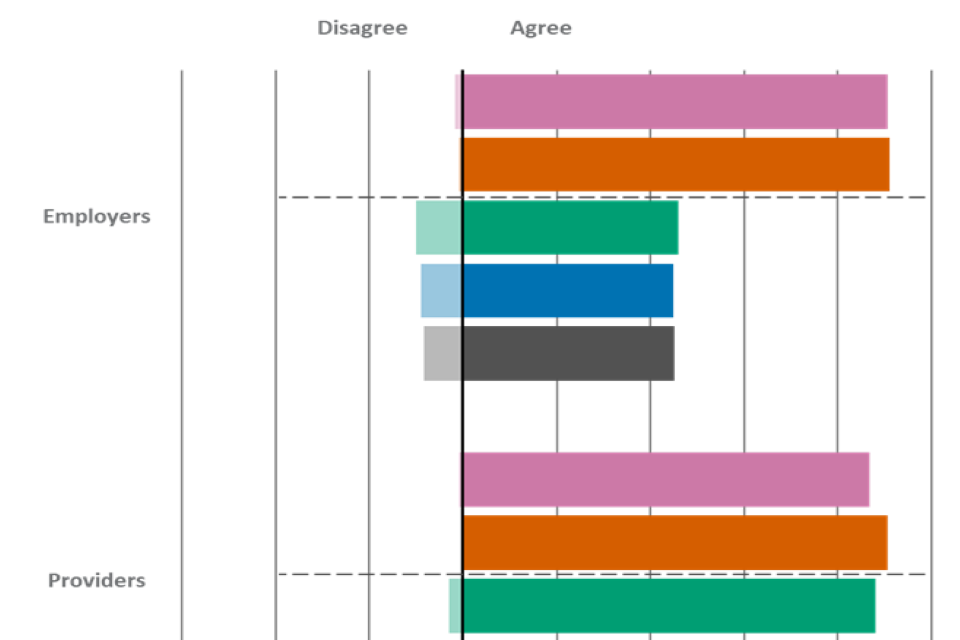
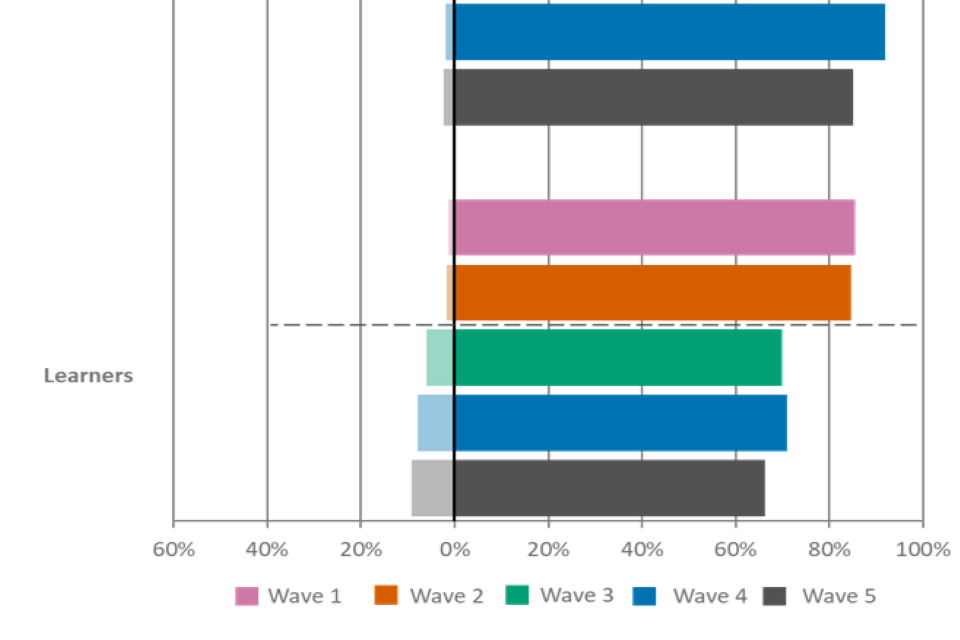
Please note that YouGov and Ofqual urge caution when drawing conclusions based on differences in the data in comparison with waves 1 and 2. This is due to key changes in the sampling approach and survey mode made for wave 3 onwards, which are outlined in more detail in the Introduction. The dotted line marks when the methodology changed.
Also note that there were also options provided in the survey for “Neither agree nor disagree” and “Don’t know”. Where the sum of the proportion who agreed and disagreed appears particularly low, this is due to the fact that large proportions of respondents fit within these other response categories.
| Group and agreement | Wave 1 | Wave 2 | Wave 3 | Wave 4 | Wave 5 |
|---|---|---|---|---|---|
| Employers – agree | 91% | 91% | 46% | 45% | 45% |
| Employers – disagree | 2% | 1% | 10% | 9% | 8% |
| Providers – agree | 87% | 91% | 88% | 92% | 85% |
| Providers – disagree | 1% | 0% | 3% | 2% | 2% |
| Learners – agree | 86% | 85% | 70% | 71% | 66% |
| Learners – disagree | 1% | 2% | 6% | 8% | 9% |
For figure 9, the wave 5 unweighted base is: All types of providers, n=539.
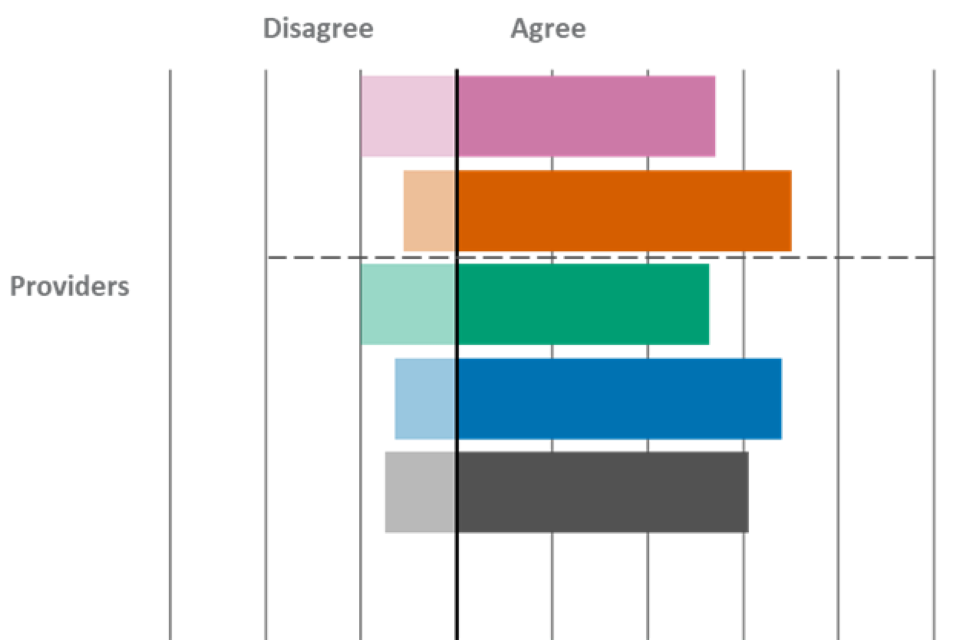
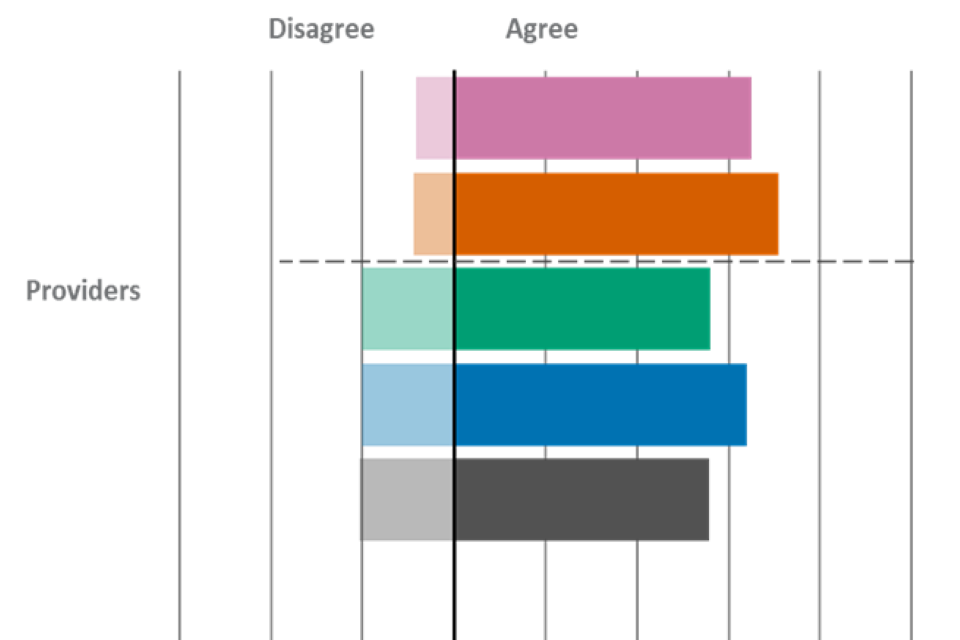
As shown in Figure 9, agreement that VTQs offer value for money among providers has remained high across tracking, with two-thirds (68%) agreeing in wave 5. This is a decrease in comparison to wave 4 (76%), though is comparable (not statistically significantly different) to wave 3 (63%). Among providers, only a very small proportion (7%) disagreed.
Agreement was highest among ITPs (78%), followed by FE colleges (69%). Whilst agreement that VTQs offer value for money was lower among sixth forms (53%).
Figure 9. Results for ‘vocational and technical qualifications offer value for money’ (All types of providers)
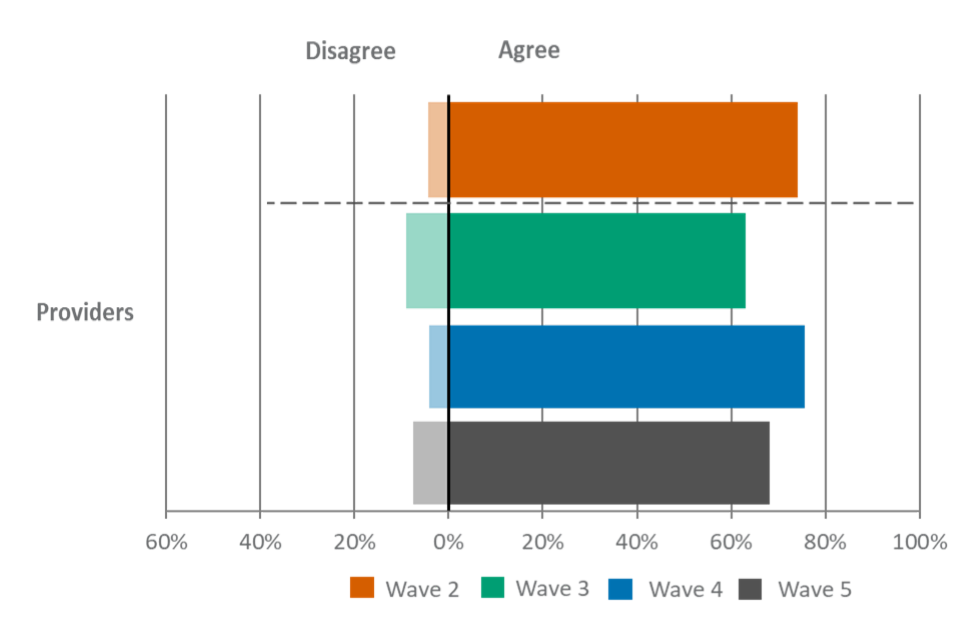
Please note that YouGov and Ofqual urge caution when drawing conclusions based on differences in the data in comparison with waves 1 and 2. This is due to key changes in the sampling approach and survey mode made for wave 3 onwards, which are outlined in more detail in the Introduction. The dotted line marks when the methodology changed.
Also note that there were also options provided in the survey for “Neither agree nor disagree” and “Don’t know”. Where the sum of the proportion who agreed and disagreed appears particularly low, this is due to the fact that large proportions of respondents fit within these other response categories.
| Group and agreement | Wave 2 | Wave 3 | Wave 4 | Wave 5 |
|---|---|---|---|---|
| Providers – agree | 74% | 63% | 76% | 68% |
| Providers – disagree | 4% | 9% | 4% | 7% |
For figure 10, the wave 5 unweighted base is: All employers, n=1,656; All learners, n=533.
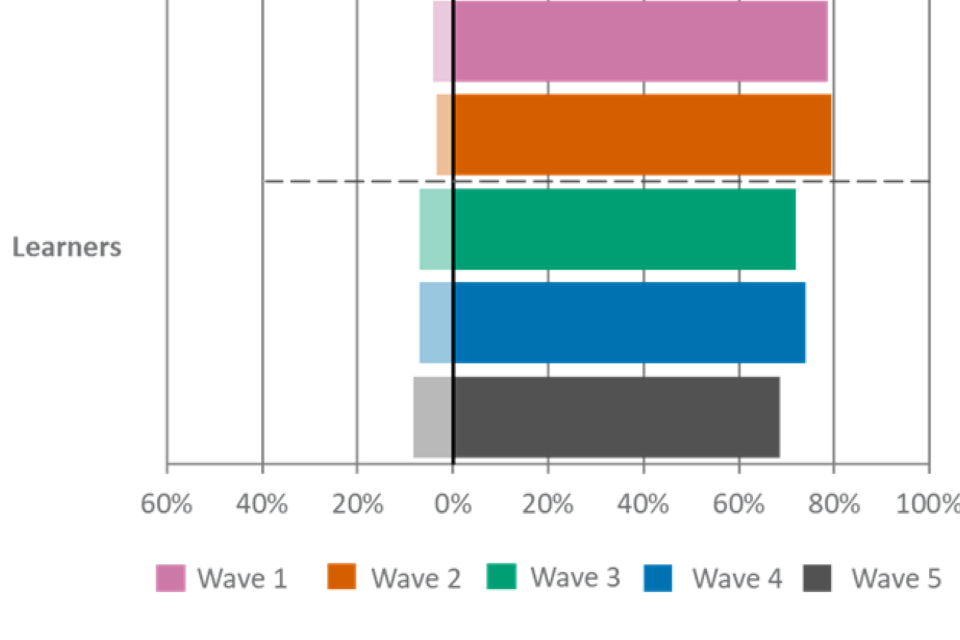
Agreement that the availability of VTQs is sufficiently flexible was comparable with wave 4 findings. Roughly half (49%) of learners agreed that the availability of VTQs is sufficiently flexible, comparable with the previous wave (52%). Agreement among employers remained much lower, with approximately a quarter (25% (see Figure 10)) reporting this, broadly consistent with wave 4 findings (24%).
Large employers (43%) were statistically significantly more likely than medium (32%), small (29%) and micro (23%) employers to agree that the availability of VTQs is sufficiently flexible.
Figure 10. Results for ‘The availability of vocational and technical qualifications is sufficiently flexible’ (Employers, Learners)
Please note that YouGov and Ofqual urge caution when drawing conclusions based on differences in the data in comparison with waves 1 and 2. This is due to key changes in the sampling approach and survey mode made for wave 3 onwards, which are outlined in more detail in the Introduction. The dotted line marks when the methodology changed.
Also note that there were also options provided in the survey for “Neither agree nor disagree” and “Don’t know”. Where the sum of the proportion who agreed and disagreed appears particularly low, this is due to the fact that large proportions of respondents fit within these other response categories.
| Group and agreement | Wave 1 | Wave 2 | Wave 3 | Wave 4 | Wave 5 |
|---|---|---|---|---|---|
| Employers – agree | 69% | 67% | 24% | 24% | 25% |
| Employers – disagree | 5% | 4% | 12% | 10% | 9% |
| Learners – agree | 70% | 70% | 46% | 52% | 49% |
| Learners – disagree | 6% | 7% | 14% | 12% | 14% |
Perceptions of vocational and technical qualifications: purpose and future opportunity
For figure 11, the wave 5 unweighted base is: All employers n=1,656; All types of providers, n=539; All learners, n=533.
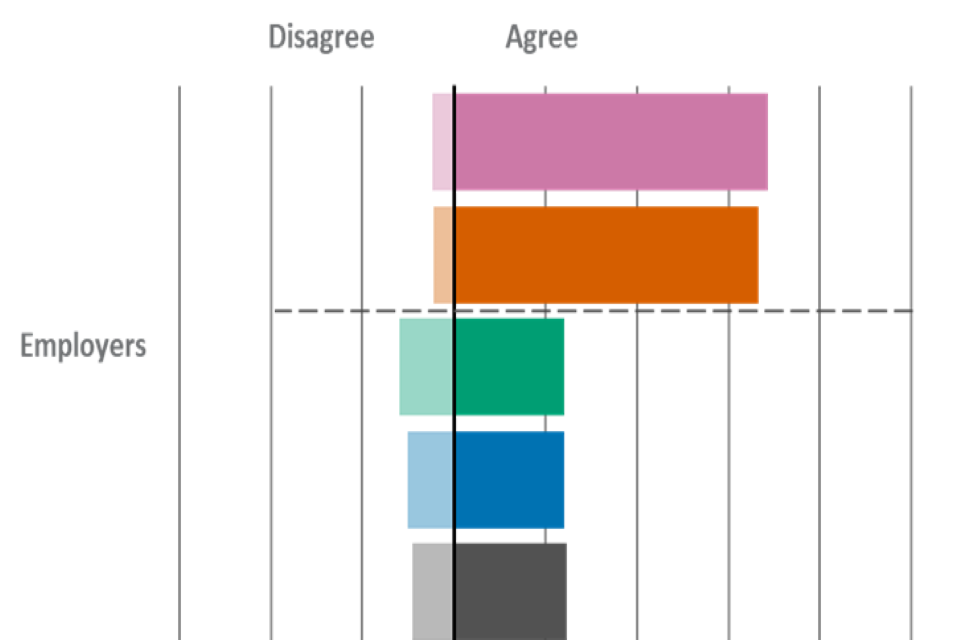
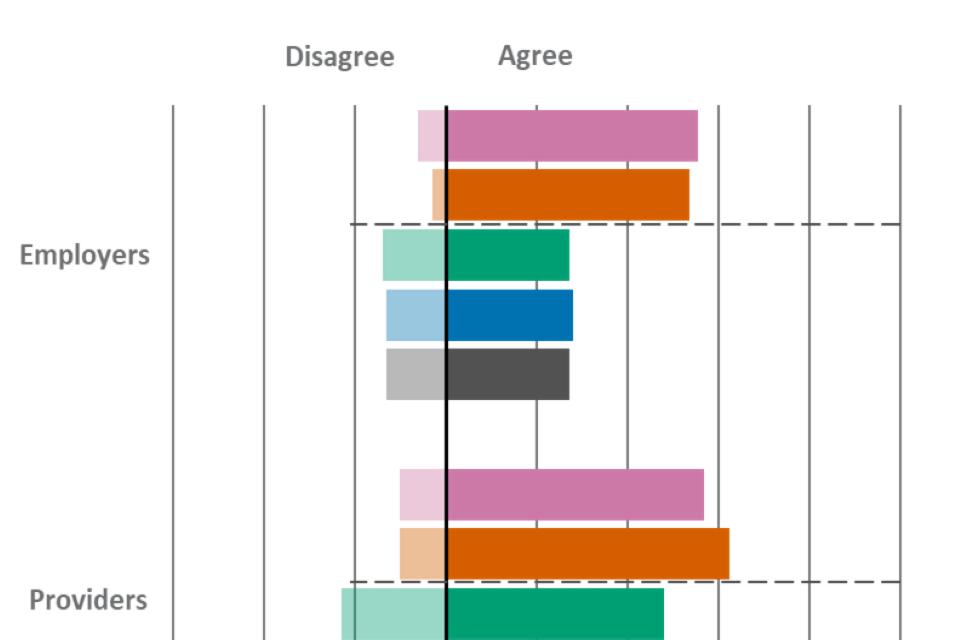
Agreement that the purpose of VTQs is well-understood by employers is highest among providers (53%) and learners (51%), and lower among employers (36%) (see Figure 11). These results are all comparable with wave 4 findings.
Large employers (53%) were statistically significantly more likely than small (43%) and micro (34%) employers to agree that the availability of VTQs is sufficiently flexible.
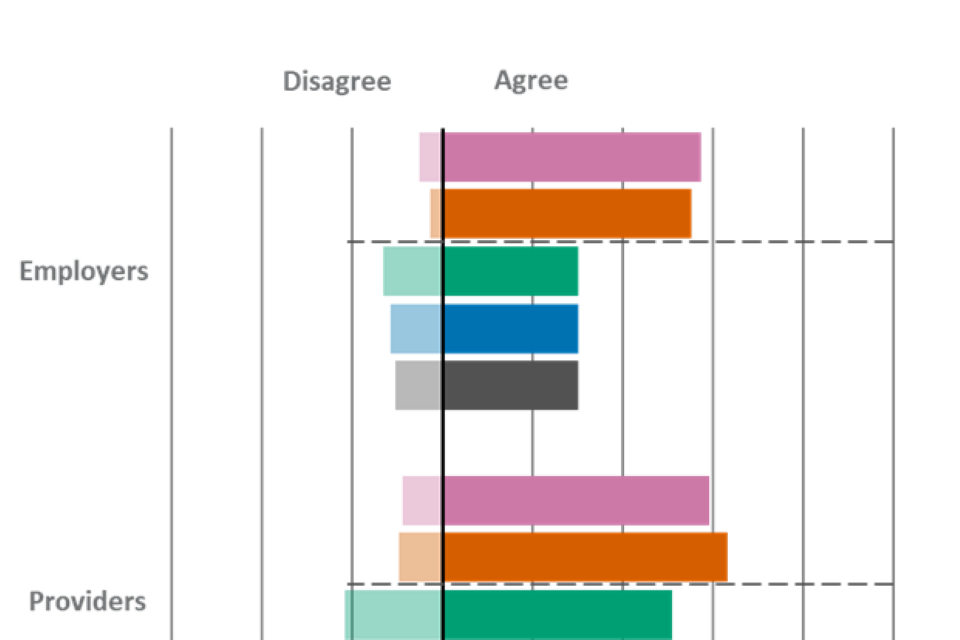
Figure 11. Results for ‘The purpose of vocational and technical qualifications is well-understood by my organisation’ (Employers) - ‘The purpose of vocational and technical qualifications is well-understood by employers’ (All types of providers, Learners)
Please note that YouGov and Ofqual urge caution when drawing conclusions based on differences in the data in comparison with waves 1 and 2. This is due to key changes in the sampling approach and survey mode made for wave 3 onwards, which are outlined in more detail in the Introduction. The dotted line marks when the methodology changed.
Also note that there were also options provided in the survey for “Neither agree nor disagree” and “Don’t know”. Where the sum of the proportion who agreed and disagreed appears particularly low, this is due to the fact that large proportions of respondents fit within these other response categories.
| Group and agreement | Wave 1 | Wave 2 | Wave 3 | Wave 4 | Wave 5 |
|---|---|---|---|---|---|
| Employers – agree | 87% | 87% | 38% | 36% | 36% |
| Employers – disagree | 2% | 3% | 20% | 21% | 17% |
| Providers – agree | 59% | 60% | 42% | 58% | 53% |
| Providers – disagree | 19% | 18% | 31% | 21% | 23% |
| Learners – agree | 73% | 73% | 46% | 49% | 51% |
| Learners – disagree | 7% | 6% | 17% | 18% | 16% |
For figure 12, the wave 5 unweighted base is: All types of providers, n=539; All learners, n=533.
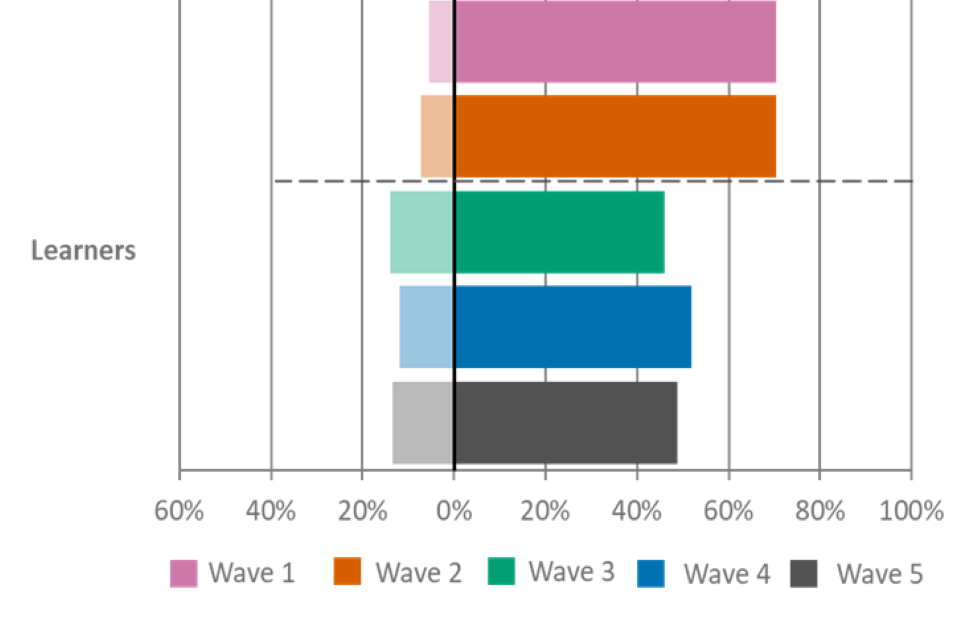
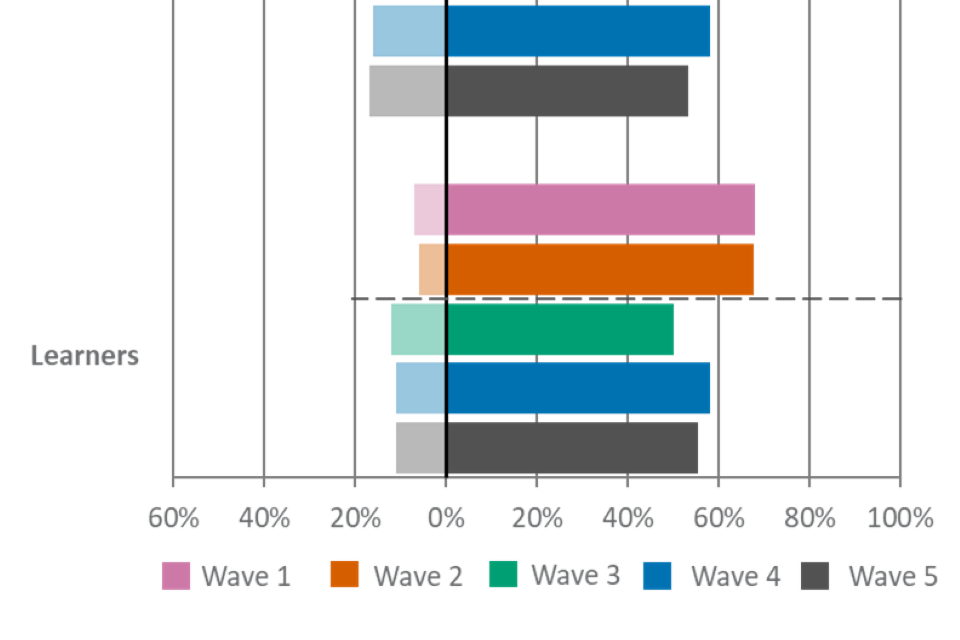
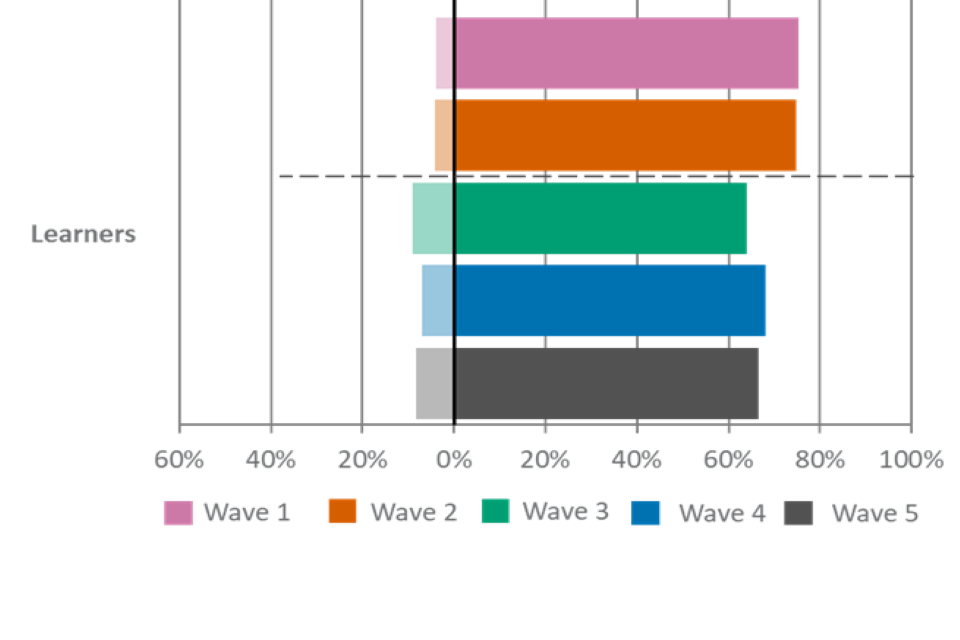
For both learners and providers, levels of agreement for understanding the purpose of VTQs has decreased since the wave 4, though is comparable to wave 3.
Approximately two-thirds (69%) of learners agreed that they understand the purpose of VTQs (74% in wave 4) (see Figure 12). Agreement is slightly lower among providers (61%, 68% in wave 4).
Older learners aged 25+ were more likely than those aged 18 and under to agree that they understand the purpose of VTQs (75% vs. 64%).
Figure 12. Results for ‘The purpose of vocational and technical qualifications is well-understood by learners’ (All types of providers) and ‘I understand the purpose of vocational and technical qualifications’ (Learners)
Please note that YouGov and Ofqual urge caution when drawing conclusions based on differences in the data in comparison with waves 1 and 2. This is due to key changes in the sampling approach and survey mode made for wave 3 onwards, which are outlined in more detail in the Introduction. The dotted line marks when the methodology changed.
Also note that there were also options provided in the survey for “Neither agree nor disagree” and “Don’t know”. Where the sum of the proportion who agreed and disagreed appears particularly low, this is due to the fact that large proportions of respondents fit within these other response categories.
| Group and agreement | Wave 1 | Wave 2 | Wave 3 | Wave 4 | Wave 5 |
|---|---|---|---|---|---|
| Providers – agree | 54% | 70% | 53% | 68% | 61% |
| Providers – disagree | 20% | 11% | 20% | 13% | 15% |
| Learners – agree | 79% | 80% | 72% | 74% | 69% |
| Learners – disagree | 4% | 4% | 7% | 7% | 8% |
For figure 13, the wave 5 unweighted base is: All employers n=1,656; All types of providers, n=539; All learners, n=533.
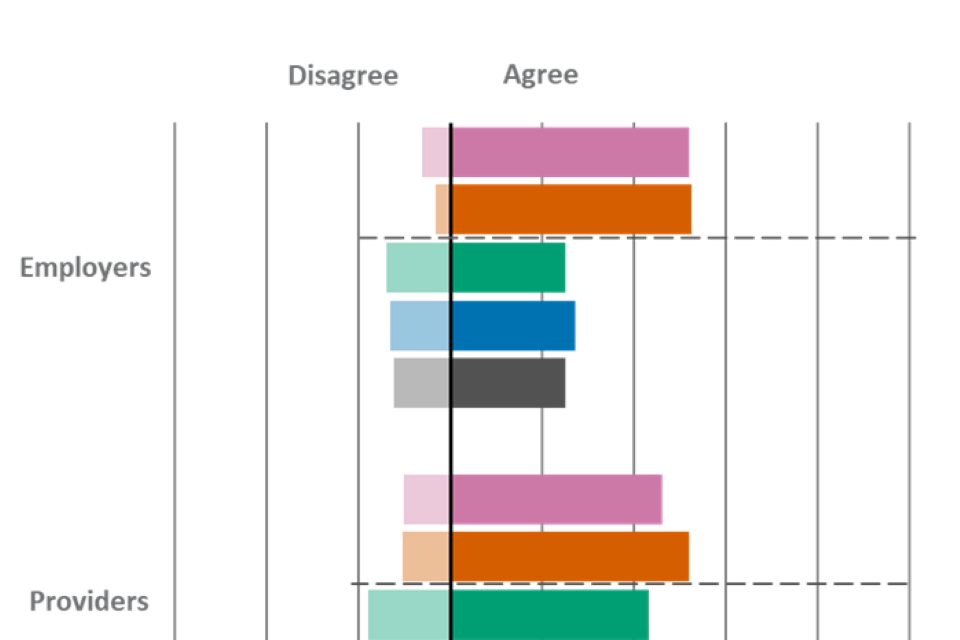
Overall, as shown in Figure 13, agreement that VTQs prepare learners well for the workplace was comparable with wave 4. It was highest among providers (80%), followed by learners (65%) and employers (39%).
Among the provider group, a much higher proportion of ITPs (84%) agreed that VTQs prepare learners well for the workplace, more so than among those in sixth forms (67%).
As seen previously, agreement levels differ greatly by employer size. Large (59%) employers were more likely than small (46%) and micro (37%) employers to agree that VTQs prepare learners well for the workplace.
Figure 13. Results for ‘vocational and technical qualifications prepare learners well for the workplace’ (Employers, All types of providers, Learners)
Please note that YouGov and Ofqual urge caution when drawing conclusions based on differences in the data in comparison with waves 1 and 2. This is due to key changes in the sampling approach and survey mode made for wave 3 onwards, which are outlined in more detail in the Introduction. The dotted line marks when the methodology changed.
Also note that there were also options provided in the survey for “Neither agree nor disagree” and “Don’t know”. Where the sum of the proportion who agreed and disagreed appears particularly low, this is due to the fact that large proportions of respondents fit within these other response categories.
| Group and agreement | Wave 1 | Wave 2 | Wave 3 | Wave 4 | Wave 5 |
|---|---|---|---|---|---|
| Employers – agree | 83% | 79% | 41% | 39% | 39% |
| Employers – disagree | 4% | 4% | 10% | 9% | 8% |
| Providers – agree | 79% | 82% | 76% | 85% | 80% |
| Providers – disagree | 4% | 3% | 7% | 4% | 6% |
| Learners – agree | 77% | 77% | 70% | 66% | 65% |
| Learners – disagree | 5% | 6% | 4% | 9% | 9% |
For figure 14, the wave 5 unweighted base is: All employers n=1,656; All types of providers, n=539.
The proportion agreeing that people achieving VTQs have the technical skills needed by employers, or their organisation, also remained comparable with wave 4.
There were stark differences in levels of agreement among employers and providers. Seven in ten (72%) providers agreed with this, compared to three in ten (33%) employers (see Figure 14). Among providers, agreement was higher among those from FE colleges than sixth forms (75% vs. 63%).
Figure 14. Results for ‘People achieving vocational and technical qualifications have the technical skills needed by employers in my organisation’ (Employers) and ‘People achieving vocational and technical qualifications have the technical skills needed by employers’ (All types of providers)
Please note that YouGov and Ofqual urge caution when drawing conclusions based on differences in the data in comparison with waves 1 and 2. This is due to key changes in the sampling approach and survey mode made for wave 3 onwards, which are outlined in more detail in the Introduction. The dotted line marks when the methodology changed.
Also note that there were also options provided in the survey for “Neither agree nor disagree” and “Don’t know”. Where the sum of the proportion who agreed and disagreed appears particularly low, this is due to the fact that large proportions of respondents fit within these other response categories.
| Group and agreement | Wave 1 | Wave 2 | Wave 3 | Wave 4 | Wave 5 |
|---|---|---|---|---|---|
| Employers – agree | 82% | 80% | 33% | 35% | 33% |
| Employers – disagree | 4% | 4% | 15% | 13% | 12% |
| Providers – agree | 78% | 67% | 75% | 72% | |
| Providers – disagree | 3% | 8% | 6% | 6% |
For figure 15, the wave 5 unweighted base is: All types of providers, n=539; All learners, n=533.
Levels of agreement that VTQs are good preparation for further study also remained comparable with wave 4. Approximately, seven in ten providers (71%) and learners (69%) agreed with this (see Figure 15).
Among learners, agreement was higher among older learners aged 25+ (74%) than those aged 18 or under (62%).
Figure 15. Results for ‘vocational and technical qualifications are good preparation for further study’ (All types of providers, Learners)
Please note that YouGov and Ofqual urge caution when drawing conclusions based on differences in the data in comparison with waves 1 and 2. This is due to key changes in the sampling approach and survey mode made for wave 3 onwards, which are outlined in more detail in the Introduction. The dotted line marks when the methodology changed.
Also note that there were also options provided in the survey for “Neither agree nor disagree” and “Don’t know”. Where the sum of the proportion who agreed and disagreed appears particularly low, this is due to the fact that large proportions of respondents fit within these other response categories.
| Group and agreement | Wave 1 | Wave 2 | Wave 3 | Wave 4 | Wave 5 |
|---|---|---|---|---|---|
| Providers – agree | 79% | 86% | 69% | 78% | 71% |
| Providers – disagree | 2% | 2% | 10% | 6% | 7% |
| Learners – agree | 79% | 81% | 69% | 73% | 69% |
| Learners – disagree | 4% | 3% | 8% | 5% | 7% |
For figure 16, the wave 5 unweighted base is: All employers who have arranged or funded training for employees in last 12 months, n=823.
Two-thirds (67%) of employers who have arranged or funded training for employees in the last 12 months said that for their employees who achieve a VTQ outside of an apprenticeship, this leads to new responsibilities (see Figure 16). This was comparable with wave 4 (70%).
Sixty-two percent of these employers said that for their employees who achieve a VTQ outside of an apprenticeship, this leads to a promotion or improved job status at least some of the time. This was also comparable with wave 4 (65%).
A comparable proportion (59%) of these employers said that for their employees who achieve a VTQ outside of an apprenticeship, this leads to a pay rise at least some of the time. This has decreased since wave 4 (64%). Overall, 9% of employers said that it leads to a pay increase all of the time (broadly consistent with wave 4, 9%).
Figure 16. Results for ‘For your employees who achieve vocational or technical qualifications outside an apprenticeship, how often, if ever, does this lead to the following?’ (Employers)
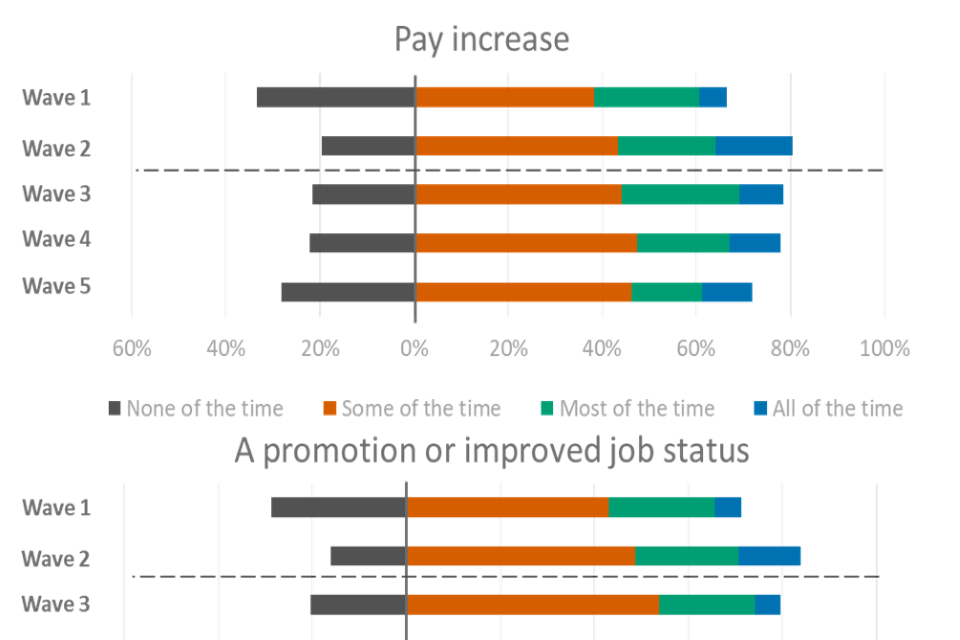
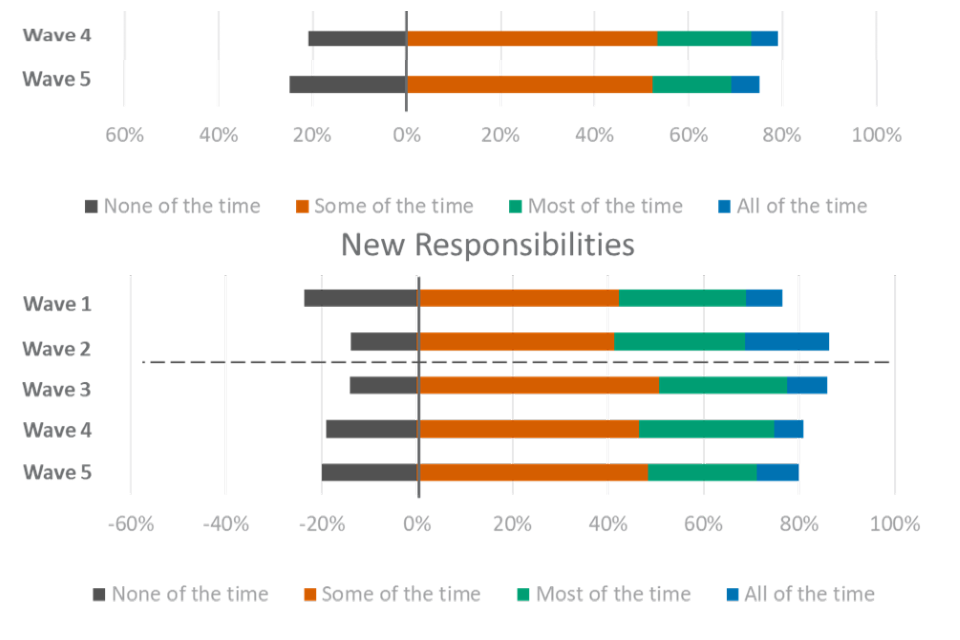
Please note that YouGov and Ofqual urge caution when drawing conclusions based on differences in the data in comparison with waves 1 and 2. This is due to key changes in the sampling approach and survey mode made for wave 3 onwards, which are outlined in more detail in the Introduction. The dotted line marks when the methodology changed.
| Pay increase | Wave 1 | Wave 2 | Wave 3 | Wave 4 | Wave 5 |
|---|---|---|---|---|---|
| Some of the time | 35% | 38% | 35% | 39% | 38% |
| None of the time | 31% | 17% | 17% | 18% | 23% |
| Most of the time | 21% | 18% | 20% | 16% | 12% |
| All of the time | 5% | 14% | 7% | 9% | 9% |
| Don’t know | 8% | 14% | 21% | 18% | 18% |
| A promotion or improved job status | Wave 1 | Wave 2 | Wave 3 | Wave 4 | Wave 5 |
|---|---|---|---|---|---|
| Some of the time | 40% | 42% | 43% | 44% | 43% |
| Most of the time | 21% | 19% | 16% | 16% | 14% |
| All of the time | 5% | 12% | 4% | 5% | 5% |
| None of the time | 27% | 14% | 16% | 17% | 20% |
| Don’t know | 7% | 13% | 21% | 17% | 18% |
| New responsibilities | Wave 1 | Wave 2 | Wave 3 | Wave 4 | Wave 5 |
|---|---|---|---|---|---|
| Some of the time | 39% | 36% | 40% | 40% | 40% |
| Most of the time | 25% | 24% | 21% | 25% | 19% |
| All of the time | 7% | 15% | 7% | 5% | 7% |
| None of the time | 22% | 12% | 11% | 17% | 17% |
| Don’t know | 7% | 13% | 20% | 13% | 17% |
Employers’ reasons for perceptions of vocational and technical qualifications
Employers who agreed that their organisations value VTQs (45%) were asked to explain further through an open response question.
The most commonly recurring explanations given by employers who agreed that their organisation values VTQs related to the more practical nature of these qualifications and the work-orientated structure in which they are conducted, meaning applicants’ skills were aligned with the job they started. There was also a sense that these applicants were better prepared for the workplace generally.
“We have a variety of roles which require practical and technical skills which these qualifications provide.”
“Quite simply: we need people. The business is very practical, we make things, so need practical vocational skills.”
“Usually we find that these candidates have a better understanding of the workplace as well as the qualification.”
Some employers also suggested that those with VTQs bring diverse skills to their organisation, highlighting the importance of employing individuals with some ‘real life’ experience. Others mentioned that they help determine the work ethic of applicants, and shows that they are dedicated.
“It gives the technical knowledge required and shows that an employee is committed to leaning.”
A lower proportion of employers (8%) disagreed that VTQs are valued in their organisation. In these cases, employers stated that VTQs were not relevant to them due to the size or nature of their organisation, while others said that their organisation sought traditional educational qualifications. Some employers indicated that employees need ‘higher level’ skills or qualifications. There was also a sense it can vary on a case by case basis.
“Candidates presenting with these qualifications have generally performed quite poorly compared to holders of more traditional qualifications i.e. GCSE A-C.”
“Personalities and learning styles vary enormously, so some people with tech qualifications are very good, whilst others struggle. We’ve seen an equal amount of people with, and without qualifications excel.”
Section 3: Perceptions of Functional Skills qualifications
Key findings – Functional Skills qualifications
-
Among employers, approximately one in four (26%) reported having a very or quite good understanding of FSQs. Medium (20%) and large employers (15%) were significantly more likely than smaller employers to report a very good understanding.
-
Learners who had undertaken an FSQ in the last three years most commonly said they decided to do so in order to progress in their studies (32%) or improve their English, maths or ICT skills (31%).
-
Among learners who had started taking an FSQ, the top perceived benefits of taking them were to be more confident using (27%) or improving (29%) their English, maths or ICT skills.
-
The provider group were most likely (65%) to agree that they value FSQs, followed by three-fifths (58%) of learners and a third (32%) of employers. These figures were all comparable with wave 4 findings. Large employers (48%) were more likely than medium (36%), small (39%) and micro (30%) employers to agree that their organisation values FSQs.
-
Over half (56%) of learners agreed that FSQs offer value for money, as did a similar proportion (47%) of the provider group.
-
Around half (49%) of learners agreed that the availability of FSQs is sufficiently flexible, compared with a much smaller proportion of employers (19%). These figures were comparable with wave 4.
-
Over half of learners and providers (60% and 56% respectively) agreed that those holding FSQs have the appropriate level of skill in English needed by employers, much higher than among employers themselves (30%).
-
Twenty-seven percent of employers agreed that those holding FSQs have the appropriate level of skill in maths needed by their organisation. Meanwhile, a notably larger proportion of learners and providers agreed when presented with the same statement (55% and 53% respectively). These levels of agreement were broadly consistent with wave 4.
-
Agreement levels that those holding FSQs have the appropriate level of skill in ICT needed by employers were highest among learners (51%) and lowest among employers (25%), with providers (40%) falling in between the two. Again, these findings were broadly consistent with wave 4.
-
Two-thirds (67%) of learners agreed that FSQs are good preparation for further study, alongside a slightly smaller proportion of providers (56%). These levels of agreement were broadly consistent with wave 4.
Understanding of Functional Skills qualifications by employers
For figure 17, the wave 5 unweighted base is: All employers, n=2,002.
As shown in Figure 17, approximately one in four (26%) employers reported that they have a very or quite good understanding of Functional Skills qualifications (FSQs), comparable with wave 4. An equivalent proportion (26%) said that they have a limited understanding. Overall, 18% of employers reported not having a very good understanding, leaving just under a third (30%) saying they have no understanding at all of FSQs.
Medium and large employers were significantly more likely than those in smaller organisations to report having a very good understanding of FSQs. Fifteen percent of employers at large organisations (250 or more employees) and 20% of those at medium organisations (50 to 249 employees) said they have a very good understanding, while this was the case for just 8% of small organisations (10 to 49 employees) and 6% of micro-organisations (2 to 9 employees).
Differences in levels of understanding also appear when comparing by sector. Public sector employers (15%) were significantly more likely than private sector employers (7%) to say they have a very good understanding of FSQs.
Figure 17. Results for ‘Please indicate your level of understanding about the four types of qualifications listed below.’ – Functional Skills qualifications (Employers)

Please note that YouGov and Ofqual urge caution when drawing conclusions based on differences in the data in comparison with waves 1 and 2. This is due to key changes in the sampling approach and survey mode made for wave 3 onwards, which are outlined in more detail in the Introduction. The dotted line marks when the methodology changed.
| Level of understanding | Wave 1 | Wave 2 | Wave 3 | Wave 4 | Wave 5 |
|---|---|---|---|---|---|
| Very good understanding | 8% | 12% | 8% | 9% | 7% |
| Quite good understanding | 26% | 25% | 18% | 20% | 19% |
| Limited understanding | 13% | 21% | 25% | 24% | 26% |
| Not very good understanding | 11% | 13% | 16% | 17% | 18% |
| No understanding at all | 43% | 30% | 33% | 31% | 30% |
Why learners chose Functional Skills qualifications
For figure 18, the wave 5 unweighted base is: Learners who are studying or have studied an FSQ in the last three years, n=179.
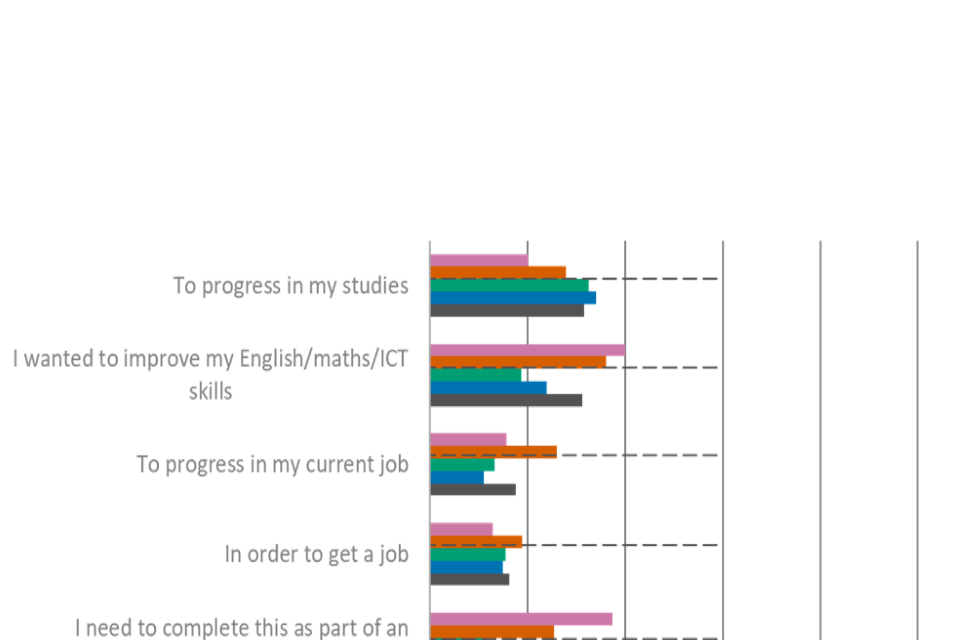
As shown in Figure 18, the two most common reasons learners said they decided to undertake an FSQ in the last three years was to progress in their studies (32%) or to improve their English, maths or ICT skills (31%). Progression in their studies was also the most cited reason in wave 4 (34%). Meanwhile, there was an increase in comparison with wave 4 (24%) in the proportion of learners who said that they undertook an FSQ to improve their skills.
The next most popular reasons reported by learners were to progress in their current job (18%), to facilitate getting a job (16%) or that they needed to complete it as part of an apprenticeship (16%). These findings were broadly consistent with wave 4.
Figure 18. Results for ‘Why did you decide to take a Functional Skills qualification?’ (Learners)
Please note that YouGov and Ofqual urge caution when drawing conclusions based on differences in the data in comparison with waves 1 and 2. This is due to key changes in the sampling approach and survey mode made for wave 3 onwards, which are outlined in more detail in the Introduction. The dotted line marks when the methodology changed.
| Statement | Wave 1 | Wave 2 | Wave 3 | Wave 4 | Wave 5 |
|---|---|---|---|---|---|
| To progress in my studies | 20% | 28% | 33% | 34% | 32% |
| I wanted to improve my English/maths/ICT skills | 40% | 36% | 19% | 24% | 31% |
| To progress in my current job | 16% | 26% | 13% | 11% | 18% |
| In order to get a job | 13% | 19% | 16% | 15% | 16% |
| I need to complete this as part of an apprenticeship | 37% | 25% | 12% | 17% | 16% |
| I did not pass a GCSE in English/maths/ICT | 24% | 16% | 12% | 13% | 12% |
| My employer advised/required me to | 14% | 18% | 13% | 14% | 11% |
| Other | 2% | 2% | 11% | 11% | 9% |
Benefits associated with Functional Skills qualifications by learners
For figure 19, the wave 5 unweighted base is: Learners who are studying or have studied an FSQ in the last three years, n=179.
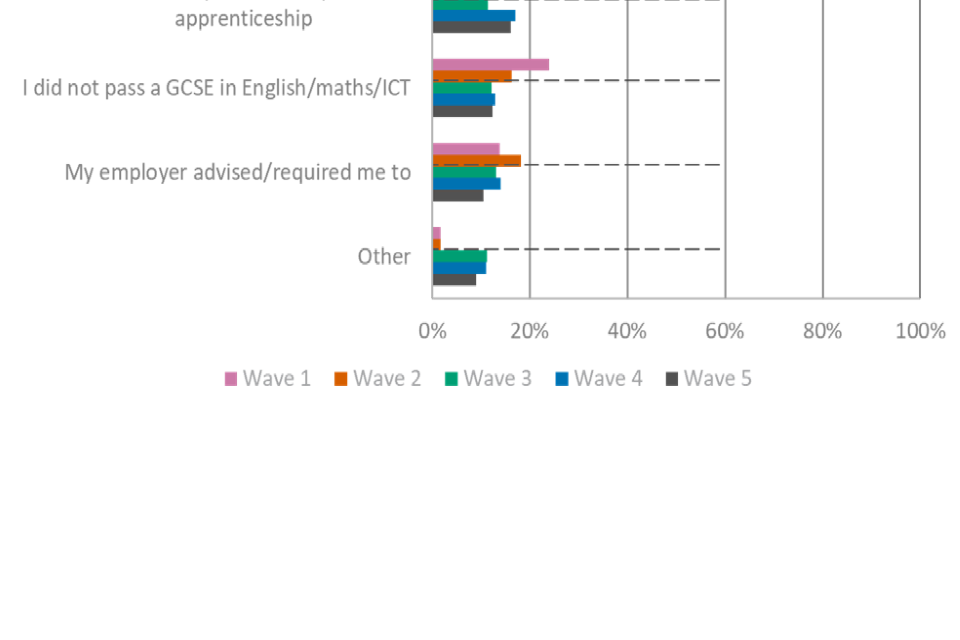
As shown in Figure 19, learners who had undertaken an FSQ in the last three years perceived that the top benefits associated with taking these qualifications were to be more confident using (27%) and improving their English, maths or ICT skills (29%). While this was broadly consistent with wave 4 for the former, there was an increase in the proportion of learners who cited skills improvements as an expected benefit (16% in wave 4).
Similar proportions of learners cited a range of other expected benefits of undertaking an FSQ, including better job prospects in the longer term (24%) and progressing to higher level qualifications (22%). These findings were broadly consistent with wave 4.
Figure 19. Results for ‘Now that you have started learning or have completed learning, what benefits do you expect from taking a Functional Skills qualification(s)?’ (Learners). ‘Don’t know’ was added in wave 3.
Please note that YouGov and Ofqual urge caution when drawing conclusions based on differences in the data in comparison with waves 1 and 2. This is due to key changes in the sampling approach and survey mode made for wave 3 onwards, which are outlined in more detail in the Introduction. The dotted line marks when the methodology changed.
| Statement | Wave 1 | Wave 2 | Wave 3 | Wave 4 | Wave 5 |
|---|---|---|---|---|---|
| My English/maths skills will improve | 51% | 32% | 20% | 16% | 29% |
| I will be more confident using English/maths/ICT | 34% | 31% | 22% | 24% | 27% |
| I will have better job prospects in the longer term | 22% | 26% | 24% | 23% | 24% |
| To progress to higher level qualifications | 22% | 33% | 22% | 27% | 22% |
| To be able to find a better job | 15% | 26% | 20% | 18% | 21% |
| I will be able to apply for more jobs | 20% | 24% | 19% | 19% | 20% |
| I will be able to apply English/maths/ICT skills in everyday life | 26% | 25% | 16% | 21% | 19% |
| To progress in my current job | 21% | 23% | 18% | 12% | 16% |
| I will be able to complete my apprenticeship | 30% | 20% | 10% | 15% | 9% |
| Other | 2% | 1% | 2% | 4% | 2% |
| Don’t know | 0% | 0% | 19% | 16% | 21% |
Perceptions of Functional Skills qualifications: value and flexibility
For figure 20, the wave 5 unweighted base is: Employers who have an understanding of FSQs, n=1,482; All types of providers, n=539; All learners, n=533.
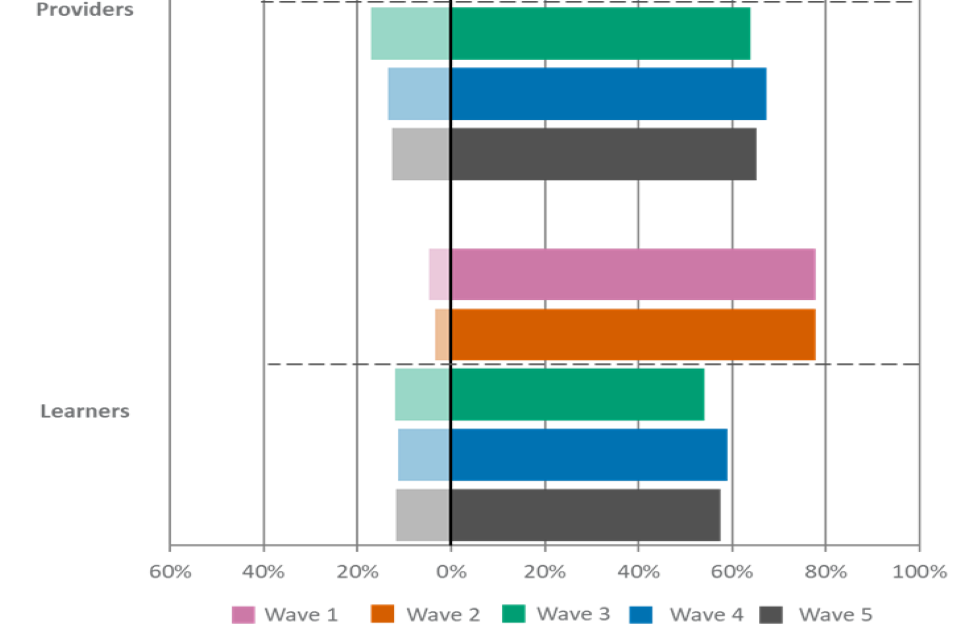
Agreement that different stakeholder groups value FSQs was comparable with wave 4 findings. Two-thirds (65%) of the provider group agreed that they value FSQs, making them the group most likely to support this statement (see Figure 20). Meanwhile, approximately three-fifths (58%) of learners agreed that they value these qualifications, followed by approximately a third (32%) of employers agreeing that their organisation values FSQs.
Large employers (48%) were more likely than medium (36%), small (39%) and micro (30%) employers to agree that their organisation values FSQs. This follows a similar trend to reported levels of understanding of these qualifications.
Among the provider group surveyed, agreement was broadly comparable across provider type, region, the type of public funds the provider was in receipt of and establishment size. However, those from sixth forms were less likely than those from Further Education (FE) or Adult Community Education (ACE) or Local Authority (LA) establishments to agree that they value FSQs (36% vs. 72%).
Older learners aged 25+ were more likely than those aged 19 to 24 to agree that they value FSQs (62% compared with 46%). Meanwhile, those aged 18 and under fell in between (58%).
Figure 20. Results for ‘To what extent do you agree or disagree with the following statements about Functional Skills qualifications?’ – I value Functional Skills qualifications (Learners, All types of providers) - We value Functional Skills qualifications (Employers)
Please note that YouGov and Ofqual urge caution when drawing conclusions based on differences in the data in comparison with waves 1 and 2. This is due to key changes in the sampling approach and survey mode made for wave 3 onwards, which are outlined in more detail in the Introduction. The dotted line marks when the methodology changed.
Also note that there were also options provided in the survey for “Neither agree nor disagree” and “Don’t know”. Where the sum of the proportion who agreed and disagreed appears particularly low, this is due to the fact that large proportions of respondents fit within these other response categories.
| Group and agreement | Wave 1 | Wave 2 | Wave 3 | Wave 4 | Wave 5 |
|---|---|---|---|---|---|
| Employers – agree | 91% | 91% | 46% | 32% | 32% |
| Employers – disagree | 4% | 2% | 10% | 11% | 12% |
| Providers – agree | 74% | 75% | 64% | 67% | 65% |
| Providers – disagree | 5% | 6% | 17% | 13% | 13% |
| Learners – agree | 78% | 78% | 54% | 59% | 58% |
| Learners – disagree | 5% | 4% | 12% | 11% | 12% |
For figure 21, the wave 5 unweighted base is: All types of providers, n=539; All learners, n=533.
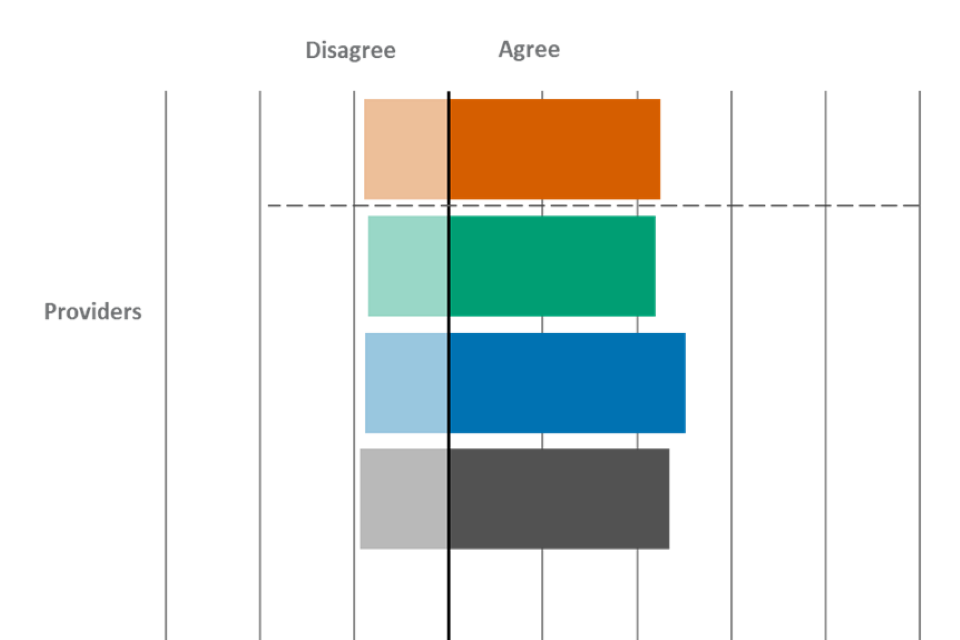
After being informed that employers, providers or colleges paid awarding organisations £15 to £20 per student in 2020 for each FSQ, over half (56%) of learners agreed that FSQs offer value for money, broadly consistent with wave 4 findings (56%) (see Figure 21). A slightly lower proportion (47%) of the provider group agreed with this statement, also comparable with wave 4 (50%).
For both the provider group and learners, there were relatively sizeable proportions who provided a neutral response to this statement or said they did not know. In fact, just 6% of learners disagreed that FSQs offer value for money, while 19% of the provider group disagreed. This was broadly consistent with wave 4 (7% and 18% respectively).
Among the provider group, agreement was broadly comparable across provider type, region, the type of public funds the provider was in receipt of and establishment size. However, those from sixth forms were less likely than those from FE or ACE or LA establishments to agree that FSQs offer value for money (26% vs. 60%).
Figure 21. Results for ‘In 2021 employers, training providers or colleges paid awarding organisations in the region of £15 to £20 per student for each Functional Skills qualification (Source: Ofqual 2021). To what extent do you agree or disagree with the following statement? – Functional Skills qualifications offer value for money.’ (Learners, All types of providers)
Please note that YouGov and Ofqual urge caution when drawing conclusions based on differences in the data in comparison with waves 1 and 2. This is due to key changes in the sampling approach and survey mode made for wave 3 onwards, which are outlined in more detail in the Introduction. The dotted line marks when the methodology changed.
Also note that there were also options provided in the survey for “Neither agree nor disagree” and “Don’t know”. Where the sum of the proportion who agreed and disagreed appears particularly low, this is due to the fact that large proportions of respondents fit within these other response categories.
| Group and agreement | Wave 2 | Wave 3 | Wave 4 | Wave 5 |
|---|---|---|---|---|
| Providers – agree | 45% | 44% | 50% | 47% |
| Providers – disagree | 18% | 17% | 18% | 19% |
| Learners – agree | 62% | 52% | 56% | 56% |
| Learners – disagree | 6% | 6% | 7% | 6% |
For figure 22, the wave 5 unweighted base is: Employers who have an understanding of n=FSQs, n=1,482; All learners, n=533.
As shown in Figure 22, a fifth (19%) of employers agreed that the availability of FSQs is sufficiently flexible, though only 3% strongly agreed with the statement. This was comparable with levels of agreement in wave 4 (20%). Broken down by organisation size, large employers (37%) were significantly more likely than small (25%) and micro (16%) employers to agree that the availability of FSQs is sufficiently flexible. There were no differences in levels of agreement by organisation size in comparison with wave 4.
Half (49%) of learners agreed that the availability of FSQs is sufficiently flexible, which was broadly consistent with wave 4 (46%). There were no differences in levels of agreement by learners’ age.
Figure 22. Results for ‘The availability of Functional Skills qualifications is sufficiently flexible’ (Employers, Learners)
Please note that YouGov and Ofqual urge caution when drawing conclusions based on differences in the data in comparison with waves 1 and 2. This is due to key changes in the sampling approach and survey mode made for wave 3 onwards, which are outlined in more detail in the Introduction. The dotted line marks when the methodology changed.
Also note that there were also options provided in the survey for “Neither agree nor disagree” and “Don’t know”. Where the sum of the proportion who agreed and disagreed appears particularly low, this is due to the fact that large proportions of respondents fit within these other response categories.
| Group and agreement | Wave 1 | Wave 2 | Wave 3 | Wave 4 | Wave 5 |
|---|---|---|---|---|---|
| Employers – agree | 40% | 40% | 19% | 20% | 19% |
| Employers – disagree | 5% | 2% | 8% | 7% | 7% |
| Learners – agree | 68% | 64% | 39% | 46% | 49% |
| Learners – disagree | 7% | 6% | 14% | 11% | 10% |
Perceptions of Functional Skills qualifications: purpose and future opportunity
For figure 23, the wave 5 unweighted base is: Employers who have an understanding of FSQs, n=1,482; All types of providers, n=539; All learners, n=533.
Agreement that those holding FSQs have the appropriate level of skill in English was broadly consistent with wave 4 findings for each of the three stakeholder groups. Three in five (60%) learners agreed that those holding FSQs have the appropriate level of skill in English needed by employers (see Figure 23). A similar proportion of providers agreed (56%), compared with a much lower proportion (30%) of employers.
Figure 23. Results for ‘People holding Functional Skills qualifications have the appropriate level of skill in English needed by my organisation’ (Employers) and ‘People holding Functional Skills qualifications have the appropriate level of skill in English needed by employers’ (All types of providers and Learners)
Please note that YouGov and Ofqual urge caution when drawing conclusions based on differences in the data in comparison with waves 1 and 2. This is due to key changes in the sampling approach and survey mode made for wave 3 onwards, which are outlined in more detail in the Introduction. The dotted line marks when the methodology changed.
Also note that there were also options provided in the survey for “Neither agree nor disagree” and “Don’t know”. Where the sum of the proportion who agreed and disagreed appears particularly low, this is due to the fact that large proportions of respondents fit within these other response categories.
| Group and agreement | Wave 1 | Wave 2 | Wave 3 | Wave 4 | Wave 5 |
|---|---|---|---|---|---|
| Employers – agree | 57% | 55% | 30% | 30% | 30% |
| Employers – disagree | 5% | 3% | 13% | 11% | 11% |
| Providers – agree | 59% | 63% | 51% | 58% | 56% |
| Providers – disagree | 9% | 10% | 22% | 17% | 19% |
| Learners – agree | 70% | 70% | 53% | 58% | 60% |
| Learners – disagree | 6% | 4% | 10% | 11% | 10% |
For figure 24, the wave 5 unweighted base is: Employers who have an understanding of FSQs, n=1,482; All types of providers, n=539; All learners, n=533.
Agreement that those holding FSQs have the appropriate level of skill in maths needed by their organisation followed the same patterns as for English. Learners and providers were most likely to agree (55% and 53% respectively), with a smaller proportion of employers agreeing (27%) (see Figure 24). These levels of agreement were broadly consistent with wave 4 for each of the three groups.
Public sector employers (44%) were more likely to agree with the statement than private sector employers (27%).
Among learners, levels are agreement were broadly consistent across the various age brackets.
Figure 24. Results for ‘People holding Functional Skills qualifications have the appropriate level of skill in maths needed by my organisation’ (Employers) and ‘People holding Functional Skills qualifications have the appropriate level of skill in maths needed by employers’ (All types of providers and Learners)
Please note that YouGov and Ofqual urge caution when drawing conclusions based on differences in the data in comparison with waves 1 and 2. This is due to key changes in the sampling approach and survey mode made for wave 3 onwards, which are outlined in more detail in the Introduction. The dotted line marks when the methodology changed.
Also note that there were also options provided in the survey for “Neither agree nor disagree” and “Don’t know”. Where the sum of the proportion who agreed and disagreed appears particularly low, this is due to the fact that large proportions of respondents fit within these other response categories.
| Group and agreement | Wave 1 | Wave 2 | Wave 3 | Wave 4 | Wave 5 |
|---|---|---|---|---|---|
| Employers – agree | 55% | 54% | 27% | 28% | 27% |
| Employers – disagree | 6% | 3% | 14% | 13% | 13% |
| Providers – agree | 57% | 62% | 48% | 58% | 53% |
| Providers – disagree | 10% | 10% | 23% | 16% | 17% |
| Learners – agree | 68% | 68% | 50% | 58% | 55% |
| Learners – disagree | 7% | 6% | 12% | 11% | 11% |
For figure 25, the wave 5 unweighted base is: Employers who have an understanding of FSQs, n=1,482; All types of providers, n=539; All learners, n=533.
As shown in Figure 25, Agreement levels that those holding FSQs have the appropriate level of skill in ICT needed by employers were highest among learners (51%) and lowest among employers (25%), with providers (40%) falling in between. These findings were broadly consistent with wave 4.
Large employers (36%) were more likely than micro employers (23%) to agree that people holding FSQs have the appropriate level of skill in ICT needed by their organisation.
Figure 25. Results for ‘Functional Skills qualifications have the appropriate level of skill in ICT needed by my organisation’ (Employers) ‘People holding Functional Skills qualifications have the appropriate level of skill in ICT needed by employers’ (All types of providers and Learners)
Please note that YouGov and Ofqual urge caution when drawing conclusions based on differences in the data in comparison with waves 1 and 2. This is due to key changes in the sampling approach and survey mode made for wave 3 onwards, which are outlined in more detail in the Introduction. The dotted line marks when the methodology changed.
Also note that there were also options provided in the survey for “Neither agree nor disagree” and “Don’t know”. Where the sum of the proportion who agreed and disagreed appears particularly low, this is due to the fact that large proportions of respondents fit within these other response categories.
| Group and agreement | Wave 1 | Wave 2 | Wave 3 | Wave 4 | Wave 5 |
|---|---|---|---|---|---|
| Employers – agree | 52% | 52% | 25% | 27% | 25% |
| Employers – disagree | 6% | 3% | 14% | 13% | 12% |
| Providers – agree | 46% | 52% | 43% | 46% | 40% |
| Providers – disagree | 10% | 10% | 18% | 16% | 19% |
| Learners – agree | 67% | 64% | 43% | 51% | 51% |
| Learners – disagree | 7% | 6% | 12% | 11% | 10% |
For figure 26, the wave 5 unweighted base is: All types of providers, n=539; All learners, n=533.
As shown in Figure 26, two-thirds (67%) of learners agreed that FSQs are good preparation for further study, broadly consistent with wave 4 (68%). A slightly smaller proportion of providers (56%), although still the majority, agreed with this statement. Levels of agreement among providers returned to those recorded in wave 3, which was only a marginal shift in comparison with wave 4 (64%).
Older learners aged 25+ (71%) were more likely to agree that FSQs are good preparation for further study than those aged 19 to 24 (55%). Meanwhile, those aged 18 and under fell roughly in the middle (66%).
There were no differences in providers’ perceptions based on region, size of institution or funding source.
Figure 26. Results for ‘Functional Skills qualifications are good preparation for further study’ (All types of providers and Learners)
Please note that YouGov and Ofqual urge caution when drawing conclusions based on differences in the data in comparison with waves 1 and 2. This is due to key changes in the sampling approach and survey mode made for wave 3 onwards, which are outlined in more detail in the Introduction. The dotted line marks when the methodology changed.
Also note that there were also options provided in the survey for “Neither agree nor disagree” and “Don’t know”. Where the sum of the proportion who agreed and disagreed appears particularly low, this is due to the fact that large proportions of respondents fit within these other response categories.
| Group and agreement | Wave 1 | Wave 2 | Wave 3 | Wave 4 | Wave 5 |
|---|---|---|---|---|---|
| Providers – agree | 65% | 71% | 56% | 64% | 56% |
| Providers – disagree | 8% | 9% | 20% | 20% | 21% |
| Learners – agree | 75% | 75% | 64% | 68% | 67% |
| Learners – disagree | 4% | 4% | 9% | 7% | 8% |
Employer reasons for perceptions of Functional Skills qualifications
Employers who agreed that their organisation values FSQs (32%) gave a variety of reasons for this through an open response question. As observed in wave 4, many said this was because FSQs are a requirement for their organisation, or that they perceive maths and English skills to be vital. There were also many employers who wrote that they feel FSQs offer important skills, demonstrate capability, and increase employability.
“Demonstrates a level of knowledge to work on our organisation.”
“They provide a basis level of essential knowledge upon which we can build required specialist skills, or develop functional skills further as may be appropriate for the job role.”
“A practical way of enhancing maths and English abilities.”
“Where the functional skill is relevant to our work needs they are valuable.”
Among the minority of employers who disagreed that their organisation values FSQs (12%), a common reason given was that they are not relevant to their business or sector. Many also said that they prefer or require other qualifications, and often that a higher education degree or other professional qualification is needed in order to work for their organisation. In addition, employers often expressed that they require more technical or specialist capabilities than they feel FSQs offer.
“While useful as a starting point for learners, they do not offer an appropriate level of literacy, numeracy or IT skills and work skills for employers.”
“We need people with higher degree/professional qualifications for the specific contracts we undertake.”
“They are not academic enough for the line of work.”
“It is not appropriate to my company.”
Section 4: Perceptions of End-point assessments
Key findings – End-point assessments
-
Overall, approximately three in ten (28%, compared to 29% in wave 4) employers reported having a very or quite good understanding of apprenticeships in their sector. Understanding increased with employer size, with large employers most likely to say that they have a good (54%) understanding.
-
Among employers who have at least some understanding of apprenticeship EPAs in their sector, 15% reported having a very or quite good understanding. Only 3% said that they have a very good understanding of these assessments, broadly consistent with the previous wave.
-
Understanding of apprenticeship EPAs was higher among the provider group in comparison to employers, with three-fifths (58%) of the provider group reporting having a very or quite good understanding of these. This was comparable with wave 4 (61%).
-
Among learners, understanding of apprenticeship EPAs was lower than among the provider group, but higher than for employers. Under half (45%) of learners reported a good (very or quite good) understanding of these.
-
Slightly under six in ten (58%) of the provider group said that they know the difference between apprenticeship frameworks and the new apprenticeship standards. Awareness of the difference was much lower among employers, with only 7% reporting this.
-
Awareness that EPAs are specific to apprenticeship standards was highest among the provider group (78%), followed by learners (69%), with employers reporting much lower understanding (18%). Each of these figures are comparable with wave 4 findings.
-
It was most common for learners to say that they decided to take an apprenticeship because they can learn new skills on the job (37%), in order to find a better job (30%), or to improve their skills (28%).
-
Learners were most likely to say that they decided to take an apprenticeship so they would have more confidence in applying their skills/knowledge (45%), to have a broader range of skills to apply in the workplace and a broader range of skills to apply in the workplace (37%), or to have better knowledge of how to do their job and being able to progress in their job (both 36%).
-
Over half (54%) of learners said that they value EPAs of apprenticeship standards, comparable with wave 4 (56%). A similar proportion (50%) of the provider group said that they value these assessments, which was also comparable with wave 4 findings (54%). A slightly lower proportion (43%) of employers agreed that they value EPAs of apprenticeship standards, which has fallen from 49% in wave 4 and is now comparable with wave 3.
-
Views for the provider group were split over whether or not apprenticeship EPAs offer value for money. Slightly under half (47%) agreed, whilst 19% disagreed.
-
Two-fifths (40%) of learners agreed that the availability of EPAs is sufficiently flexible, compared to 37% of the provider group and 32% of employers.
-
Overall, 63% of the provider group agreed that people passing EPAs have the competence and vocational and technical skills needed by employers, broadly comparable with wave 4 (62%). This was comparable to learners (56%) but higher than employers (45%).
-
Over half (56%) of learners said that they understand the purpose of apprenticeship EPAs, comparable with wave 4 findings (59%).
Understanding of End-point assessments
For figure 27, the wave 5 unweighted base is: All employers, n=2,002.
Understanding of apprenticeships in their sector among employers was comparable with wave 4. Overall, as shown in Figure 27, approximately three in ten (28%, 29% in wave 4) employers reported having a very or quite good understanding of apprenticeships in their sector. Only 5% of employers said that they have a very good understanding of apprenticeships in their sector.
Large employers (18%) were more likely than small (8%) or micro (4%) employers to say that they have a very good understanding of end-point assessments (EPAs) of apprenticeships in their sector. In fact, over half (54%) of large employers said that they have a good (very or quite good) understanding of apprenticeships in their sector. Micro employers were more likely than larger employers to say that they have no understanding at all (28% vs. 7% of large employers). These patterns were broadly consistent with wave 4 findings.
Figure 27. Results for ‘Please indicate your level of understanding about the four types of qualifications listed below.’ – Apprenticeships in my sector (Employers)

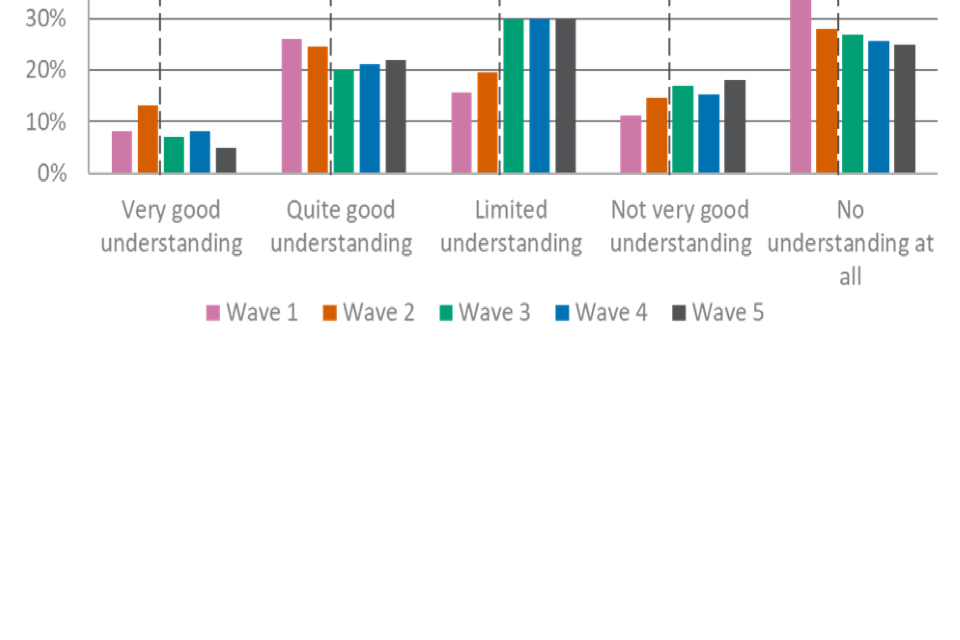
Please note that YouGov and Ofqual urge caution when drawing conclusions based on differences in the data in comparison with waves 1 and 2. This is due to key changes in the sampling approach and survey mode made for wave 3 onwards, which are outlined in more detail in the Introduction. The dotted line marks when the methodology changed.
| Level of understanding | Wave 1 | Wave 2 | Wave 3 | Wave 4 | Wave 5 |
|---|---|---|---|---|---|
| Very good understanding | 8% | 13% | 7% | 8% | 5% |
| Quite good understanding | 26% | 25% | 20% | 21% | 22% |
| Limited understanding | 16% | 20% | 30% | 30% | 30% |
| Not very good understanding | 11% | 15% | 17% | 15% | 18% |
| No understanding at all | 39% | 28% | 27% | 26% | 25% |
For figure 28, the wave 5 unweighted base is: All employers who have at least some understanding of apprenticeship EPAs in their sector, n=1,585.
Among employers who have at least some understanding of apprenticeship EPAs in their sector, understanding of apprenticeship EPAs was also comparable with wave 4. Overall, 15% (also 15% in wave 4) of employers reported having a very or quite good understanding of apprenticeship EPAs (see Figure 28). Only 3% said that they have a very good understanding of these assessments, broadly consistent with the previous wave.
Large employers (10%) were more likely than micro (3%) employers to say that they have a very good understanding of apprenticeship EPAs. Micro employers were more likely than large employers to say that they have no understanding at all of EPAs (54% vs. 27% of large employers). These patterns were broadly consistent with wave 4 findings.
Figure 28. Results for ‘Please indicate which of the following statements best describes your understanding of end-point assessment of apprenticeships.’ (Employers)
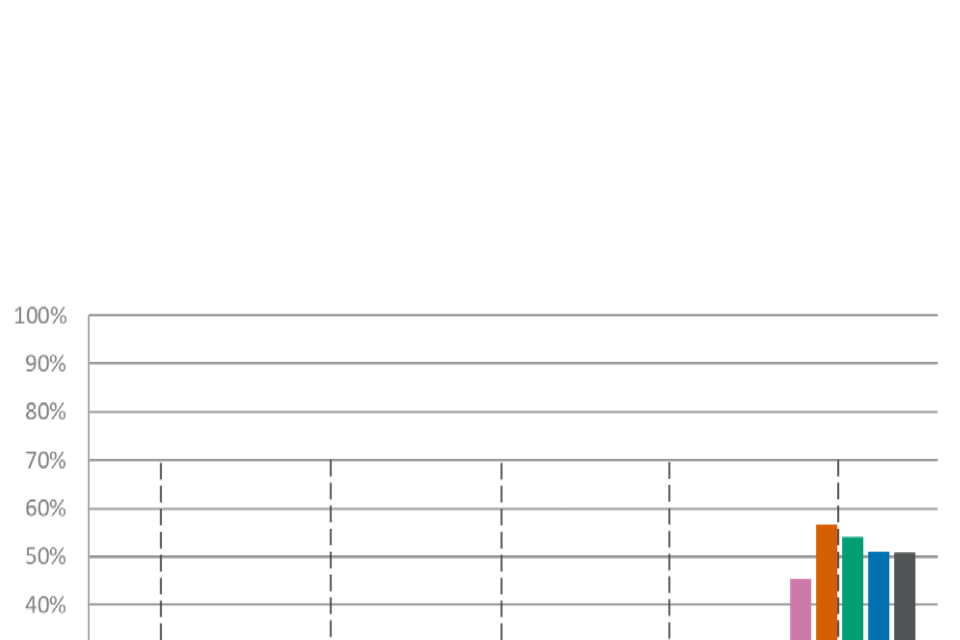
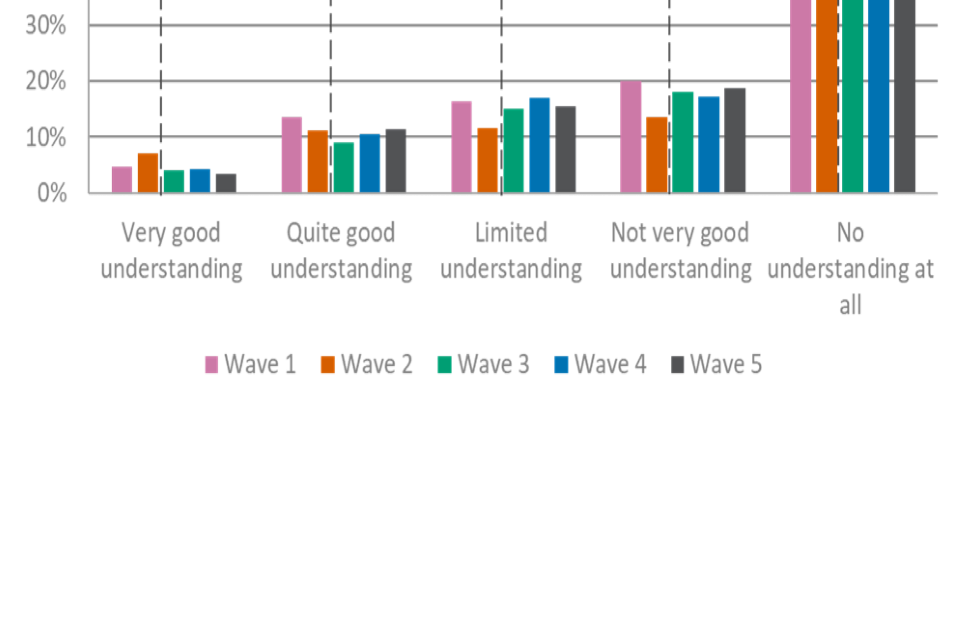
Please note that YouGov and Ofqual urge caution when drawing conclusions based on differences in the data in comparison with waves 1 and 2. This is due to key changes in the sampling approach and survey mode made for wave 3 onwards, which are outlined in more detail in the Introduction. The dotted line marks when the methodology changed.
| Level of understanding | Wave 1 | Wave 2 | Wave 3 | Wave 4 | Wave 5 |
|---|---|---|---|---|---|
| Very good understanding | 5% | 7% | 4% | 4% | 3% |
| Quite good understanding | 14% | 11% | 9% | 10% | 11% |
| Limited understanding | 16% | 12% | 15% | 17% | 16% |
| Not very good understanding | 20% | 14% | 18% | 17% | 19% |
| No understanding at all | 45% | 57% | 54% | 51% | 51% |
For figure 29, the wave 5 unweighted base is: All types of providers, n=539.
Understanding of apprenticeship EPAs was much higher among the provider group, with nearly three-fifths (58%) of the provider group reporting having a very or quite good understanding of these (see Figure 29). This was comparable with wave 4 (61%). Thirty-seven percent reported having a very good understanding of apprenticeship EPAs, higher than the proportion saying they have a quite good understanding (22%).
There were stark differences when looking at provider type, with ITPs much more likely to have had a good understanding (79%) of apprenticeship EPAs, compared to those from FE or ACE or LA establishments (33%) or sixth forms (11%).
Figure 29. Results for ‘Which of the following describes your understanding of end-point assessment of apprenticeships?’ (All types of providers)
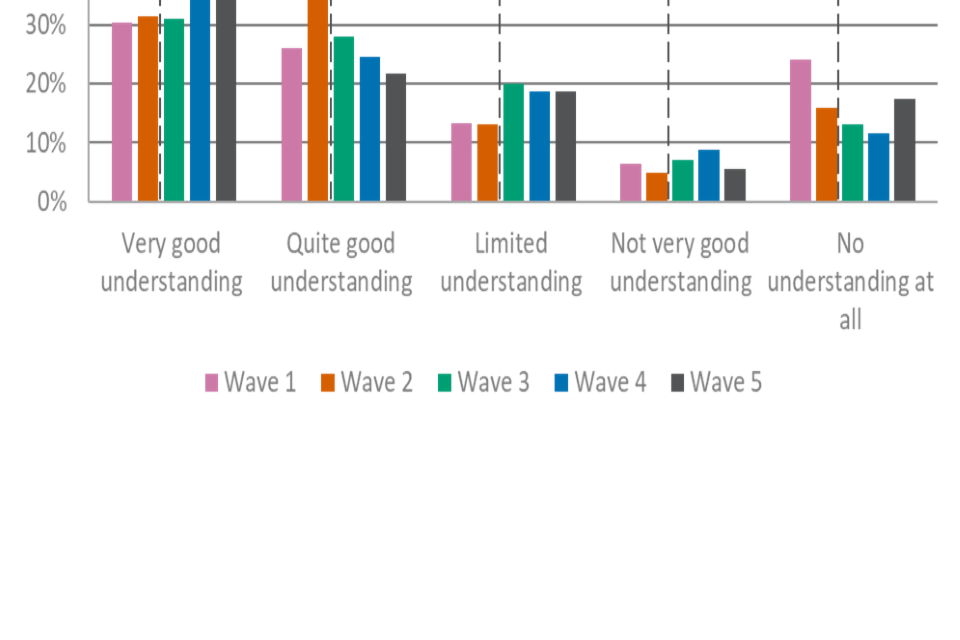
Please note that YouGov and Ofqual urge caution when drawing conclusions based on differences in the data in comparison with waves 1 and 2. This is due to key changes in the sampling approach and survey mode made for wave 3 onwards, which are outlined in more detail in the Introduction. The dotted line marks when the methodology changed.
| Level of understanding | Wave 1 | Wave 2 | Wave 3 | Wave 4 | Wave 5 |
|---|---|---|---|---|---|
| Very good understanding | 30% | 31% | 31% | 36% | 37% |
| Quite good understanding | 26% | 35% | 28% | 24% | 22% |
| Limited understanding | 13% | 13% | 20% | 19% | 19% |
| Not very good understanding | 6% | 5% | 7% | 9% | 6% |
| No understanding at all | 24% | 16% | 13% | 12% | 17% |
For figure 30, the wave 5 unweighted base is: All learners who are taking an apprenticeship, n=90.
Understanding of apprenticeship EPAs among learners remained lower than among the provider group, but higher than among employers. Under half (45%) of learners reported a very or quite good understanding of these, comprised of 15% reporting a very good understanding and 30% a quite good understanding (see Figure 30).
Figure 30. Results for ‘Please tell us which of the following statements best describes your understanding of end-point assessment of apprenticeships’ (Learners)
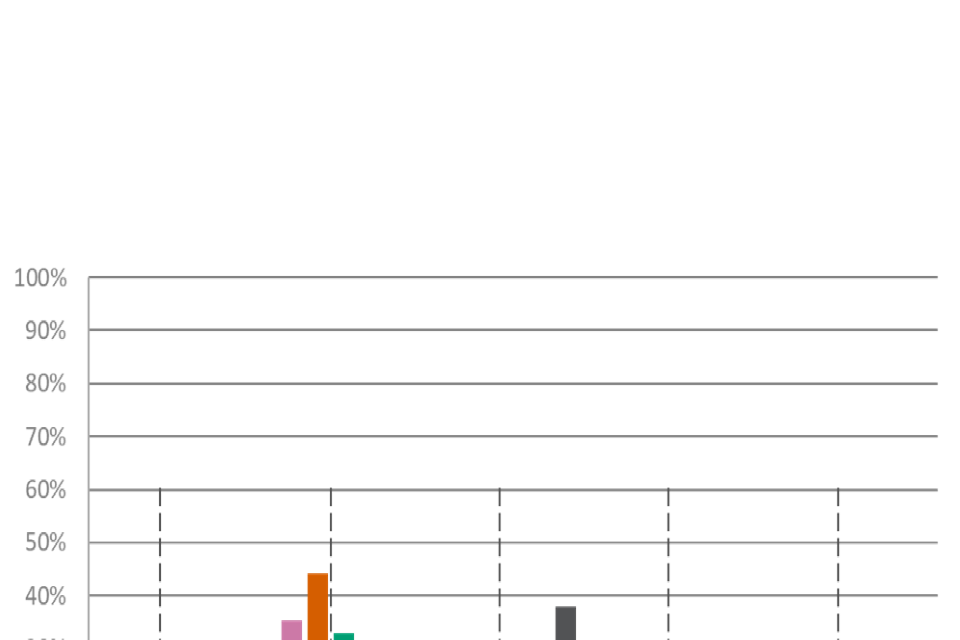
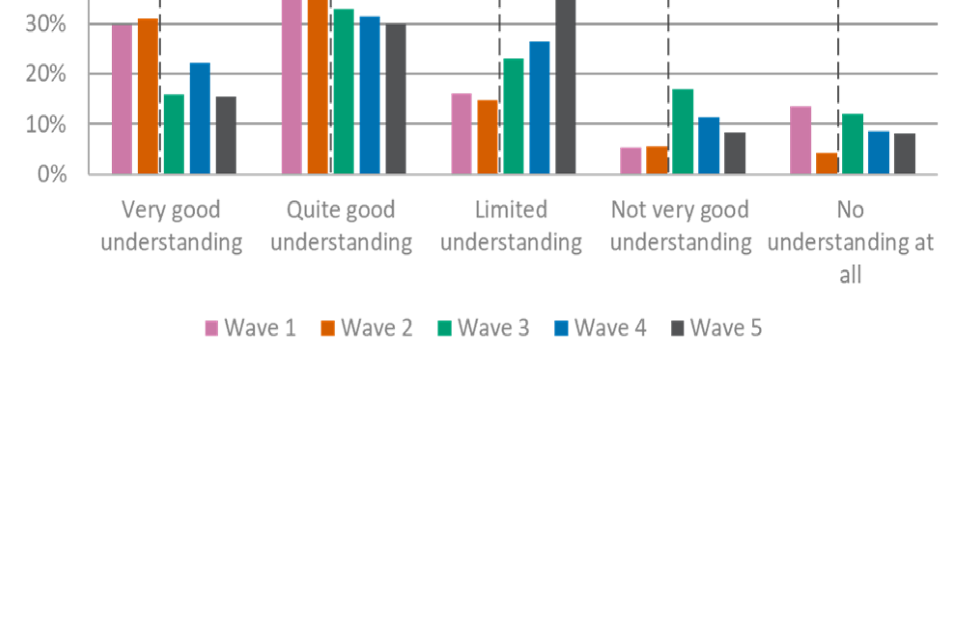
Please note that YouGov and Ofqual urge caution when drawing conclusions based on differences in the data in comparison with waves 1 and 2. This is due to key changes in the sampling approach and survey mode made for wave 3 onwards, which are outlined in more detail in the Introduction. The dotted line marks when the methodology changed.
| Level of understanding | Wave 1 | Wave 2 | Wave 3 | Wave 4 | Wave 5 |
|---|---|---|---|---|---|
| Very good understanding | 30% | 31% | 16% | 22% | 15% |
| Quite good understanding | 35% | 44% | 33% | 31% | 30% |
| Limited understanding | 16% | 15% | 23% | 27% | 38% |
| Not very good understanding | 5% | 6% | 17% | 11% | 8% |
| No understanding at all | 14% | 4% | 12% | 9% | 8% |
For figure 31, the wave 5 unweighted base is: All employers, n=1,585; All types of providers, n=539.
Slightly under six in ten (58%) of the provider group said that they know the difference between apprenticeship frameworks and the new apprenticeship standards (see Figure 31). Understanding was much higher among ITPs (75%) than for those from FE or ACE or LA establishments (37%), with an even lower understanding within sixth forms (12%).
Only 7% of employers said that they know the difference between apprenticeship frameworks and the new apprenticeship standards. This was comparable with wave 4 (8%). However, knowledge increased with organisation size rising among larger employers; this was highest among large employers (22%) with comparable levels of knowledge for medium employers (19%), but lower for small (7%) and micro (7%) employers.
Figure 31. Results for ‘Do you understand the difference between apprenticeship frameworks and the new apprenticeship standards?’ (Employers, All types of providers)
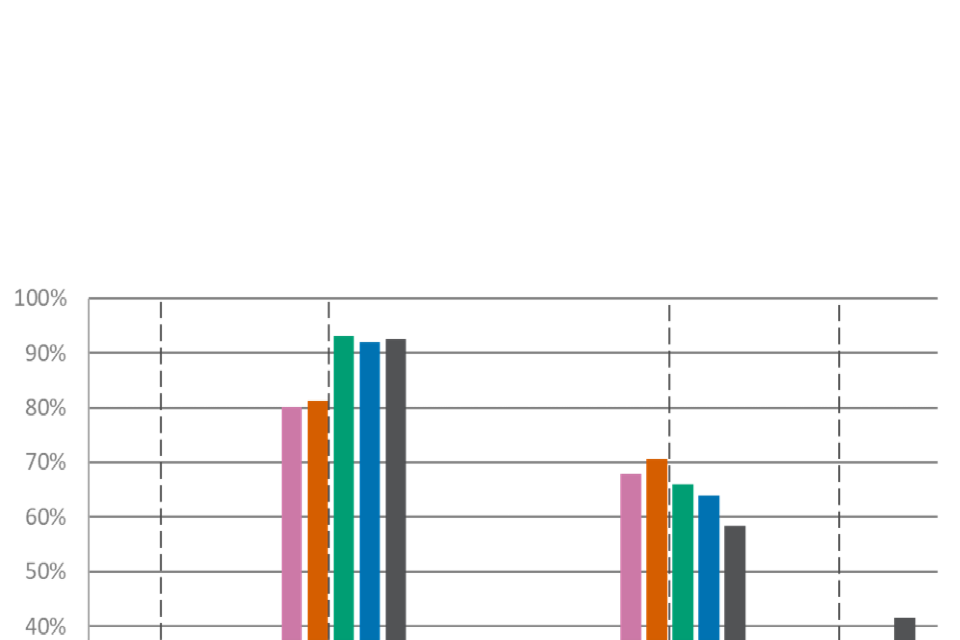
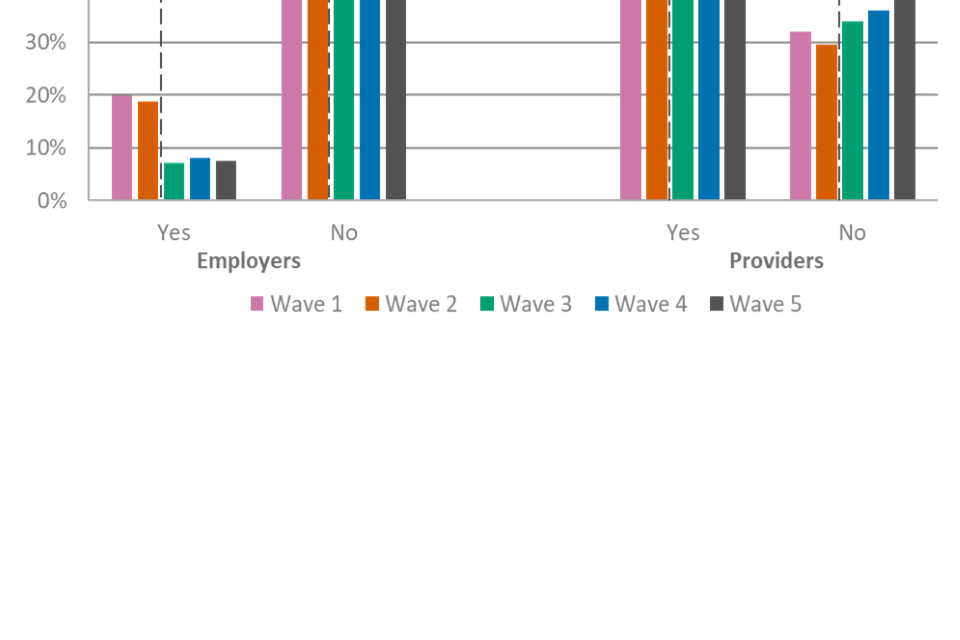
Please note that YouGov and Ofqual urge caution when drawing conclusions based on differences in the data in comparison with waves 1 and 2. This is due to key changes in the sampling approach and survey mode made for wave 3 onwards, which are outlined in more detail in the Introduction. The dotted line marks when the methodology changed.
| Wave 1 | Wave 2 | Wave 3 | Wave 4 | Wave 5 | |
|---|---|---|---|---|---|
| Employers - Yes | 20% | 19% | 7% | 8% | 7% |
| Employers - No | 80% | 81% | 93% | 92% | 93% |
| Providers - Yes | 68% | 71% | 66% | 64% | 58% |
| Providers - No | 32% | 30% | 34% | 36% | 42% |
| No understanding at all | 14% | 4% | 12% | 9% | 8% |
For figure 32, the wave 5 unweighted base is: All who have at least some understanding of EPAs. Employers, n=1,585; All types of providers, n=539; learners, n=90.
Awareness that EPAs are specific to apprenticeship standards was highest among the provider group (78%), followed by learners (69%), with employers reporting much lower understanding (18%) (see Figure 32). Each of these figures were comparable with wave 4 findings.
In line with their generally higher levels of understanding related to qualifications, almost all (94%) ITPs said that they were aware EPAs are specific to apprenticeship standards. This was higher than for those from FE or ACE or LA establishments (68%), with a lower awareness in sixth forms (30%).
Awareness of EPAs varied greatly by employer size. A third of large (34%) and medium (33%) employers said that they were aware EPAs are specific to apprenticeship standards, higher than small (18%) and micro (17%) employers.
Figure 32. Results for ‘Are you aware that end-point assessments (EPAs) are specific to apprenticeship standards?’ (Employers, All types of providers, Learners)
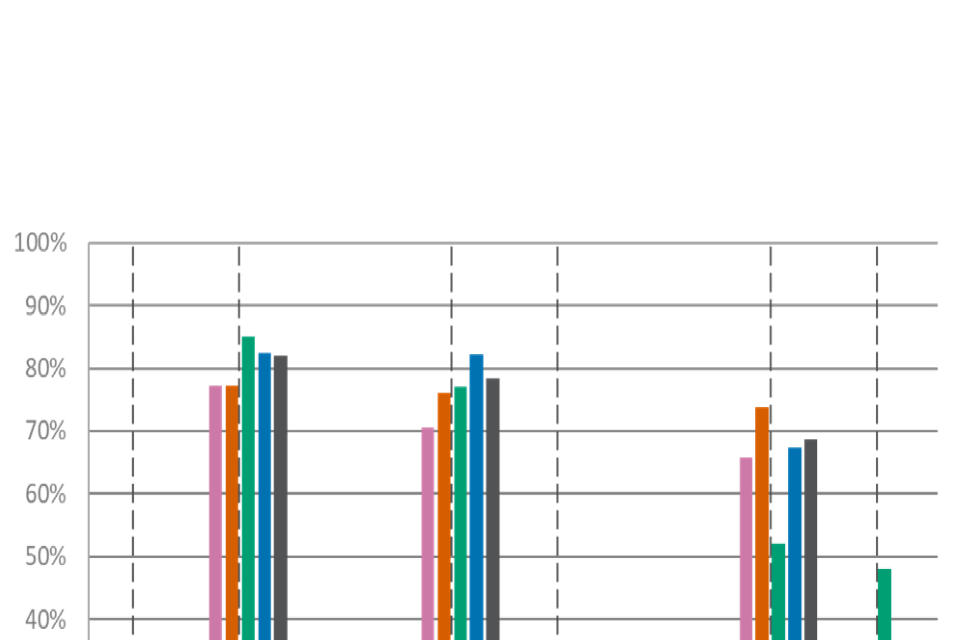
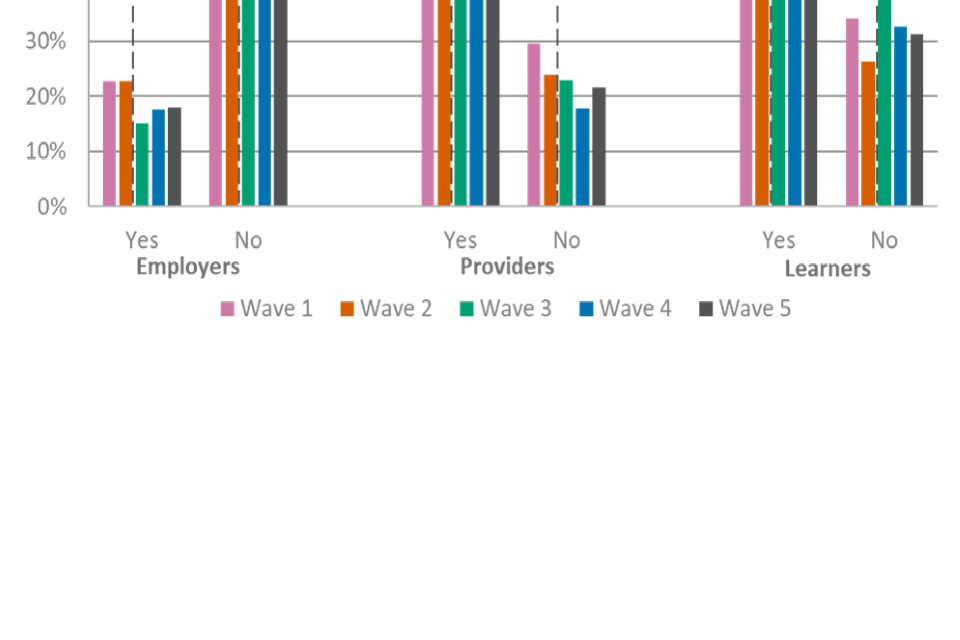
Please note that YouGov and Ofqual urge caution when drawing conclusions based on differences in the data in comparison with waves 1 and 2. This is due to key changes in the sampling approach and survey mode made for wave 3 onwards, which are outlined in more detail in the Introduction. The dotted line marks when the methodology changed.
| Group and response | Wave 1 | Wave 2 | Wave 3 | Wave 4 | Wave 5 |
|---|---|---|---|---|---|
| Employers - Yes | 23% | 23% | 15% | 18% | 18% |
| Employers - No | 77% | 77% | 85% | 82% | 82% |
| Providers - Yes | 71% | 76% | 77% | 82% | 78% |
| Providers - No | 30% | 24% | 23% | 18% | 22% |
| Learners - Yes | 66% | 74% | 52% | 67% | 69% |
| Learners - No | 34% | 26% | 48% | 33% | 31% |
Why learners chose an apprenticeship
For figures 33 and 34, the wave 5 unweighted base is: All learners who are taking an apprenticeship, n=90.
As shown in Figure 33, it was most common for learners to say that they decided to take an apprenticeship because they can learn new skills on the job (37%), in order to find a better job (30%), or to improve their skills (28%). Interest in the vocational or technical area (24%), to progress in their current job (24%), or to progress in their current studies (18%) were less common reasons given by learners.
Figure 33. Results for ‘Why did you decide to take an apprenticeship?’ (Learners)
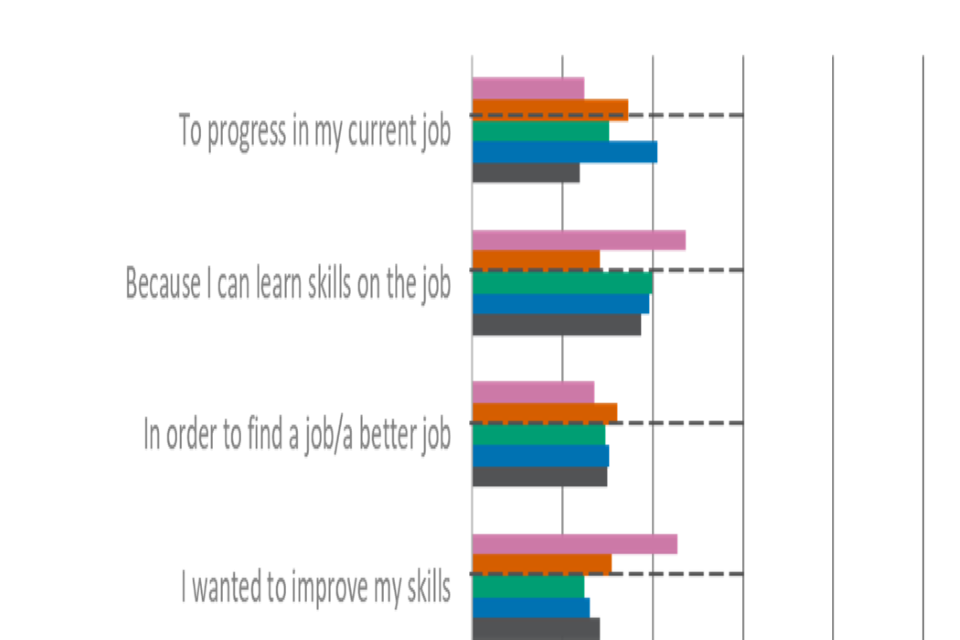
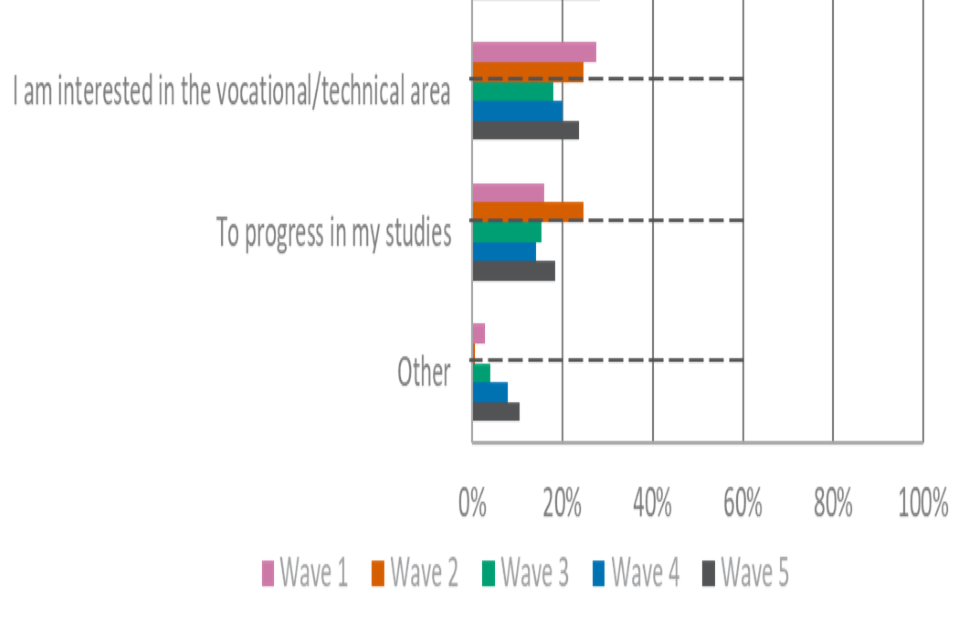
Please note that YouGov and Ofqual urge caution when drawing conclusions based on differences in the data in comparison with waves 1 and 2. This is due to key changes in the sampling approach and survey mode made for wave 3 onwards, which are outlined in more detail in the Introduction. The dotted line marks when the methodology changed.
| Statement | Wave 1 | Wave 2 | Wave 3 | Wave 4 | Wave 5 |
|---|---|---|---|---|---|
| Because I can learn skills on the job | 47% | 28% | 40% | 39% | 37% |
| In order to find a job/a better job | 27% | 32% | 30% | 30% | 30% |
| I wanted to improve my skills | 46% | 31% | 25% | 26% | 28% |
| To progress in my current job | 25% | 35% | 30% | 41% | 24% |
| I am interested in the vocational/technical area | 27% | 25% | 18% | 20% | 24% |
| To progress in my studies | 16% | 25% | 15% | 14% | 18% |
| Other | 3% | 1% | 4% | 8% | 10% |
Benefits associated with apprenticeships by learners
As shown in Figure 34, learners were most likely to say that they will have more confidence in applying their skills or knowledge (45%) now that they have started or completed learning. The next most common reported benefit was to have a broader range of skills to apply in the workplace and a broader range of skills to apply in the workplace (37%). Joint third most common benefits were having better knowledge of how to do their job and being able to progress in their job (both 36%).
Figure 34. Results for ‘Now that you have started learning/have completed learning, what benefits do you expect to get from taking an apprenticeship?’ (Learners)
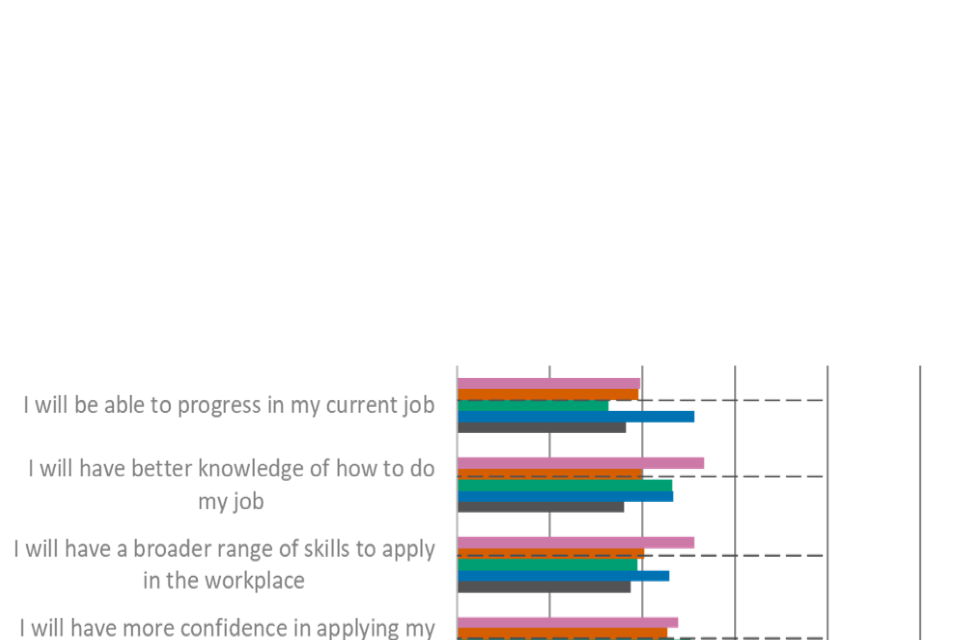
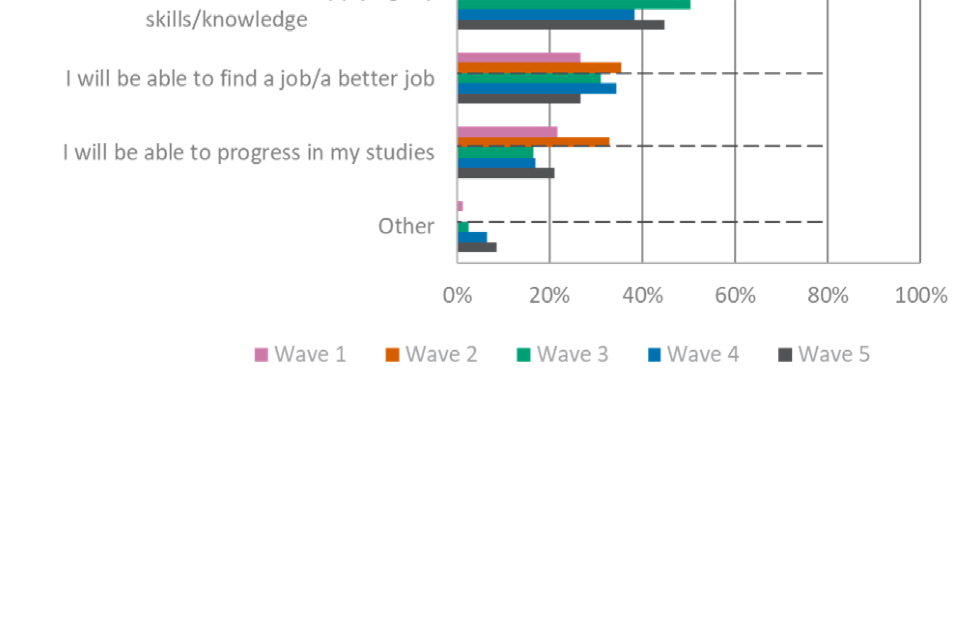
Please note that YouGov and Ofqual urge caution when drawing conclusions based on differences in the data in comparison with waves 1 and 2. This is due to key changes in the sampling approach and survey mode made for wave 3 onwards, which are outlined in more detail in the Introduction. The dotted line marks when the methodology changed.
| Statement | Wave 1 | Wave 2 | Wave 3 | Wave 4 | Wave 5 |
|---|---|---|---|---|---|
| I will have more confidence in applying my skills/knowledge | 48% | 45% | 50% | 38% | 45% |
| I will have a broader range of skills to apply in the workplace | 51% | 40% | 39% | 46% | 37% |
| I will be able to progress in my current job | 40% | 39% | 33% | 51% | 36% |
| I will have better knowledge of how to do my job | 53% | 40% | 46% | 47% | 36% |
| I will be able to find a job/a better job | 27% | 35% | 31% | 34% | 27% |
| I will be able to progress in my studies | 22% | 33% | 17% | 17% | 21% |
| Other | 1% | 0% | 3% | 6% | 9% |
Perceptions of end-point assessments of apprenticeships: value and flexibility
For figure 35, the wave 5 unweighted base is: All employers who have apprentices in their organisation, n=585; All types of providers n=539; Learners, n=533.
Over half (54%) of learners said that they value apprenticeship EPAs, comparable with wave 4 (56%) (see Figure 35). A similar proportion (50%) of the provider group said that they value these assessments, which was also comparable with wave 4 findings (54%). A slightly lower proportion (43%) of employers agreed that they value apprenticeship EPAs, which has fallen from 49% in wave 4 and is now comparable with wave 3.
Figure 35. Results for ‘We value end-point assessments of apprenticeships’ (Employers) - ‘I value end-point assessments of apprenticeships’ (All types of providers, Learners)
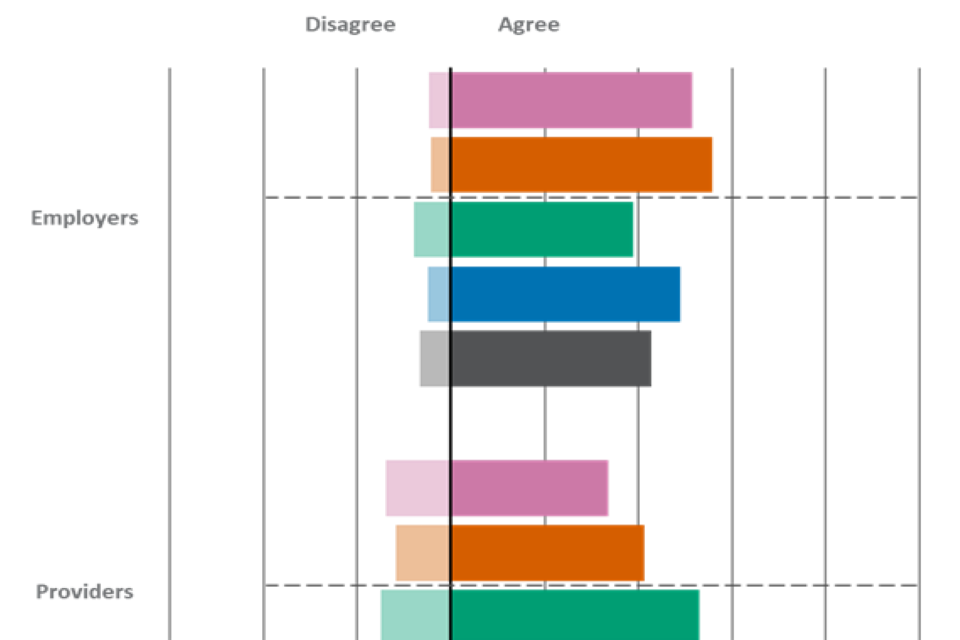
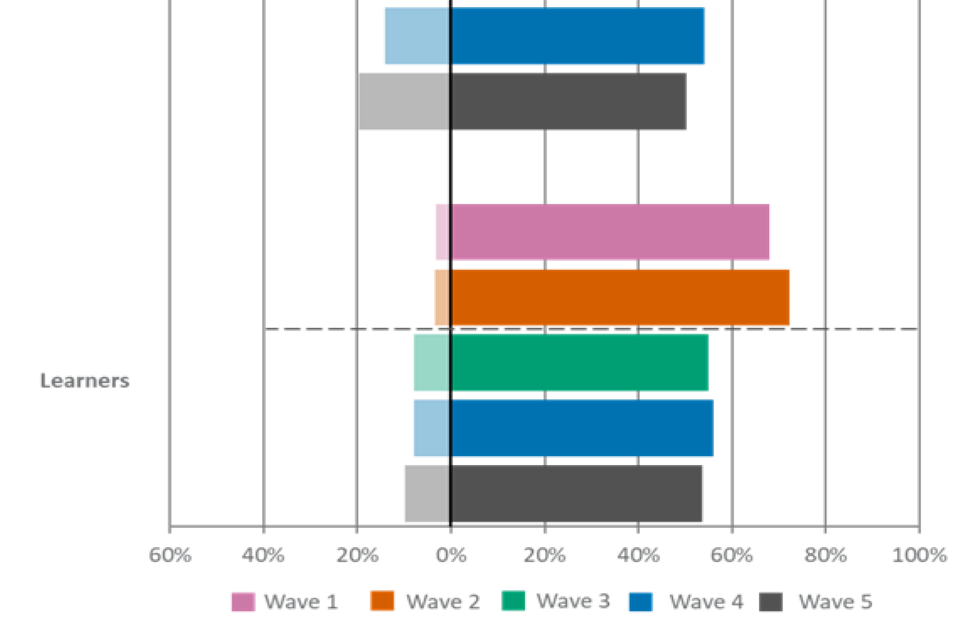
Please note that YouGov and Ofqual urge caution when drawing conclusions based on differences in the data in comparison with waves 1 and 2. This is due to key changes in the sampling approach and survey mode made for wave 3 onwards, which are outlined in more detail in the Introduction. The dotted line marks when the methodology changed.
Also note that there were also options provided in the survey for “Neither agree nor disagree” and “Don’t know”. Where the sum of the proportion who agreed and disagreed appears particularly low, this is due to the fact that large proportions of respondents fit within these other response categories.
| Group and agreement | Wave 1 | Wave 2 | Wave 3 | Wave 4 | Wave 5 |
|---|---|---|---|---|---|
| Employers – agree | 52% | 56% | 39% | 49% | 43% |
| Employers – disagree | 5% | 4% | 8% | 5% | 7% |
| Providers – agree | 34% | 41% | 53% | 54% | 50% |
| Providers – disagree | 14% | 12% | 15% | 14% | 20% |
| Learners – agree | 68% | 72% | 55% | 56% | 54% |
| Learners – disagree | 3% | 4% | 8% | 8% | 10% |
Employer reasons for perceptions of end-point assessments
Employers who said that they value EPAs (43%) were asked to explain why they think this through an open response question. Responses indicated that their value of EPAs tends to stem from the idea that EPAs are a good way of measuring or showing that the learner has reached the required standard, with a focus on training, and because it makes them more employable.
“They give an objective summary of the outcome of the ‘training’ and value of the candidate.”
“They are useful skills for people to get into employment within the chosen sector.”
“Good to have the quality of learners independently assessed and verified.”
“I know that the people taking them will have met a certain standard of ability and skill which, if meeting, means it will be suitable for the level of role we are employing them in.”
A very small (7%) proportion of employers said that they do not value EPAs. This group were asked to expand on their reasons through an open response question. For some, this was because they do not hire people with apprenticeships or that they are not relevant for the role or industry.
“We recruit only degree graduates.”
“Irrelevant to our line of work.”
For figure 36, the wave 5 unweighted base is: All types of providers n=539.
As shown in Figure 36, views for the provider group were split over whether or not apprenticeship EPAs offer value for money. Slightly under half (47%) agreed, whilst 19% disagreed; this is comparable to wave 4 (50% and 18%).
Figure 36. Results for ‘end-point assessments of apprenticeships offer value for money’ (All types of providers)
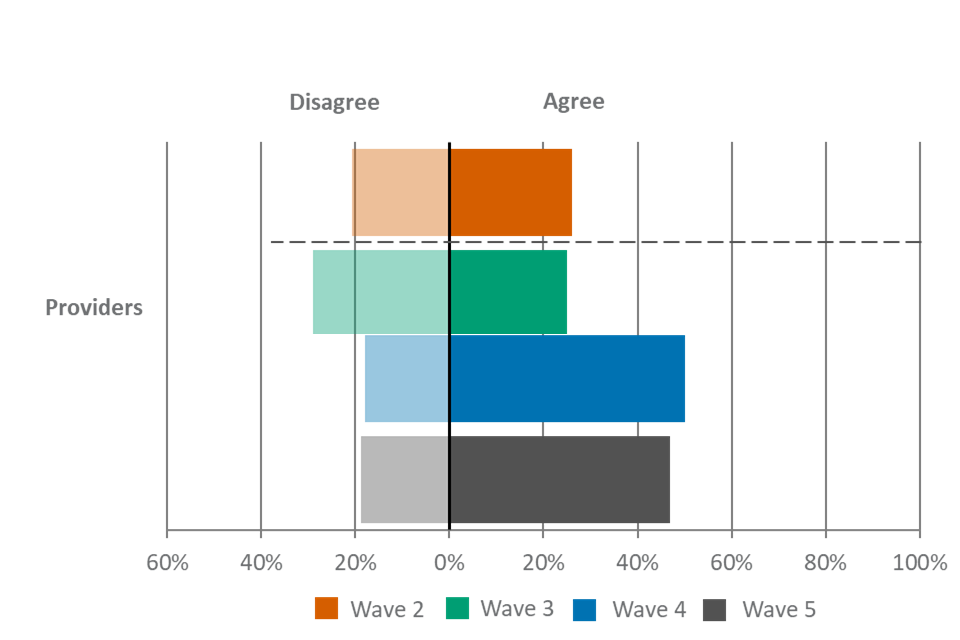
Please note that YouGov and Ofqual urge caution when drawing conclusions based on differences in the data in comparison with waves 1 and 2. This is due to key changes in the sampling approach and survey mode made for wave 3 onwards, which are outlined in more detail in the Introduction. The dotted line marks when the methodology changed.
Also note that there were also options provided in the survey for “Neither agree nor disagree” and “Don’t know”. Where the sum of the proportion who agreed and disagreed appears particularly low, this is due to the fact that large proportions of respondents fit within these other response categories.
| Group and agreement | Wave 2 | Wave 3 | Wave 4 | Wave 5 |
|---|---|---|---|---|
| Providers – agree | 26% | 25% | 50% | 47% |
| Providers – disagree | 21% | 29% | 18% | 19% |
For figure 37, the wave 5 unweighted base is: All employers who have at least a limited understanding of apprenticeship EPAs in their organisation, 585; All types of providers, 539; All learners 533.
As shown in Figure 37, two-fifths (40%) of learners agreed that the availability of EPAs is sufficiently flexible, compared to 37% of the provider group and 32% of employers. Among employers, the proportion agreeing that the availability of EPAs is sufficiently flexible is comparable to wave 4 (33%). Two in five (43%) ITPs agreed similar to FE or ACE or LA establishments (37%), however sixth forms are less likely to agree (23%).
Among the employer group, large employers (51%) were more likely than small (37%) and micro employers (29%) to report that the availability of EPAs is sufficiently flexible.
Figure 37. Results for ‘The availability of end-point assessments of apprenticeships is sufficiently flexible’ (Employers and All types of providers and Learners)
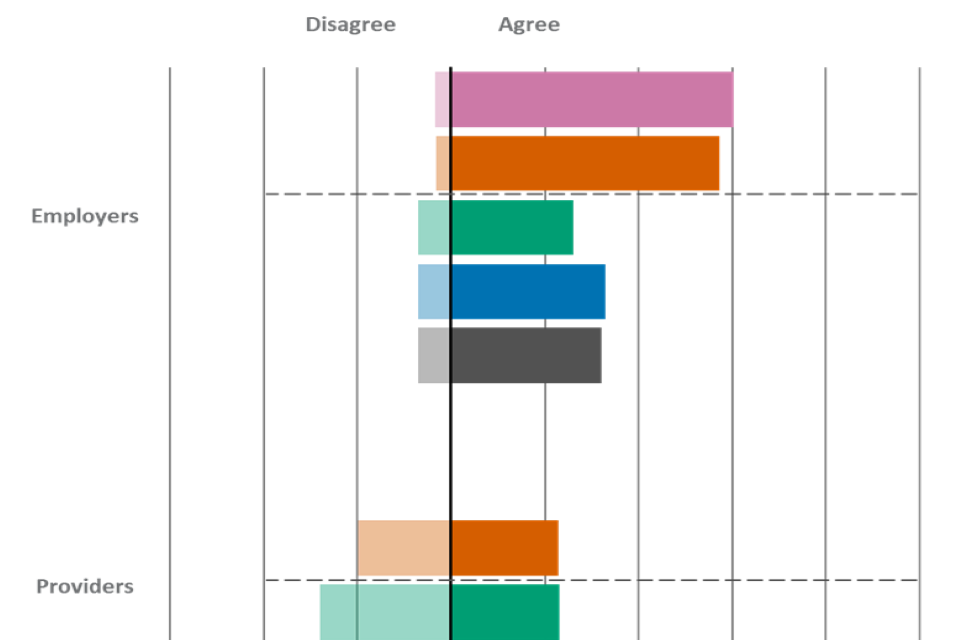
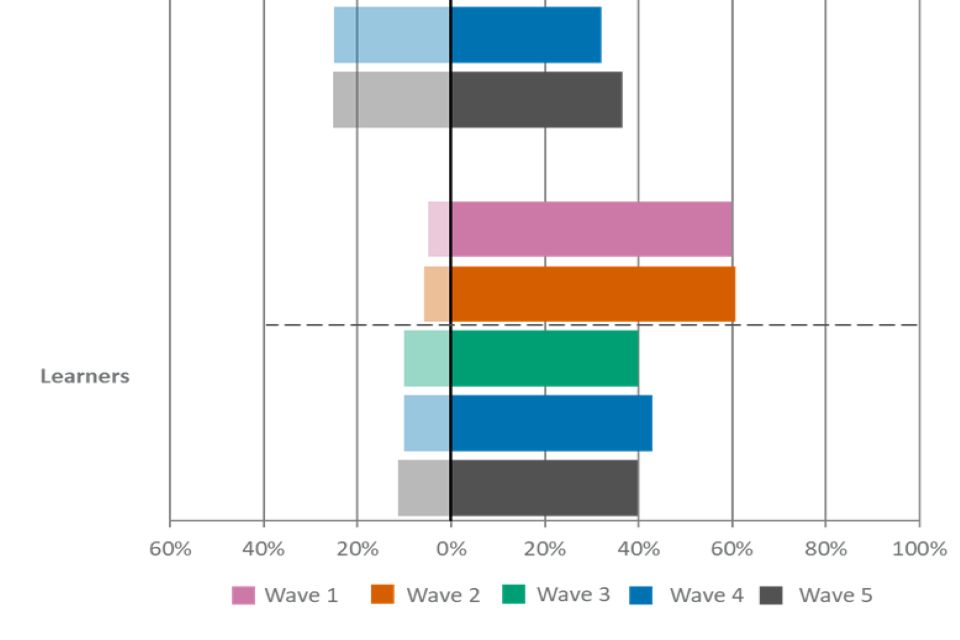
Please note that YouGov and Ofqual urge caution when drawing conclusions based on differences in the data in comparison with waves 1 and 2. This is due to key changes in the sampling approach and survey mode made for wave 3 onwards, which are outlined in more detail in the Introduction. The dotted line marks when the methodology changed.
Also note that there were also options provided in the survey for “Neither agree nor disagree” and “Don’t know”. Where the sum of the proportion who agreed and disagreed appears particularly low, this is due to the fact that large proportions of respondents fit within these other response categories.
| Group and agreement | Wave 1 | Wave 2 | Wave 3 | Wave 4 | Wave 5 |
|---|---|---|---|---|---|
| Employers – agree | 60% | 57% | 26% | 33% | 32% |
| Employers – disagree | 4% | 3% | 7% | 7% | 7% |
| Providers – agree | 23% | 23% | 32% | 37% | |
| Providers – disagree | 20% | 28% | 25% | 25% | |
| Learners – agree | 60% | 61% | 40% | 43% | 40% |
| Learners – disagree | 5% | 6% | 10% | 10% | 11% |
Perceptions of end-point assessments of apprenticeships: purpose and future opportunity
For figure 38, the wave 5 unweighted base is: All employers who have at least a limited understanding of apprenticeship EPAs in their organisation, n=585; All types of providers, n=539; All learners n=533.
Levels of agreement that people passing EPAs have the competence and vocational and technical skills needed by employers have remained broadly comparable with wave 4 findings.
Overall, as shown in Figure 38, 63% of the provider group agreed that people passing EPAs have the competence and vocational and technical skills needed by employers, broadly comparable with wave 4 (62%). A comparable proportion of learners agreed with this (56%, 59% in wave 4). Four in five (45%) employers agreed that people passing EPAs have the competence and vocational and technical skills needed by their organisation. This was also comparable with wave 4 findings (48%).
Figure 38. Results for ‘People completing end-point assessments of apprenticeships have the competence and vocational and technical skills needed by my organisation’ (Employers) ‘People passing end-point assessments of apprenticeship standards have the competence and vocational and technical skills needed by employers’ (All types of providers) ‘end-point assessments of apprenticeships test the competence and vocational and technical skills needed by employers’ (Learners)
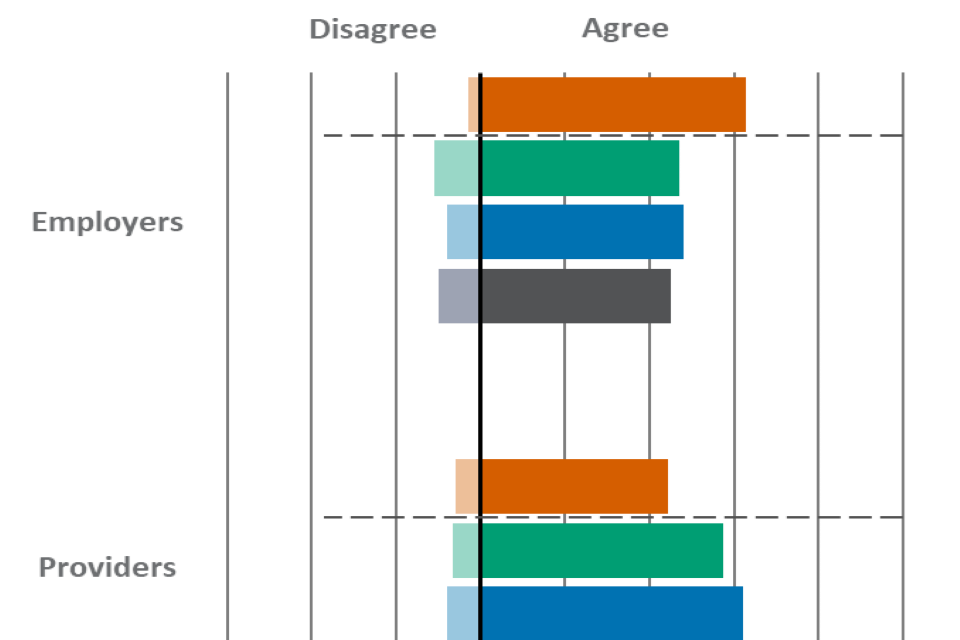
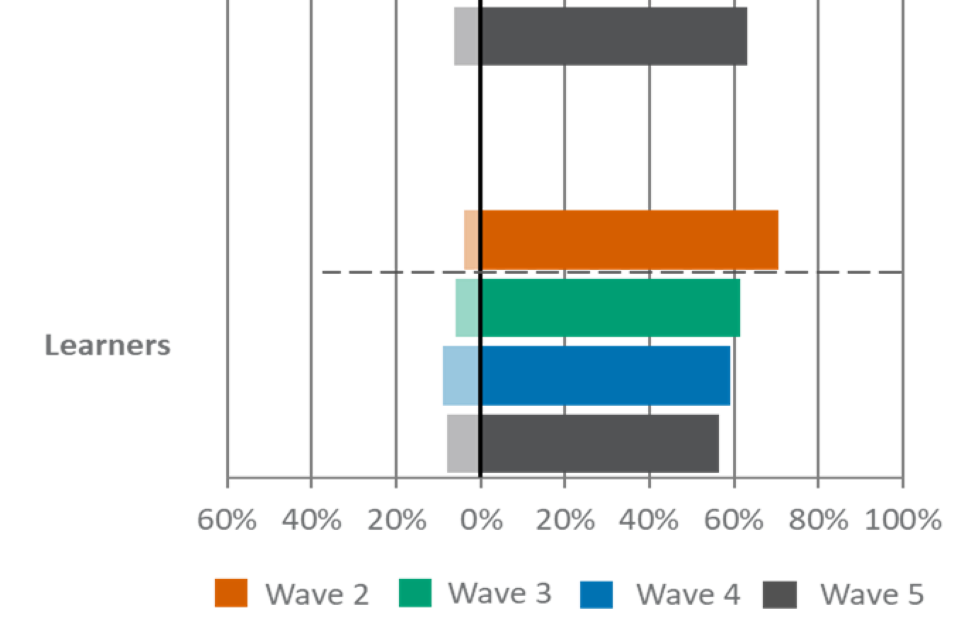
Please note that YouGov and Ofqual urge caution when drawing conclusions based on differences in the data in comparison with waves 1 and 2. This is due to key changes in the sampling approach and survey mode made for wave 3 onwards, which are outlined in more detail in the Introduction. The dotted line marks when the methodology changed.
Also note that there were also options provided in the survey for “Neither agree nor disagree” and “Don’t know”. Where the sum of the proportion who agreed and disagreed appears particularly low, this is due to the fact that large proportions of respondents fit within these other response categories.
| Group and agreement | Wave 2 | Wave 3 | Wave 4 | Wave 5 |
|---|---|---|---|---|
| Employers – agree | 63% | 47% | 48% | 45% |
| Employers – disagree | 3% | 11% | 8% | 10% |
| Providers – agree | 44% | 57% | 62% | 63% |
| Providers – disagree | 6% | 7% | 8% | 6% |
| Learners – agree | 70% | 61% | 59% | 56% |
| Learners – disagree | 4% | 6% | 9% | 8% |
For figure 39, the wave 5 unweighted base is: All types of providers 539; Learners, 533.
As shown in Figure 39, over half (56%) of learners said that they understand the purpose of EPAs of apprenticeships, comparable with wave 4 findings (59%). A comparable proportion (52%) of providers agreed that learners understand the purpose of end-point assessment of apprenticeship standards. This was also in line with wave 4 findings (55%).
Figure 39. Results for ‘Learners understand the purpose of end-point assessment of apprenticeship standards’ (All types of providers) - ‘I understand the purpose of end-point assessments of apprenticeships’ (Learners)
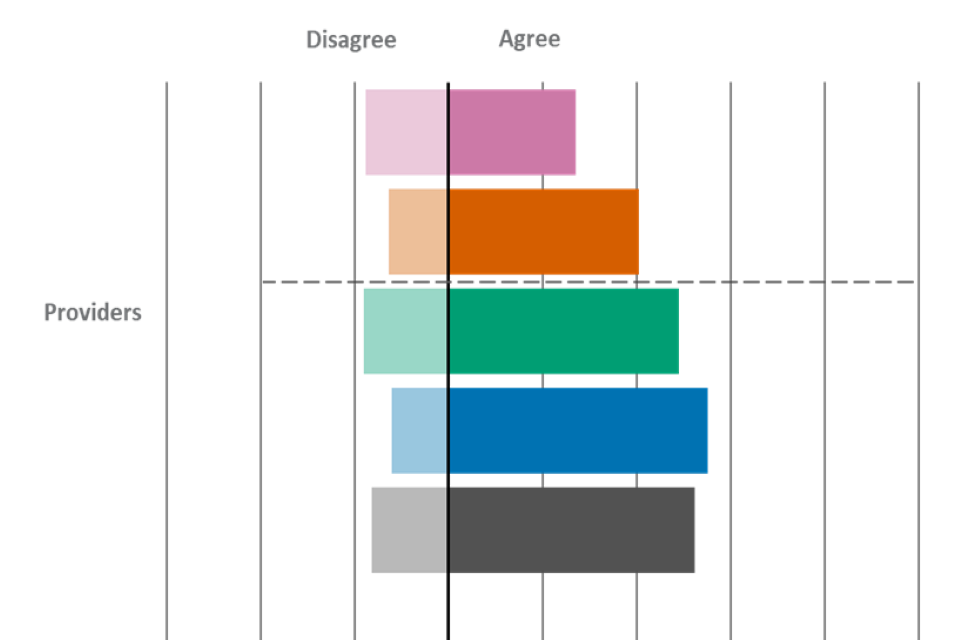
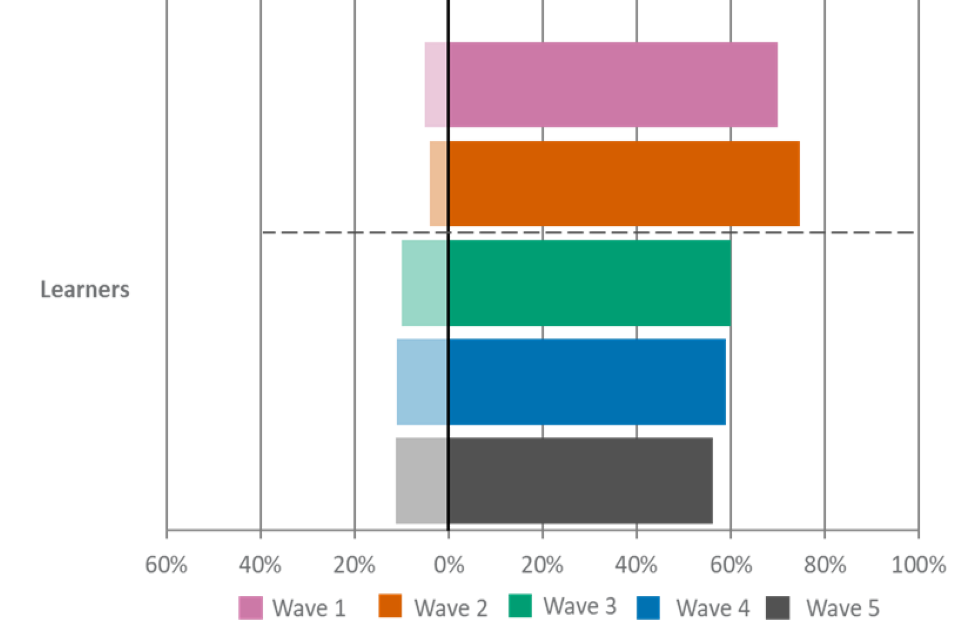
Please note that YouGov and Ofqual urge caution when drawing conclusions based on differences in the data in comparison with waves 1 and 2. This is due to key changes in the sampling approach and survey mode made for wave 3 onwards, which are outlined in more detail in the Introduction. The dotted line marks when the methodology changed.
Also note that there were also options provided in the survey for “Neither agree nor disagree” and “Don’t know”. Where the sum of the proportion who agreed and disagreed appears particularly low, this is due to the fact that large proportions of respondents fit within these other response categories.
| Group and agreement | Wave 1 | Wave 2 | Wave 3 | Wave 4 | Wave 5 |
|---|---|---|---|---|---|
| Providers – agree | 27% | 40% | 49% | 55% | 52% |
| Providers – disagree | 18% | 13% | 18% | 12% | 16% |
| Learners – agree | 70% | 75% | 60% | 59% | 56% |
| Learners – disagree | 5% | 4% | 10% | 11% | 11% |
Section 5: Perceptions of T Levels
All learners were shown a set of questions about T Levels, regardless of whether they studied them or not.
Key Findings – T Levels
-
The proportion of learners saying they had a good, or very good, understanding of T Levels has remained comparable with the previous wave (22% in wave 5, 25% in wave 4).
-
Awareness of T Levels among employers was 12% (comparable with 12% in wave 4 and 13% in wave 3).
-
For each of the statements about T Levels (e.g. understanding their purpose), there was relatively low agreement among learners. This tends to be due to a large proportion saying that they ‘don’t know’, as opposed to disagreement.
Understanding of T Levels
For figure 40, the wave 5 unweighted base is all learners, n=533.
The first wave of three T Levels was introduced in September 2020 for a selected number of providers and their learners. Therefore, this set of questions was introduced in wave 3.
Understanding of T Levels among learners is comparable to wave 4.
As shown in Figure 40, one in five (22%) learners reported having a very or quite good understanding of T Levels, while 36% reported that they have no understanding at all. In comparison to previous waves, learners have a similar level of understanding, with a comparable number of respondents saying they had a very good (5%) or good (18%) understanding of T Levels with the previous two waves.
Figure 40. ‘Which of the following statements describes your understanding of T Levels? (Learners)’

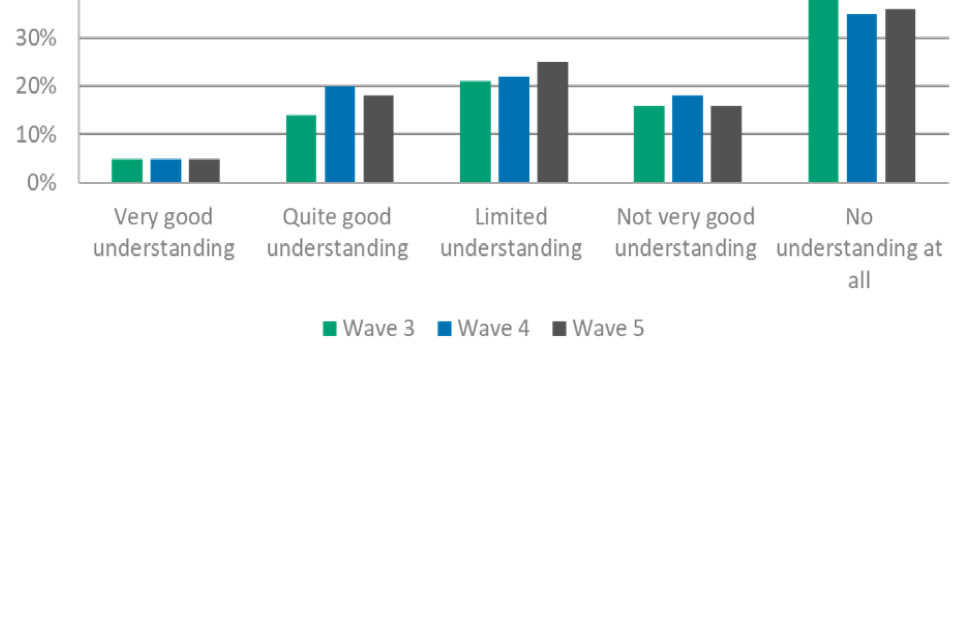
| Level of understanding | Wave 3 | Wave 4 | Wave 5 |
|---|---|---|---|
| Very good understanding | 5% | 5% | 5% |
| Quite good understanding | 14% | 20% | 18% |
| Limited understanding | 21% | 22% | 25% |
| Not very good understanding | 16% | 18% | 16% |
| No understanding at all | 43% | 35% | 36% |
For figure 41, the wave 5 unweighted base is all employers, n=2,002.
Employers have a generally lower level of understanding of T Levels, which has remained broadly consistent over time.
As shown in Figure 41, levels of understanding of T Levels remained low, with only 12% having a very or quite good understanding of this course. This was comparable with wave 3 (13%) and wave 4 findings (12%). A consistently high amount of employers report having no understanding at all of T Levels (41%), in line with previous waves.
Figure 41. Results for ‘Please indicate your level of understanding about T Levels? (Employers)’
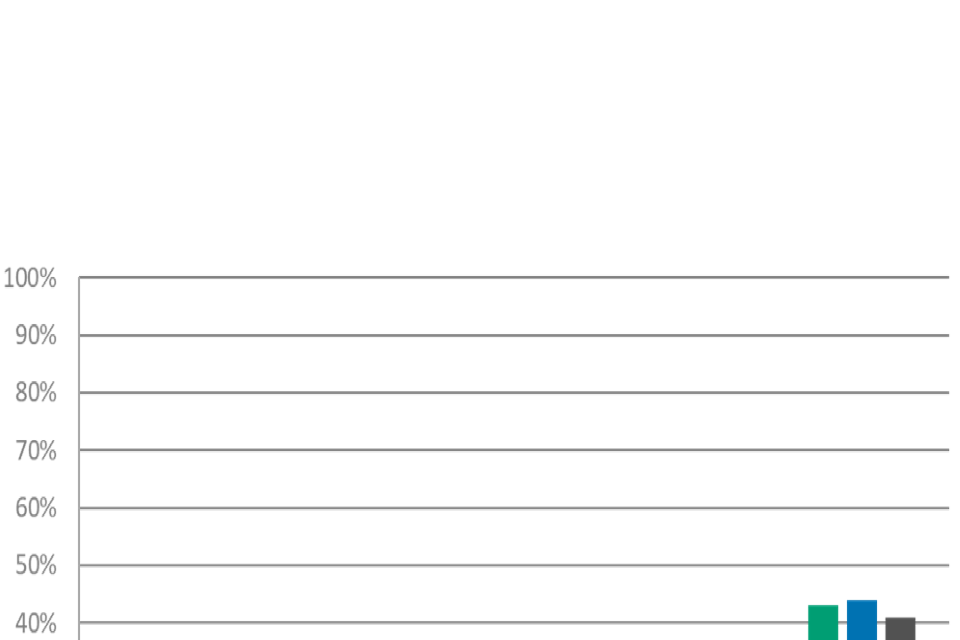
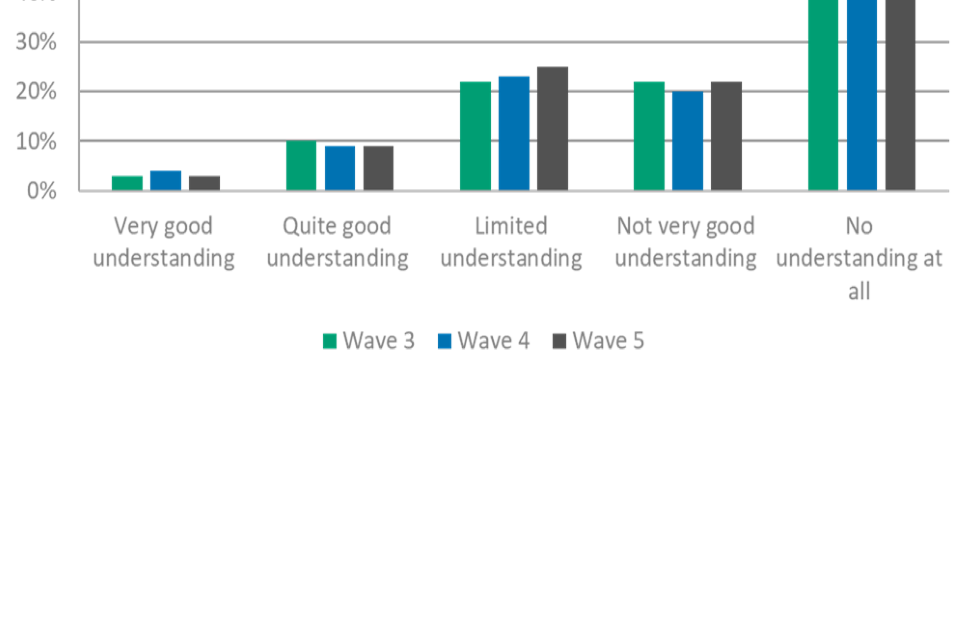
| Level of understanding | Wave 3 | Wave 4 | Wave 5 |
|---|---|---|---|
| Very good understanding | 3% | 4% | 3% |
| Quite good understanding | 10% | 9% | 9% |
| Limited understanding | 22% | 23% | 25% |
| Not very good understanding | 22% | 20% | 22% |
| No understanding at all | 43% | 44% | 41% |
Perceptions of T Levels
For figure 42, the wave 5 unweighted base is all learners, n=533.
Learners were asked 5 statements about T Levels and for each statement, there were relatively low levels of agreement (see Figure 42).
The largest disagreement level was for learners understanding the purpose of T Levels; a broadly similar proportion of learners agreed (23%) and disagreed (20%) with this statement.
Levels of agreement remains low for all statements due to a high proportion of respondents selecting the don’t know option. With all statements (except understanding T Levels purpose) having an average of four in ten saying they ‘don’t know’.
Learners were more likely to agree that T Levels test the competence and vocational and technical skills needed by employers (31%), compared to 8% who disagreed. This was the statement respondents were most likely to agree with, followed by T Levels being good preparation for work (29% agree, 8% disagree).
Overall, roughly a quarter (24%) of learners said they value T Levels, with 10% disagreeing and a further two in five (41%) say they don’t know.
A fifth (21%) of respondents said that the availability of T Levels is sufficiently flexible, compared to just under half of that figure disagreeing that T Levels are flexible enough (11%).
Figure 42. ‘To what extent do you agree or disagree with the following statements about T Levels?’
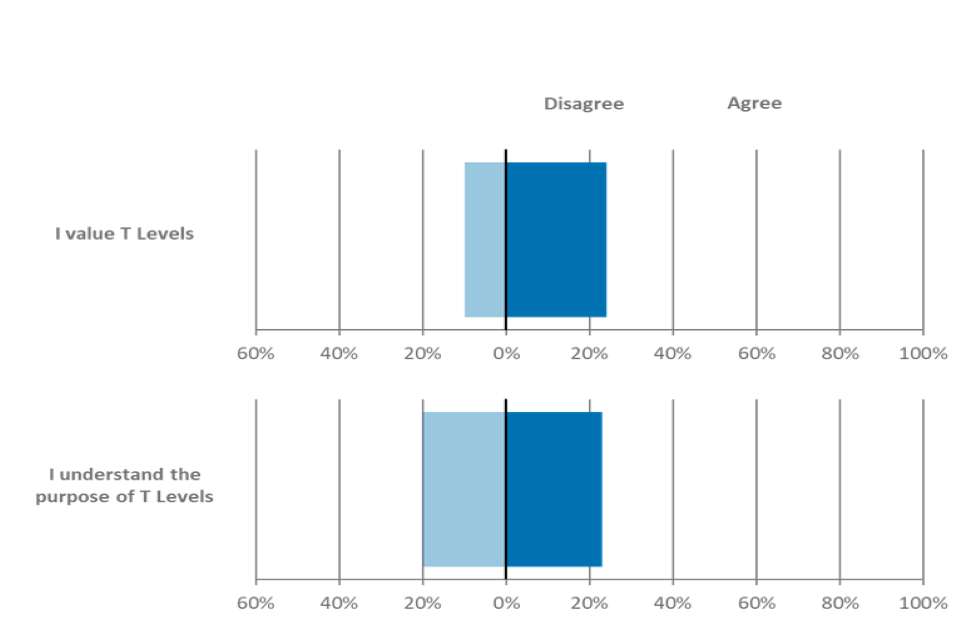
Note that the data shown in this chart is for wave 5 only.
There were also options provided in the survey for “Neither agree nor disagree” and “Don’t know”. Where the sum of the proportion who agreed and disagreed appears particularly low, this is due to the fact that large proportions of respondents fit within these other response categories.
| I value T Levels | Percent |
|---|---|
| Agree | 24% |
| Disagree | 10% |
| I understand the purpose of T Levels | Percent |
|---|---|
| Agree | 23% |
| Disagree | 20% |
| T Levels test the competence and vocational and technical skills needed by employers | Percent |
|---|---|
| Agree | 31% |
| Disagree | 8% |
| The availability of T Levels is sufficiently flexible | Percent |
|---|---|
| Agree | 20% |
| Disagree | 11% |
| T Levels are good preparation for work | Percent |
|---|---|
| Agree | 29% |
| Disagree | 8% |
Section 6: Clarity regarding industry pertinent qualifications
Key Findings – Clarity regarding relevant qualifications
-
Five in ten (50%) employers said it is clear which qualifications are relevant to their organisation, and this was significantly higher among large employers (63%). This is comparable with previous waves.
-
Just over six in ten (63%) learners reported that it is clear to them which qualifications are relevant to their needs. This was a decrease from the previous wave (70%).
For figure 43, the wave 5 unweighted base is: All employers, n=2,002.
As shown in Figure 43, half of all employers surveyed (50%) reported that it is clear which qualifications are relevant to their organisation, while one in five (20%) said that it is not. This is consistent with previous waves.
Figure 43. Results for ‘It is clear which qualifications are relevant to my organisation’ (Employers)
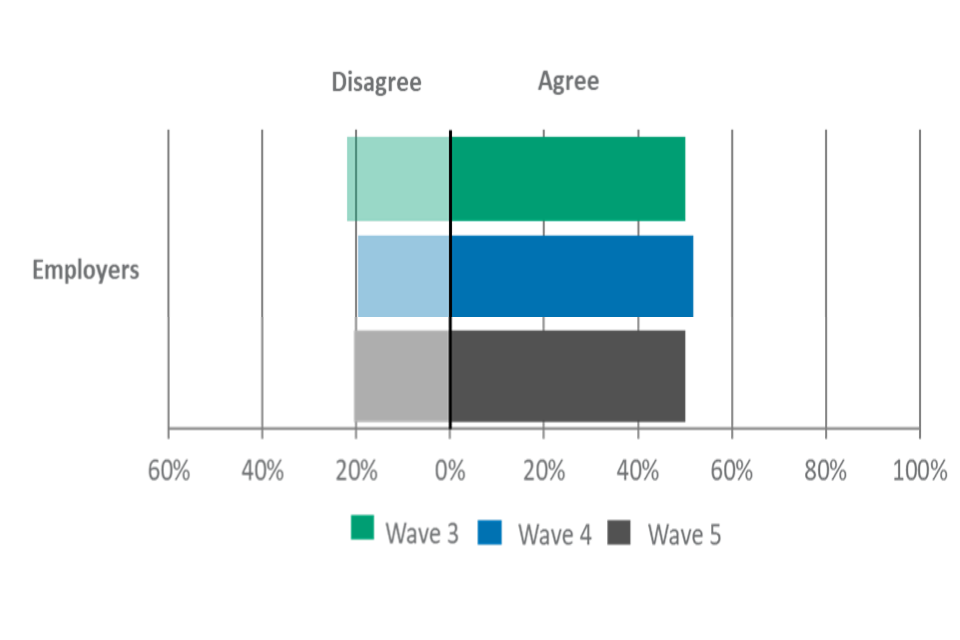
Note: There were also options provided in the survey for “Neither agree nor disagree” and “Don’t know”. Where the sum of the proportion who agreed and disagreed appears particularly low, this is due to the fact that large proportions of respondents fit within these other response categories.
| Group and agreement | Wave 3 | Wave 4 | Wave 5 |
|---|---|---|---|
| Employers – agree | 50% | 52% | 50% |
| Employers – disagree | 22% | 20% | 20% |
For figure 44, the wave 5 unweighted base is: All learners, 533.
Significantly fewer learners in this wave (63%) agreed that it is clear to them which qualifications are relevant to their needs compared to wave 4 (70%) (see Figure 44). While a similar proportion (11%) disagreed, compared with 9% in wave 4.
Figure 44. Results for ‘It is clear which qualifications are relevant to my needs’ (Learners)
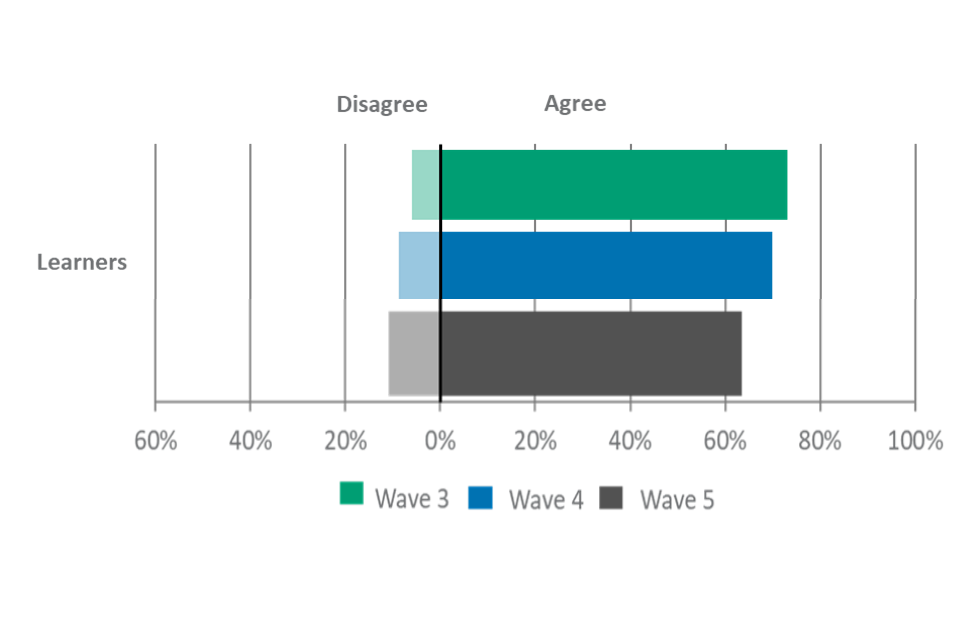
Note: There were also options provided in the survey for “Neither agree nor disagree” and “Don’t know”. Where the sum of the proportion who agreed and disagreed appears particularly low, this is due to the fact that large proportions of respondents fit within these other response categories.
| Group and agreement | Wave 3 | Wave 4 | Wave 5 |
|---|---|---|---|
| Learners – agree | 73% | 70% | 63% |
| Learners – disagree | 6% | 9% | 11% |
Section 7: Use of qualifications for recruitment and training
Key Findings – Use of qualifications for recruitment and training
-
For people in entry level and admin roles, a third (33%) of employers report that a Maths and English GCSE is essential. For professional and managerial roles, the qualification which most employers find to be essential is a degree (33%), and for skilled and supervisory roles it is relevant work experience (35%).
-
For people in entry level and admin roles, a quarter (25%) of employers reported that all or most training leads to a qualification compared with 33% of employers who reported this for skilled and supervisory roles and 30% who reported this for professional and managerial roles.
-
Among employers who said they had arranged or funded training for employees in the last months, around a third (34%) said that it led to a vocational or technical qualification.
-
Relevance of the qualification to their organisation remains the most important factor to employers (63%), when considering which qualifications to offer to employees. Just over a third (36%) of employers mentioned that the qualification being valued in their sector was a factor taken into consideration.
-
Employers who said that they had not arranged or funded training that had resulted in a vocational qualification, an apprenticeship or a technical qualification were asked why that was. The most common reason for this was not employing apprentices in their organisation (37%) or having no need for them (32%).
Qualifications deemed essential at different occupational levels
For figure 45, the unweighted base for wave 5 is: All employers, n=2,002.
As shown in Figure 45, relevant work experience was seen as essential to roughly a third of employers when recruiting to skilled and supervisory roles (35%) and to professional and managerial roles (32%). This is consistent with the previous wave 4 data, which reported the same figures. For professional and managerial roles, a third (33%) reported that it was essential that new employees had a degree, or equivalent level 6 qualification; this is significantly higher than for skilled and supervisory roles (18%) and entry level and admin roles (8%).
When recruiting to entry level and admin roles it was more common for employers to report that it was essential that new employees had Maths and English Functional Skills (27%), statistically significantly higher than for skilled and supervisory roles (19%) and professional and managerial roles (16%). Employers selected that the most essential qualification for entry level and admin roles, out of those listed, was Maths and English GCSEs (33%), higher than both skilled and supervisory roles and professional and managerial roles (both 28%).
Figure 45. Results for ‘When recruiting new employees, are any of the following essential for the following types of roles’ (Employers)
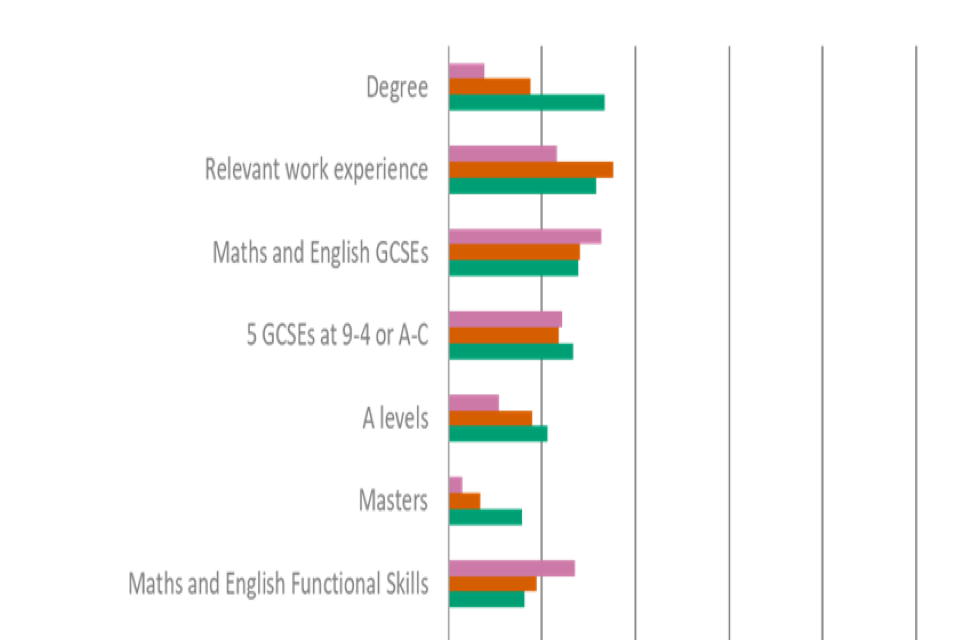
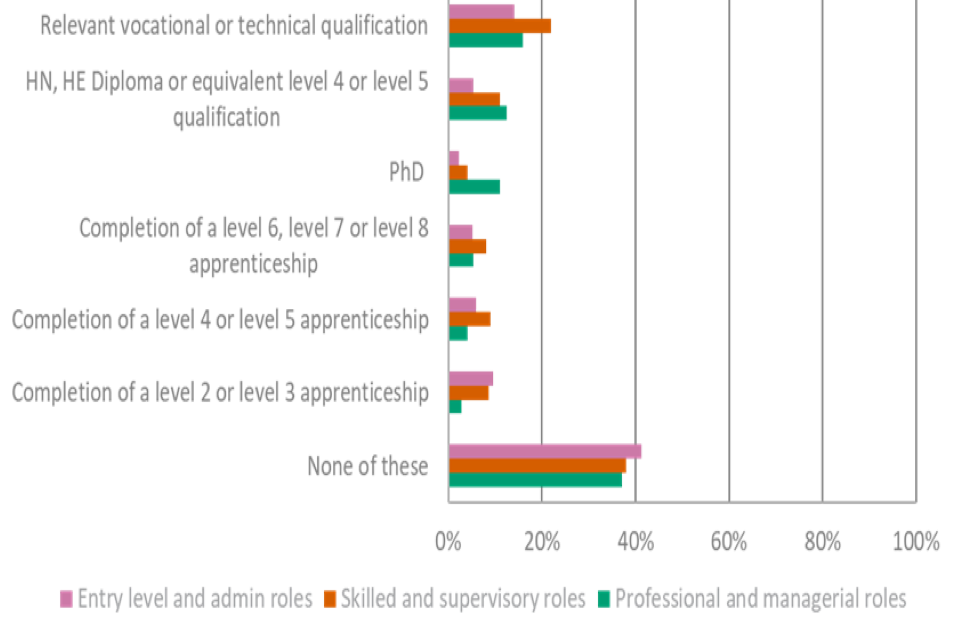
Note that the data shown in this chart is for wave 5 only.
| Qualification | Professional and managerial roles | Skilled and supervisory roles | Entry level and admin roles |
|---|---|---|---|
| PhD | 11% | 4% | 2% |
| Masters | 16% | 7% | 3% |
| Completion of a level 6, level 7 or level 8 apprenticeship | 5% | 8% | 5% |
| HN, HE Diploma or equivalent level 4 or level 5 qualification | 12% | 11% | 5% |
| Completion of a level 4 or level 5 apprenticeship | 4% | 9% | 6% |
| Degree | 33% | 18% | 8% |
| Completion of a level 2 or level 3 apprenticeship | 3% | 9% | 10% |
| A levels | 21% | 18% | 11% |
| Relevant vocational or technical qualification | 16% | 22% | 14% |
| Relevant work experience | 32% | 35% | 23% |
| 5 GCSEs at 9-4 or A-C | 27% | 24% | 24% |
| Maths and English Functional Skills | 16% | 19% | 27% |
| Maths and English GCSEs | 28% | 28% | 33% |
| None of these | 37% | 38% | 41% |
For figures 46 and 47, the wave 5 unweighted base is: Employers who have arranged or funded training for their employees, n=823.
For the differing levels of job roles, a similar proportion of employers reported that all or most training leads to a qualification. For people in entry level and admin roles, a quarter (25%) of employers reported that all or most training leads to a qualification compared with 33% of employers who reported this for skilled and supervisory roles and 30% who reported this for professional and managerial roles (see Figure 46).
Micro and small employers were more likely than large employers to report that no training leads to qualifications for employees across all different roles. For professional and managerial roles, 34% of micro employers and 21% of small employers reported that no training they arranged or funded leads to a qualification compared to just 11% of large employers.
Figure 46. Results for ‘Thinking about the training your company has arranged or funded in the last 12 months, how much of it, if any, typically results in a qualification’
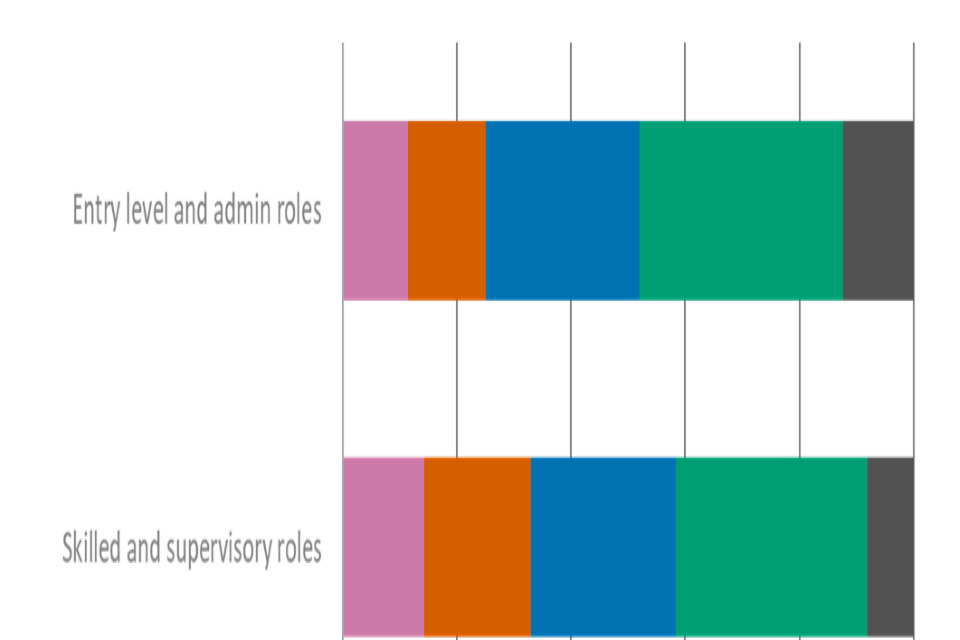
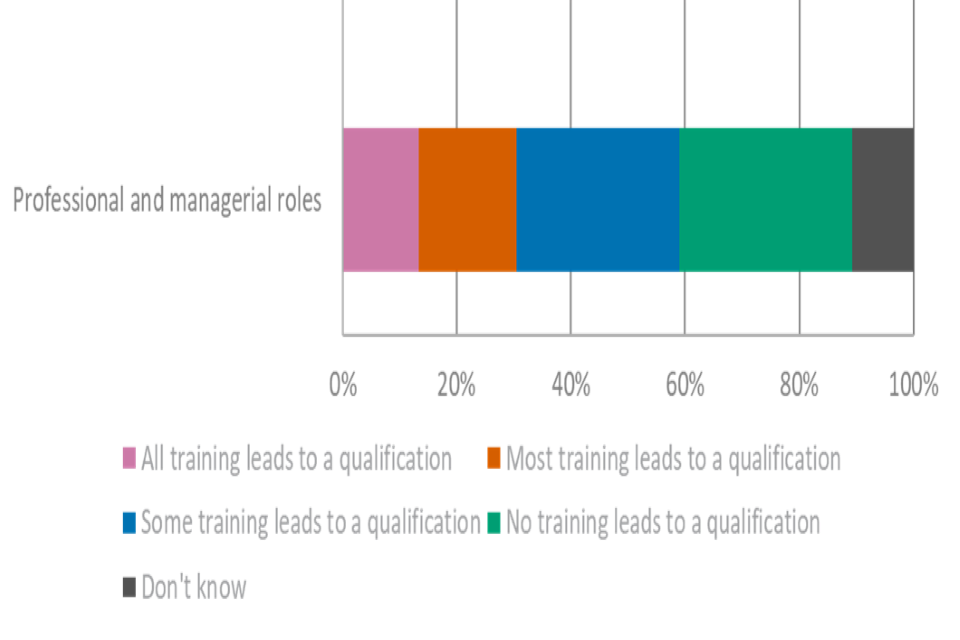
Note that the data shown in this chart is for wave 5 only.
| Statement | Professional and managerial roles | Skilled and supervisory roles | Entry level and admin roles |
|---|---|---|---|
| All training leads to a qualification | 13% | 14% | 12% |
| Most training leads to a qualification | 17% | 19% | 14% |
| Some training leads to a qualification | 29% | 25% | 27% |
| No training leads to a qualification | 30% | 34% | 36% |
| Don’t know | 11% | 8% | 12% |
As shown in Figure 47, around a third (34%) of employers who arranged or funded training for employees in the past 12 months, said that training led to a vocational or technical qualification. In large employers this increased to 42%.
However, a sizable proportion of employers did not the outcome of the training, with 37% saying they did not know if the training led to any of the qualifications listed.
Figure 47. Results for ‘Has any of the training your organisation has arranged or funded in the last 12 months led to any of the following?’ (Employers who have arranged or funded training for employees in last 12 months)
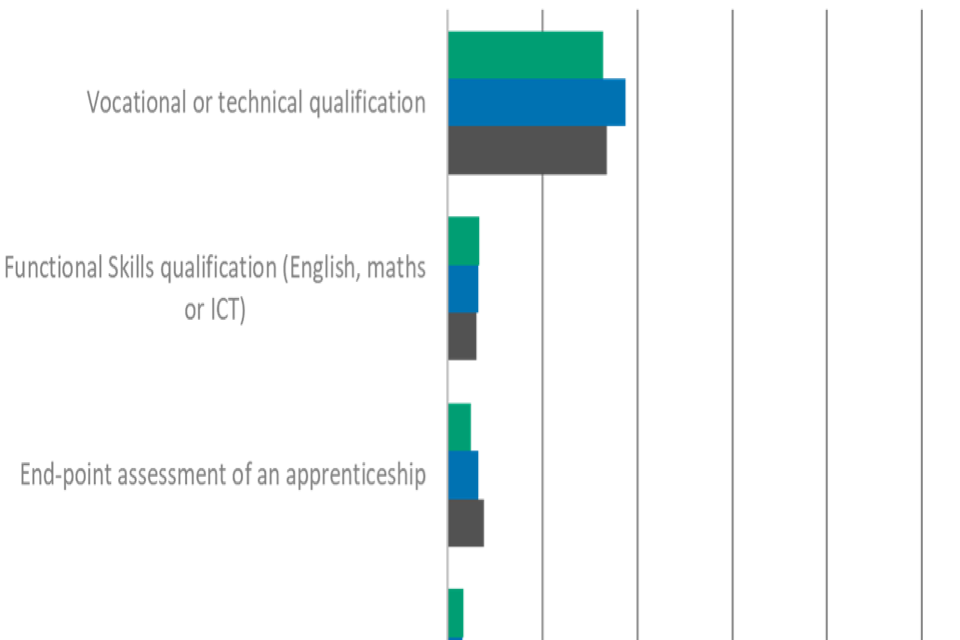
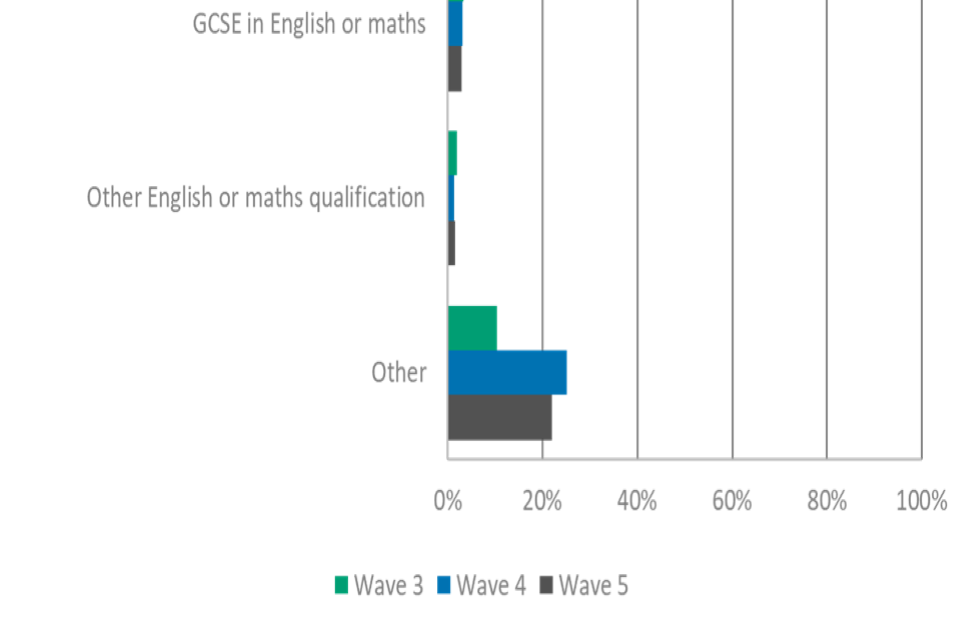
| Qualification | Wave 3 | Wave 4 | Wave 5 |
|---|---|---|---|
| Vocational or technical qualification | 33% | 38% | 34% |
| Functional Skills qualification (English, maths or ICT) | 7% | 6% | 6% |
| End-point assessment of an apprenticeship | 5% | 6% | 8% |
| GCSE in English or maths | 3% | 3% | 3% |
| Other English or maths qualification | 2% | 1% | 2% |
| Other | 10% | 25% | 22% |
For figure 48, the wave 5 unweighted base is: Employers who have arranged or funded training for their employees, n=823.
As shown in Figure 48, employers reported that the most common factor taken into account when they decide which qualification to offer their employees is the relevance of the qualification to their organisation (63%), this is broadly comparable to the previous waves.
Just over a third (36%) of employers mentioned that the qualification being valued in their sector was a factor taken into consideration. One in ten (10%) employers, said that none of those factors are taken into account before their organisation decides which qualifications to offer.
Figure 48. Results for ‘Can you please indicate which of the following factors are taken into account when your organisation decides which qualifications to offer its employees?’ (Employers who have arranged or funded training for employees in last 12 months)
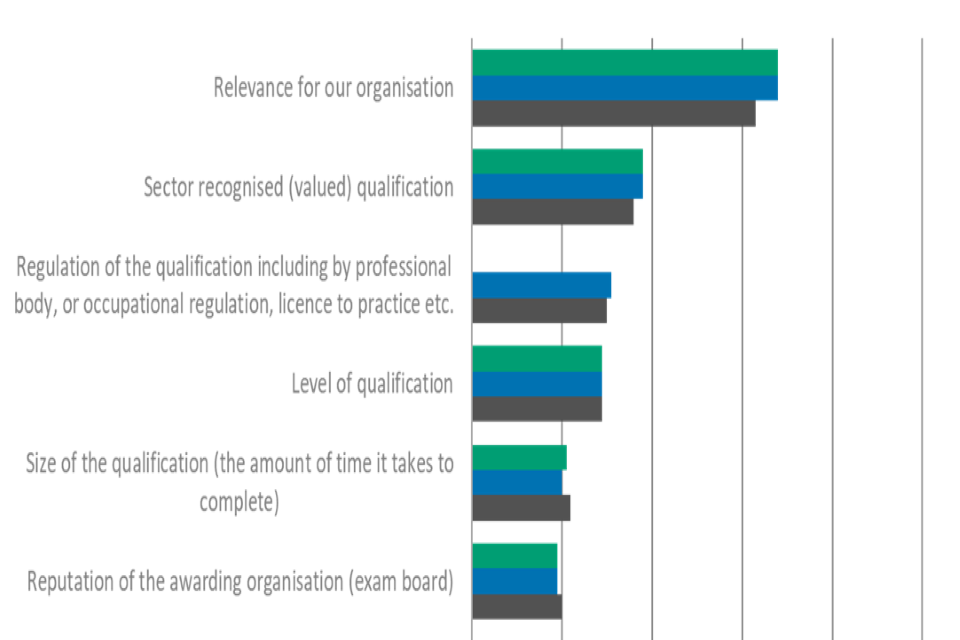
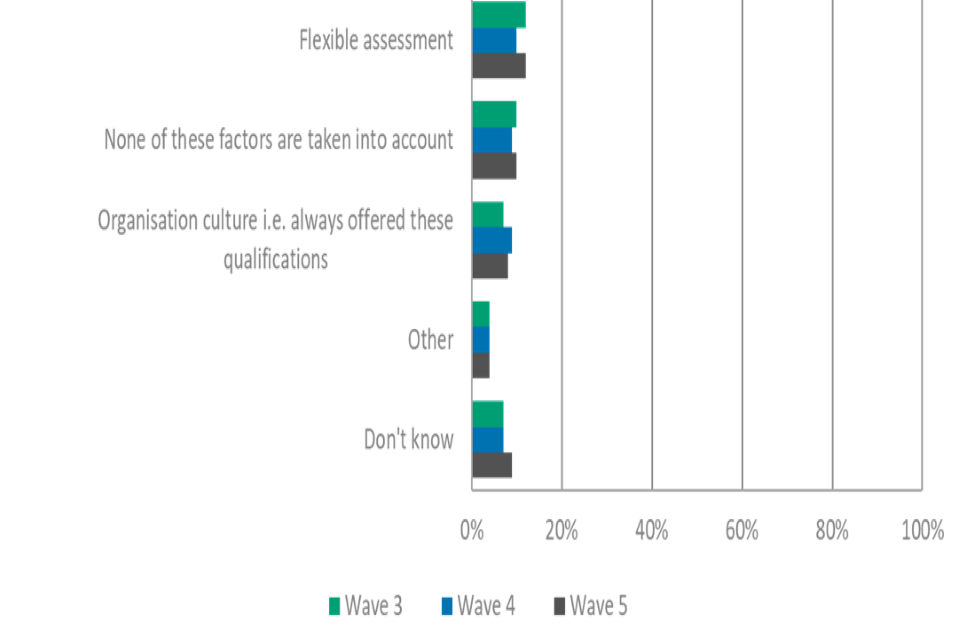
| Statement | Wave 3 | Wave 4 | Wave 5 |
|---|---|---|---|
| Relevance for our organisation | 68% | 68% | 63% |
| Sector recognised (valued) qualification | 38% | 38% | 36% |
| Level of qualification | 29% | 29% | 29% |
| Size of the qualification (the amount of time it takes to complete) | 21% | 20% | 22% |
| Reputation of the awarding organisation (exam board) | 19% | 19% | 20% |
| Flexible assessment | 12% | 10% | 12% |
| Organisation culture i.e. always offered these qualifications | 7% | 9% | 8% |
| Regulation of the qualification including by professional body, or occupational regulation, licence to practice etc. | 0% | 31% | 30% |
| Other | 4% | 4% | 4% |
| Don’t know | 7% | 7% | 9% |
| None of these factors are taken into account | 10% | 9% | 10% |
For figure 49, the wave 5 unweighted base is: Employers who arranged or funded training that didn’t lead to a vocational or technical qualification or EPA of an apprenticeship, n=766.
Employers who said that they had not arranged or funded training that had resulted in a vocational qualification, an apprenticeship or a technical qualification were asked why that was. Most commonly employers reported that they do not have any apprentices in their organisation (37%). The second most reported reason was no need for them (32%) (see Figure 49). Nearly one in ten (9%) employers mentioned that they were too time consuming.
Of those employers who said they had no need to arrange or fund training that led to a qualification, (61%) reported this was simply because their employees do not need VTQs or apprenticeships.
Figure 49. Results for ‘Can you please say why your organisation hasn’t arranged or funded training that led to a vocational or technical qualification and/or apprenticeship?’ (Employers who have arranged or funded training for employees in last 12 months which has not led to Vocational/technical qualification or end-point assessment of an apprenticeship)
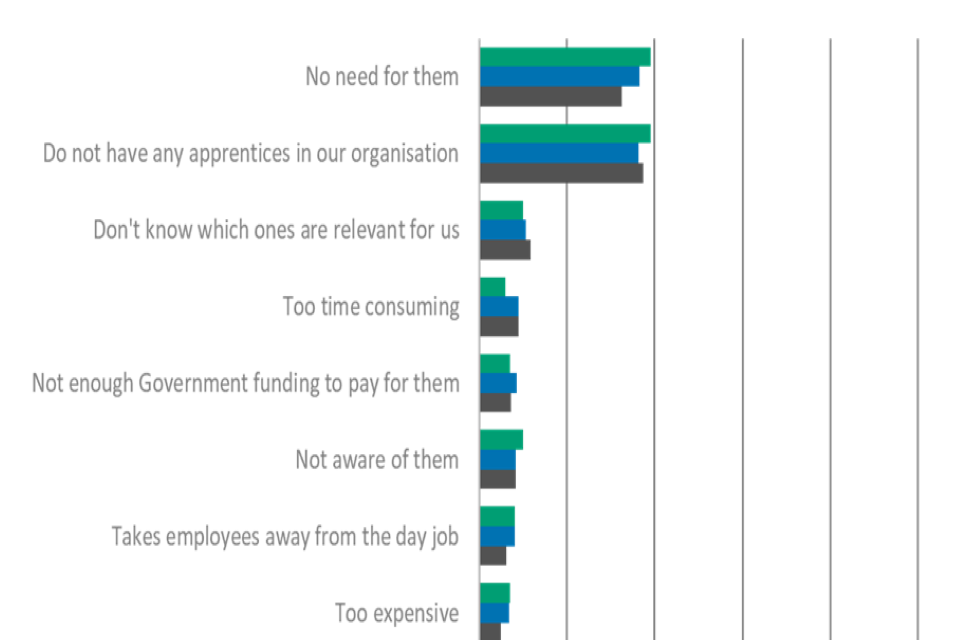
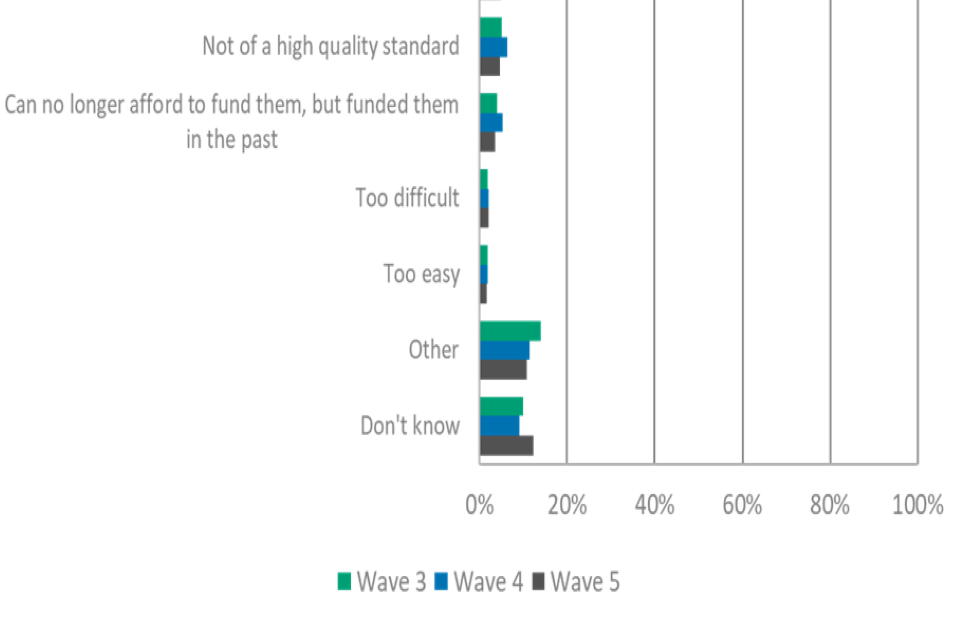
| Statement | Wave 3 | Wave 4 | Wave 5 |
|---|---|---|---|
| Too easy | 2% | 2% | 2% |
| Too difficult | 2% | 2% | 2% |
| Can no longer afford to fund them, but funded them in the past | 4% | 5% | 4% |
| Not of a high quality standard | 5% | 6% | 5% |
| Too time consuming | 6% | 9% | 9% |
| Too expensive | 7% | 7% | 5% |
| Not enough Government funding to pay for them | 7% | 9% | 7% |
| Takes employees away from the day job | 8% | 8% | 6% |
| Not aware of them | 10% | 8% | 8% |
| Don’t know which ones are relevant for us | 10% | 11% | 12% |
| Do not have any apprentices in our organisation | 39% | 36% | 37% |
| No need for them | 39% | 36% | 32% |
| Other | 14% | 12% | 11% |
| Don’t know | 10% | 9% | 12% |
Glossary of terms
Adult Community Education (ACE)
Adult Community Education includes a range of community based and outreach learning opportunities, primarily managed and delivered by local authorities and general further education colleges.
All provider types
The scope of the survey sample included providers of all types such as in the following categories: Further Education (FE); Higher Education (HE); private class-based; private work-based; public sector community based; public sector ‘other’; schools; voluntary sector education; Independent Training Provider (ITP). ITPs are distinct from other types of Further Education providers as they are ‘independent’ and not run or directly controlled by the state. In the report the category ‘All provider types’, may be referred to as the provider group or all types of providers or all providers.
Apprenticeship frameworks
These were developed by sector bodies, primarily focused on qualifications. They were phased out in 2020 and 2021 and replaced by apprenticeship standards. Framework apprenticeships are assessed throughout by completing a unit at a time but there is no endpoint assessment.
Apprenticeship standards
New apprenticeship standards, developed by employers, to show what an apprentice will be doing, and the skills required of them, by job role. Standards are developed by employer groups known as ‘trailblazers’. Standards are occupation-focused rather than qualification-led, with the apprentice being assessed through an end-point assessment. The Institute for Apprenticeships and Technical Education (‘the Institute’), supports employer groups in the development of apprenticeship standards. The Institute is an employer-led organisation focussed on enabling people of all ages and backgrounds have the opportunity to maximise their potential and contribute to improving social mobility and the UK’s productivity.
Awarding organisation (AO)
An organisation recognised by the qualifications’ regulators in England, Wales or Northern Ireland to develop, deliver and award qualifications. In England, this includes organisations that are regulated by Ofqual as End Point Assessment Organisations (EPAOs).
Organisation size
Throughout the report organisations are categorised by number of employees into micro (2 to 9 employees), small (10 to 49 employees), medium (50 to 249 employees) and large (250+ employees) organisations.
End-point assessment of apprenticeship (EPA)
End-point assessment (EPA) is an independent assessment that takes place at the end of the apprenticeship training. This is to test that the apprentice is competent in their occupation.
Functional Skills qualifications (FSQ)
Functional Skills qualifications are available in English, maths and ICT and are available in levels from Entry 1 to Level 2. Functional Skills assessments test the fundamental, applied skills in these subjects for life, learning and work.
It should be noted that reformed Functional Skills qualifications were introduced for first teaching in September 2019. Legacy qualifications are no longer available.
Further Education (FE)
Further education (FE) includes any study after secondary education that’s not part of higher education (that is, not taken as part of an undergraduate or graduate degree).
Learners
In the context of this report, “learners” refers to students and apprentices of all ages.
Local Authorities (LAs)
Local Authorities (LAs) are responsible for a range of vital services for people and businesses in defined areas, including social care, schools and adult education.
Vocational and technical qualifications (VTQ)
These normally have a vocational focus and include, amongst others, Technical Qualifications and National Vocational Qualifications (NVQs). For this report, this term refers to qualifications other than FSQs, EPAs and T Levels.
T Levels
T Levels are new programmes of study which follow GCSEs and are broadly equivalent in size to 3 A levels. These 2-year courses, the first of which launched for first teaching from September 2020, have been developed in collaboration with employers and businesses so that the content meets the needs of industry and prepares students for entry into skilled employment, an apprenticeship or related technical study through further or higher education. T Levels offer students a mixture of classroom learning through a compulsory Technical Qualification, and ‘on-the-job’ experience during an industry placement of at least 315 hours (approximately 45 days). Ofqual is responsible for regulating the Technical Qualification within each T Level.
Training providers
The scope of the survey sample included providers in the following categories: Further Education (FE); Higher Education (HE); private class-based; private work-based; public sector community based; public sector ‘other’; schools; voluntary sector education.