Perceptions Survey Wave 20 - Report
Published 28 April 2022
Applies to England

© Crown copyright 2022
This publication is licensed under the terms of the Open Government Licence v3.0 except where otherwise stated. To view this licence, visit nationalarchives.gov.uk/doc/open-government-licence/version/3 or write to the Information Policy Team, The National Archives, Kew, London TW9 4DU, or email: psi@nationalarchives.gov.uk.
Where we have identified any third party copyright information you will need to obtain permission from the copyright holders concerned.
This publication is available at https://www.gov.uk/government/statistics/perceptions-of-a-levels-gcses-and-other-qualifications-wave-20/perceptions-survey-wave-20-report
Executive summary
Introduction
This report presents the findings of wave 20 of the Perceptions of General Qualifications Survey and should be read alongside the background information document.
The project was commissioned by Ofqual and conducted by YouGov. The aim of this project was to investigate students’, parents’, teachers’, head teachers’ (for the purposes of this report, the head teachers sample refers to school and college leaders ie deputy and assistant head teachers, and head teachers), Higher Education Institutions’ (HEIs), employers’, and the general public’s perceptions of, and levels of confidence in, qualifications and the examination system in England.
The survey followed the approach used since wave 13 in early 2015 and was conducted using an online method. The fieldwork for this wave was conducted between 11th November and 17th December 2021.
The final achieved samples were structured to be representative of the relevant target populations. However, while the sampling approach aimed to identify groups of participants who were representative, given that a survey of this kind only captures the views of those involved, throughout this report responses attributed to groups (for example, teachers, parents) reflect only those respondents included in the study. Further information on sampling and methodology is available in the accompanying background information document.
Throughout the report, all references to differences in findings between waves refer to statistically significant differences, and all significant differences wave on wave have been highlighted in the commentary accompanying the charts. Any other apparent differences in the data are within the margin of error and so cannot be viewed as a change from the previous wave(s). For further information on the significance testing applied, please refer to the background information document. Where an apparent shift in trends over time between the waves included in this report has not been discussed in the commentary, this is due to there not being a statistically significant difference.
The circumstances in 2021
The questions used in the annual Perceptions of General Qualifications Survey are reviewed every year, with a view to both carry on collecting long-term trends by retaining previous questions where possible, and also to introduce new questions where required to reflect circumstances relevant to a particular year. The standard questions are worded to elicit general perceptions (for example, to what extent respondents agree that ‘GCSEs are well understood by people’). On this basis, for wave 20, a large number of questions were retained in order to collect comparable time series data as usual on general perceptions. It was acknowledged, however, that these questions may not adequately capture perceptions in relation to the specifics of 2021, or even that respondents might be confused whether to respond generally or specifically in reference to 2021. Therefore, to capture the extraordinary nature of the events and arrangements put in place in 2021 as a response to the pandemic, a separate set of questions specific to 2021 was introduced, which mirrored some of the general questions (for example, to what extent respondents agree that ’GCSEs in 2021 were well understood by people’). Therefore, the survey questions were split into two sections this year: a general section and a 2021-specific section. This was done to allow us to understand the perceptions specific to 2021 and compare them to general perceptions irrespective of the approach taken in 2021 to deal with the exceptional circumstances. The approach of splitting the survey into these two sections was also taken with the previous wave for 2020-specific perceptions.
The summer 2021 exam series in England did not take place due to the COVID-19 pandemic. Therefore, the exceptional arrangements put in place in 2021 were that students were only assessed on the content they had been taught and grades were determined by teachers (teacher-assessed grades) based on a range of evidence. Those grades were quality assured and awarded by exam boards. Due to exams not taking place in 2021, there were no reviews of marking and moderation as students’ work was neither marked nor moderated by exam boards given the different arrangements in place. Furthermore, whilst Ofqual and exam boards normally use a range of tools to secure consistent standards between students and over time, it was not possible to use the same approaches in 2021 because exams did not take place.
All respondents were informed or reminded of the exceptional arrangements that were put in place in 2021 and were instructed to first respond to the general section of the survey with their perceptions of GCSEs, A levels, and Applied General qualifications in general, and not specific to any one exam series. Respondents were then instructed to respond to the 2021-specific section of the survey with their perceptions of GCSEs, A levels, and Applied General qualifications in summer 2021 and the different arrangements due to the cancellation of exams in summer 2021 as a response to the coronavirus (COVID-19) pandemic.
As such, readers can best understand the extraordinary nature of 2021 by comparing the specific and general sections of the report. The responses to the 2021-specific questions may best be understood as reflections on the confidence in the extraordinary arrangements for 2021 and not on the exams system in general. Therefore, the arrangements in 2021 are not necessarily associated with a decrease in the general perceptions of confidence in the qualifications system overall.
Key Findings
Perceptions of the qualifications system in 2021
- Asking respondents to think specifically about their perceptions of qualifications in 2021 rather than just their more general outlook highlighted the impact that the changes in 2021 had on perceptions of qualifications in that year. In 2021, GCSEs and A levels appeared to be perceived as less understood (33% and 32% respectively), trusted (32% and 32% respectively) and consistent in standards (25% and 25% respectively) when compared to thinking about the qualifications generally.
- Comparatively, there was no difference between 2021-specific and general perceptions when it came to Applied General qualifications being ‘understood by people’ (16% for both qualifications in 2021 and generally). There was also less agreement that GCSEs, A levels and Applied General qualifications in 2021 were ‘good preparation for further study’ (27%, 43% and 27% respectively).
- These differences in levels of agreement between 2021-specific and general perceptions tended to be more prominent in the case of GCSEs and A levels than for Applied General qualifications, apart from in the case of whether the qualifications were ‘good preparation for work’, where a larger gap was recorded for Applied General qualifications (30% for 2021 specifically, 45% when thinking generally).
- Respondents were less aware of the modified appeals against results process in place for GCSE and A level results in 2021 than they were about the usual review of marking and moderation and appeals process (62% compared to 84%). Among those aware of the 2021 appeals process or those aware of the usual review of marking and moderation and appeals, levels of agreement that the process was fair were lower than when thinking about the usual system (43% compared to 51% for GCSEs, 42% compared to 49% for A levels). Interestingly, however, among these audiences, respondents were more likely to agree that they had ‘adequate information about the process in 2021’ than the process more generally (58% compared with 50%).
- Teachers and head teachers were similarly as likely to say they were aware of the appeals against results process in place for Applied General qualifications in 2021 as they were of the normal review of marking and moderation and appeals process (93% and 88% respectively). They were also equally as likely to feel they had adequate information about the modified process (83%) and that appeals were dealt with fairly (70%).
- Those who teach GCSEs or A levels were less likely to agree that they had ‘adequate information about what constituted malpractice in 2021’ in comparison with their more general awareness (73% compared with 89%). Conversely, those who teach Applied General qualifications were similarly as likely to feel they had ‘adequate information about what constituted malpractice in 2021’ (83%) versus in general (85%). Following on from this, teachers of GCSEs and A levels were less confident that ‘incidents of malpractice were fairly investigated’ and properly reported in 2021 (49% in 2021, 89% generally), while there was no difference in the among teachers of Applied General qualifications when thinking about fair investigation of incidents of malpractice (69% in 2021, 70% generally).
Composite confidence in GCSE, A level and Applied General qualifications: general perceptions
- The composite confidence measure was calculated based on levels of agreement with eight separate questions relating to the following criteria: understanding, trust, maintenance of standards, preparation for further study, preparation for work, skill development, accuracy in marking, and value for money. For more information on how the composite confidence measure is calculated, please see the accompanying background information document.
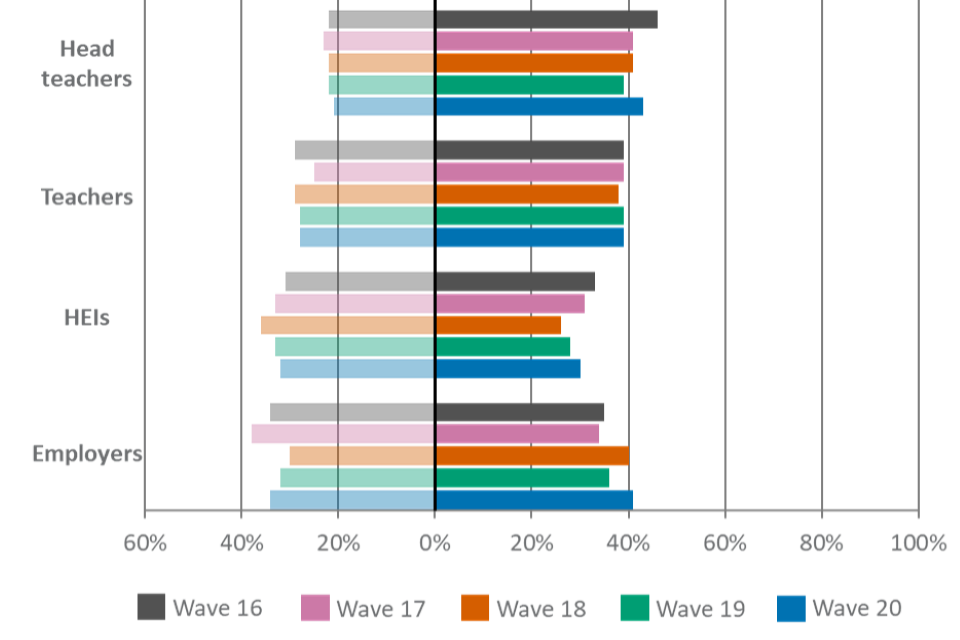
- Overall confidence in GCSE and Applied General qualifications in general was broadly consistent with wave 19, while general overall confidence in A levels increased.
- General confidence in A levels increased among all stakeholder groups apart from employers and HEIs, among whom it remained broadly level. Notably, among these employers and HEIs, it was also the case that general confidence in GCSEs decreased in comparison with wave 19.
General perceptions of GCSEs
- Overall, perceptions of GCSEs generally remained consistent with wave 19, including that they are well understood (70%), trusted (73%), ‘good preparation for work’ (35%), and ‘develop a broad range of skills’ (59%). However, there was a decrease in levels of agreement for two measures: that, in general, ‘GCSE standards are maintained year-on-year’ (42%) and that, in general, they are ‘good preparation for further study’ (70%). In both cases, levels of agreement returned to those observed in earlier waves.
- Among head teachers and teachers, levels of agreement that, in general, ‘the marking of GCSEs is accurate’ (54% and 57% respectively) and that they are, in general, ‘well understood by people’ (77% and 71% respectively) maintained the increase from wave 18 to wave 19.
- Meanwhile, decreases in levels of agreement that, in general, ‘the marking of GCSEs is accurate’ (35%) and that they are, in general, trusted qualifications (66%) were recorded among the general public compared to wave 19.
General perceptions of A levels
- Overall, perceptions of A levels generally remained in line with previous waves, including that they are trusted (83%), ‘good preparation for further study’ (81%) and work (39%), and ‘develop a broad range of skills for students’ (49%).
- However, there were also some shifts in perceptions. There was an increase in levels of agreement that, in general, ‘A levels are well understood by people’ at the overall level (69% compared to 63% in wave 19) and among each stakeholder group apart from HEIs. Meanwhile, there was a decrease in agreement that, in general, ‘A level standards are maintained year-on-year’ (45% compared to 50% in wave 19), which occurred specifically among the general public and HEIs.
- Consistent with findings regarding GCSEs, among head teachers (59%) and teachers (66%), levels of agreement that, in general, ‘the marking of A levels is accurate’ continued to increase gradually over time in comparison with wave 18.
- Among young people, there was a decrease in levels of agreement that, in general, A levels offer value for money in comparison with wave 19 (39% compared with 47%).
General perceptions of Applied General qualifications
- Thinking generally about Applied General qualifications, levels of overall agreement were consistent with wave 19 for each of the perceptions.
- Head teachers and teachers maintained the increased levels of agreement initially recorded in wave 19 that Applied General qualifications in general are trusted (36% and 26% respectively) and that their ‘marking is accurate’ (41% and 27% respectively).
- HEIs reported gradually increasing levels of agreement building from wave 17 that Applied General qualifications in general are trusted qualifications (from 15% in wave 17, to 34% in wave 20).
Reviews of marking and moderation, and appeals against results for GCSE and A level results
- Awareness of the normal process of reviews of marking and moderation, and appeals systems for GCSE and A level results was consistent with wave 19.
- Approximately half of respondents agreed that the system is fair for GCSEs (51%) and A levels (49%), which was consistent among most stakeholder groups apart from teachers, among whom agreement increased in wave 20 to 62% for both GCSEs and A levels. Overall, half (50%) of respondents also agreed that they have adequate information about the process.
Special consideration and reasonable adjustments for GCSE and A level qualifications
- The proportion of teachers and head teachers who agreed that they have ‘adequate information about the arrangements available for a GCSE or A level student who is eligible for special consideration’ remained in line with wave 19 (79%).
- This was also the case for overall agreement that ‘special consideration makes the qualification system fairer’ (64%), and that the ‘right arrangements are made for the right students’ in the current system (54%).
- Similarly, the proportions of teachers and head teachers remained broadly consistent with wave 19 when thinking about whether they have ‘adequate information about the adjustments available for a disabled GCSE or A level student who is eligible for reasonable adjustments’ (72%). This was also the case for agreement that the ‘right reasonable adjustments are made for the right GCSE and A level disabled students’ (53%).
Malpractice for GCSE and A level qualifications
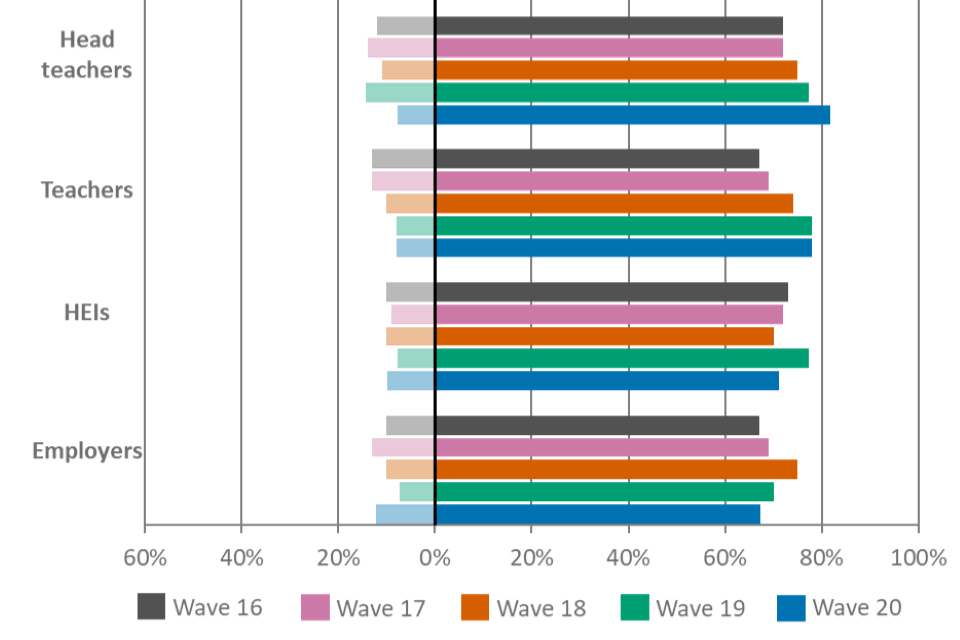
- The proportion of teachers (83%) and head teachers (95%) who agreed that they have ‘adequate information about what constitutes malpractice for GCSEs and A levels’ was broadly consistent with wave 19.
- Similarly, the proportion who said they ‘know to whom they should report an incident of malpractice’ (89%) and are ‘confident incidents of malpractice are fairly investigated’ (72%) and reported (62%), each of which were higher for head teachers than for teachers, were on a par with wave 19.
Appeals against results for Applied General qualifications
- The overall proportion (84%) of those teaching Applied General qualifications who were ‘aware of the appeals against results process’ remained in line with recent waves but higher than in wave 17 (70%). The proportions who feel they have ‘adequate information about the appeals against results process’ and are ‘confident that appeals are dealt with fairly’ were also broadly consistent with wave 19 (72%).
Malpractice for Applied General qualifications
- Overall, levels of agreement among teachers and head teachers regarding malpractice for Applied General qualification remained consistent (85%) with wave 19.
- Much like in wave 19, the majority of teachers and head teachers agreed that they are ‘confident incidents of malpractice for Applied General qualifications are fairly investigated’ (69%) and properly reported (69%). The vast majority (85%) also agreed that they have ‘adequate information about what constitutes malpractice for Applied General qualifications’ and know to whom to report an incident.
Innovations
- Roughly equal proportions of respondents agreed (32%) and disagreed (31%) that ‘onscreen examinations (for example, exams taken on a computer) in GCSE and A level qualifications would be fairer for students than existing pen and paper examinations’. Overall agreement increased in comparison with wave 19, as did agreement among young people (47%) specifically. Agreement levels in both cases were similar to wave 18.
- Overall, the proportion of respondents who agreed that ‘onscreen examinations in GCSE and A level qualifications would be more manageable for schools and colleges’ was higher than in wave 19, but comparable with wave 18. This increase in comparison with wave 19 was observed specifically among head teachers and teachers.
Section 1: Perceptions of the qualifications system in 2021
For wave 20 a new series of questions was added to the survey to investigate perceptions specific to the qualifications system in 2021. All respondents were informed (or reminded) that the summer 2021 exam series in England was cancelled due to the COVID-19 pandemic, and that students were only assessed on the content they had been taught and grades were determined by teachers (teacher assessed grades) based on a range of evidence. Respondents across all groups were presented with statements and questions similar to those asked in the annual survey but instructed to think specifically about perceptions for qualifications and arrangements in 2021. This section explores how 2021-specific perceptions of GCSEs, A levels and Applied General qualifications differ and, if so, to what extent, from general perceptions of these qualifications reported in 2021.
Confidence in GCSEs, A levels and Applied General qualifications in 2021
For Figures 1, 2 and 3, the wave 20 effective base was: All responses (N=2,106).
Overall, respondents tended to express lowers levels of confidence in GCSEs, A levels and Applied General qualifications when thinking specifically about the circumstances in 2021 than when considering their general perceptions of these qualifications. Compared to general perceptions, when thinking specifically about 2021, these qualifications appeared to be perceived as less understood and trusted, and standards were less likely to be seen as maintained. There was also less support for them being good preparation for further study and work when compared to general perceptions in 2021.
When thinking about whether ‘GCSEs were well understood by people’, respondents were much less likely to agree when thinking about 2021 specifically than when considering their general perceptions (33% compared with 70%). This was also the case when looking at perceptions of trust; there were much lower levels of agreement among respondents that ‘GCSEs are a trusted qualification’ when thinking about 2021 specifically in comparison with general perceptions (32% compared with 73%). Respondents also demonstrated lower levels of agreement that ‘standards for GCSEs were maintained’ when thinking specifically about the qualifications in 2021 (25%) compared to maintaining standards more generally (42%), although this was not to the same extent as whether they are understood or trusted. Correspondingly, these metrics also saw increasing disagreement when comparing views of 2021 with general perceptions.
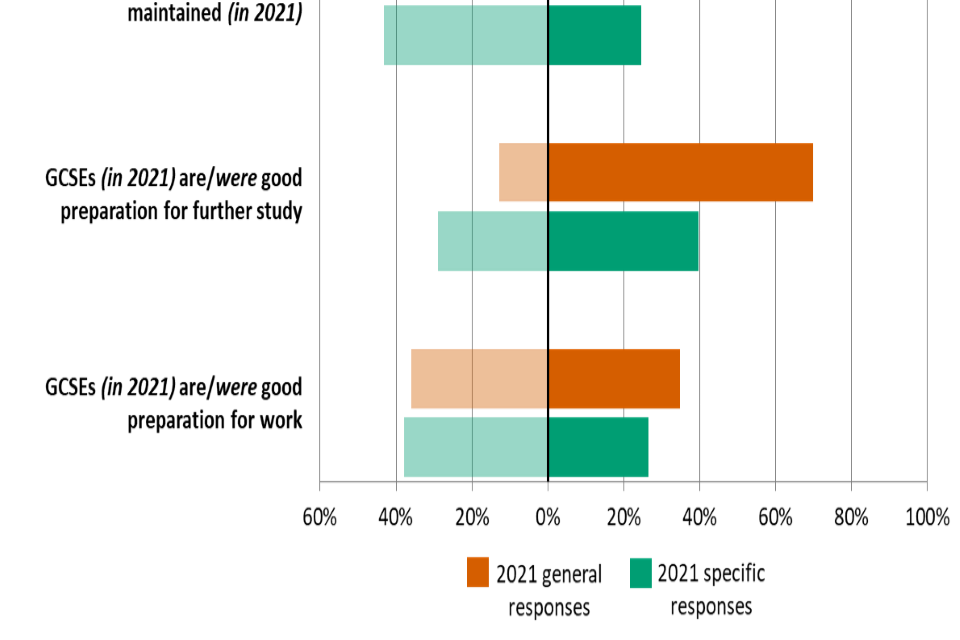
Results indicated that, compared to general perceptions, respondents were less likely to perceive GCSEs as being ‘good preparation for further study’ or ‘good preparation for work’ in 2021; both measures saw significantly lower agreement when thinking about 2021 specifically compared to general perceptions. Four in ten (40%) respondents agreed that ‘GCSEs in 2021 were good preparation for further study’, compared with 70% in general. When thinking about work, the differences, while significant, were less pronounced (27% compared with 35%). Notably, unlike preparation for further study, preparation for further work saw no significant difference in disagreement when comparing 2021-specific perceptions with general perceptions (38% compared with 36%).
Figure 1. 2021-specific confidence in GCSEs vs general confidence in GCSEs in 2021

Note: Italics are used to highlight text used in the 2021-specific question set.
| Statement | 2021 general responses | 2021-specific responses |
|---|---|---|
| “GCSEs are well understood by people” or “GCSEs in 2021 were well understood by people” – agree | 70% | 33% |
| “GCSEs are well understood by people” or “GCSEs in 2021 were well understood by people” – disagree | 12% | 37% |
| “GCSEs are a trusted qualification” or “GCSEs in 2021 were a trusted qualification” – agree | 73% | 32% |
| “GCSEs are a trusted qualification” or “GCSEs in 2021 were a trusted qualification” – disagree | 9% | 38% |
| “GCSE standards are maintained year on year” or “GCSE standards were maintained in 2021” – agree | 42% | 25% |
| “GCSE standards are maintained year on year” or “GCSE standards were maintained in 2021” – disagree | 27% | 43% |
| “GCSEs are good preparation for further study” or “GCSEs in 2021 were good preparation for further study” – agree | 70% | 40% |
| “GCSEs are good preparation for further study” or “GCSEs in 2021 were good preparation for further study” – disagree | 13% | 29% |
| “GCSEs are good preparation for work” or “GCSEs in 2021 were good preparation for work” – agree | 35% | 27% |
| “GCSEs are good preparation for work” or “GCSEs in 2021 were good preparation for work” – disagree | 36% | 38% |
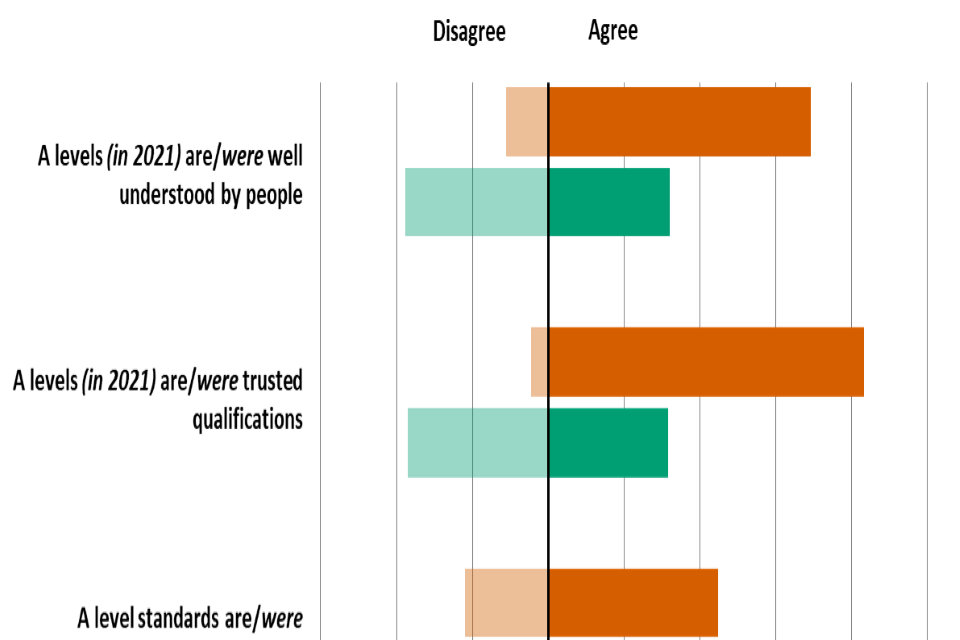
These attitudes were mirrored when thinking about A levels generally versus specifically in 2021. When examining levels of agreement on whether ‘A levels were well understood by people’, respondents were less likely to agree when thinking about 2021 specifically than when considering their general perceptions (32% compared with 69%). Similarly, there were lower levels of agreement among respondents that ‘A levels were trusted qualifications’ when thinking about 2021 specifically in comparison with more general perceptions (32% compared with 83%). This was also the case when thinking about agreement that ‘standards are maintained’ in 2021 (25%) compared with general perceptions of A level standards (45%).
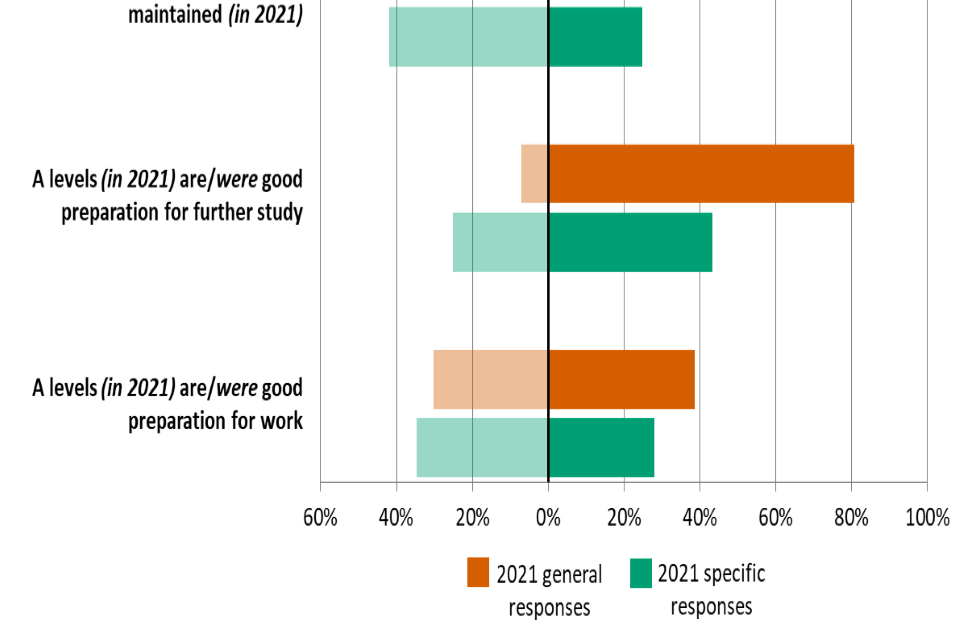
Much like GCSEs, Figure 2 shows that respondents’ perceptions of A levels being good preparation for further study or work in 2021 were lower than general perceptions this year. Compared to general perceptions, respondents reported lower levels of agreement that ‘A levels in 2021 were good preparation for further study’ (43% compared with 81%), and although there was somewhat of a difference regarding whether A levels in 2021 were perceived as ‘good preparation for work’, like with GCSEs, these differences were less pronounced (28% compared with 39%).
Figure 2. 2021-specific confidence in A levels vs general confidence in A levels in 2021
Note: Italics are used to highlight text used in the 2021-specific question set.
In wave 20, the question text changed to remove reference to AS levels.
| Statement | 2021 general responses | 2021-specific responses |
|---|---|---|
| “A levels are well understood by people” or “A levels in 2021 were well understood by people” – agree | 69% | 32% |
| “A levels are well understood by people” or “A levels in 2021 were well understood by people” – disagree | 11% | 38% |
| “A levels are trusted qualifications” or “A levels in 2021 were trusted qualifications” – agree | 83% | 32% |
| “A levels are trusted qualifications” or “A levels in 2021 were trusted qualifications” – disagree | 5% | 37% |
| “A level standards are maintained year on year” or “A level standards were maintained in 2021”– agree | 45% | 25% |
| “A level standards are maintained year on year” or “A level standards were maintained in 2021”– disagree | 22% | 42% |
| “A levels are good preparation for further study” or “A levels in 2021 were good preparation for further study” – agree | 81% | 43% |
| “A levels are good preparation for further study” or “A levels in 2021 were good preparation for further study” – disagree | 7% | 25% |
| “A levels are good preparation for work” or “A levels in 2021 were good preparation for work” – agree | 39% | 28% |
| “A levels are good preparation for work” or “A levels in 2021 were good preparation for work” – disagree | 30% | 35% |
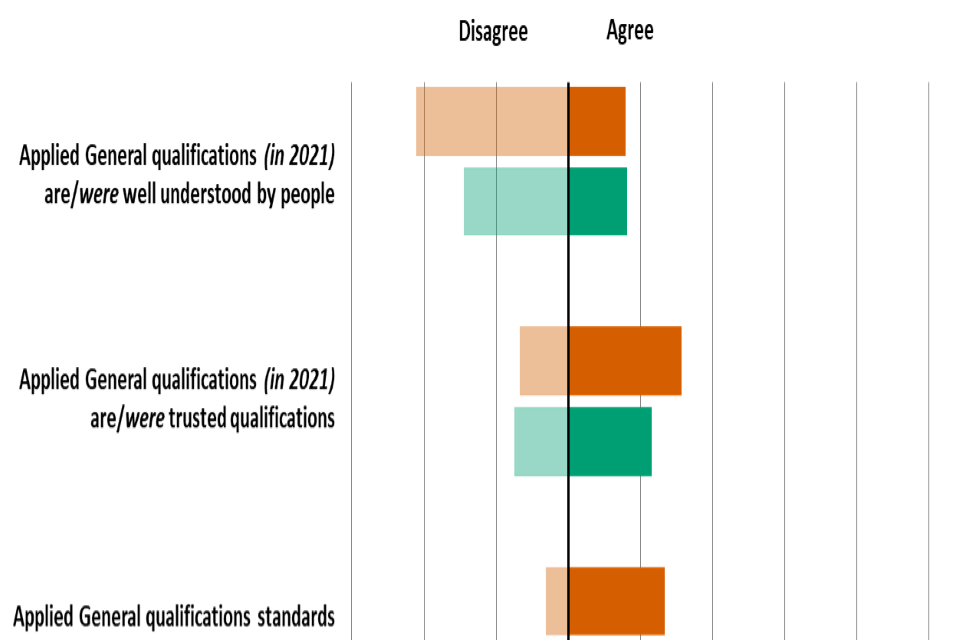
Unlike GCSEs and A levels, the differences in general perceptions of Applied General qualifications compared with those specific to 2021 were less pronounced. Notably, there was no difference between 2021-specific and general perceptions regarding whether ‘Applied General qualifications were well understood by people’ (both 16%) although respondents were more likely to disagree with the 2021-specific statement compared with that for general perceptions (42% compared with 29%).
However, when it came to perceptions of trust, there were lower levels of agreement among respondents that Applied General qualifications were trusted when thinking about 2021 in comparison with more general perceptions (23% compared with 31%) or that ‘standards were maintained’ (21% compared with 27%).
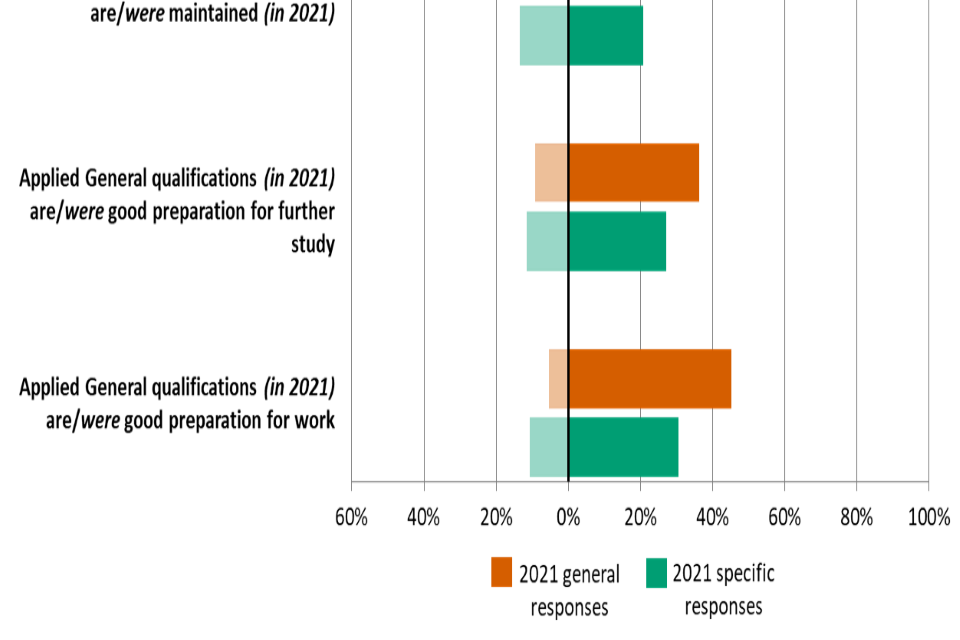
Respondents reported lower levels of agreement that Applied General qualifications were ‘good preparation for further study’ in 2021 than when thinking more generally (27% compared with 36%). In contrast to GCSEs and A levels, however, the gap in levels of agreement was wider regarding perceptions of whether the qualifications were ‘good preparation for work’ (30% compared with 45%). This differs to all other measures where the gaps in level of agreement were smaller than for GCSEs and A levels.
Figure 3. 2021-specific confidence in Applied General qualifications vs general confidence in Applied General qualifications in 2021
Note: Italics are used to highlight text used in the 2021-specific question set.
| Statement | 2021 general responses | 2021-specific responses |
|---|---|---|
| “Applied General qualifications are well understood by people” or “Applied General qualifications in 2021 were well understood by people” – agree | 16% | 16% |
| “Applied General qualifications are well understood by people” or “Applied General qualifications in 2021 were well understood by people” – disagree | 42% | 29% |
| “Applied General qualifications are trusted qualifications” or “Applied General qualifications in 2021 were trusted qualifications” – agree | 31% | 23% |
| “Applied General qualifications are trusted qualifications” or “Applied General qualifications in 2021 were trusted qualifications” – disagree | 13% | 15% |
| “Applied General qualifications standards are maintained year on year” or “Applied General qualifications standards were maintained in 2021” – agree | 27% | 21% |
| “Applied General qualifications standards are maintained year on year” or “Applied General qualifications standards were maintained in 2021” – disagree | 6% | 13% |
| “Applied General qualifications are good preparation for further study” or “Applied General qualifications in 2021 were good preparation for further study” – agree | 36% | 27% |
| “Applied General qualifications are good preparation for further study” or “Applied General qualifications in 2021 were good preparation for further study” – disagree | 9% | 11% |
| “Applied General qualifications are good preparation for work” or “Applied General qualifications in 2021 were good preparation for work” – agree | 45% | 30% |
| “Applied General qualifications are good preparation for work” or “Applied General qualifications in 2021 were good preparation for work” – disagree | 5% | 11% |
Appeals for GCSE and A level results in 2021
For Figure 4, the wave 20 effective base was: All who were aware of the process of reviews of marking and moderation, and appeals for GCSE and A level results (N=1,727) (general perceptions); All who were aware of the appeals against results process for GCSEs and A levels (hereafter this will be referred to as ‘the appeals process’) in 2021 (N=1,271) (2021-specific perceptions).
During the survey, respondents were informed (or reminded) that the appeals process for GCSE and A level results was different than usual in 2021, as there was no reviews of marking and moderation stage as students’ work was neither marked nor moderated by exam boards given the different arrangements in place. The appeals process was the way in which students or centres could get the results reconsidered if there was an error in their grades.
When asked if they were aware that there was this appeals process in place for GCSE and A level results in 2021, 62% of respondents reported that they were aware. In comparison, 84% of respondents reported being aware of the usual process of reviews of marking and moderation and appeals for GCSE and A level results. Among those who were aware of the appeals process in place for GCSE and A level results in 2021, 43% agreed that the process was fair for GCSEs. This was lower than the levels of agreement reported for general perceptions of the fairness of the process for GCSE results (51%). Similarly, respondents were less likely to agree that the appeals process for A levels was fair in 2021 (42%) in comparison with the proportion who agreed that this is generally the case (49%).
Interestingly, when thinking about information on the appeals process for GCSEs and A levels, respondents were more likely to agree that they had adequate information about the process in 2021 compared with more generally (58% compared with 50%).
Figure 4. 2021-specific perceptions of the appeals process for GCSE and A level results vs general perceptions of the appeals process for GCSE and A level results in 2021

Note: Italics are used to highlight text used in the 2021-specific question set.
In wave 20, the question text changed to remove reference to AS levels.
| Statement | 2021 general responses | 2021-specific responses |
|---|---|---|
| “The process of reviews of marking and moderation, and appeals for GCSE results is fair” or “The appeals against results process for GCSEs in 2021 was fair” – agree | 51% | 43% |
| “The process of reviews of marking and moderation, and appeals for GCSE results is fair” or “The appeals against results process for GCSEs in 2021 was fair” – disagree | 14% | 19% |
| “The process of reviews of marking and moderation, and appeals for A level results is fair” or “The appeals against results process for A levels in 2021 was fair” – agree | 49% | 42% |
| “The process of reviews of marking and moderation, and appeals for A level results is fair” or “The appeals against results process for A levels in 2021 was fair” – disagree | 13% | 18% |
| “I have adequate information about the process of reviews of marking and moderation, and appeals for GCSE and A level results” or “I had adequate information about the appeals against results process for GCSEs and A levels in 2021” – agree | 50% | 58% |
| “I have adequate information about the process of reviews of marking and moderation, and appeals for GCSE and A level results” or “I had adequate information about the appeals against results process for GCSEs and A levels in 2021” – disagree | 24% | 17% |
Malpractice for GCSEs and A levels in 2021
For Figure 5 the wave 20 effective base was: All who teach GCSEs or A levels (N=548).
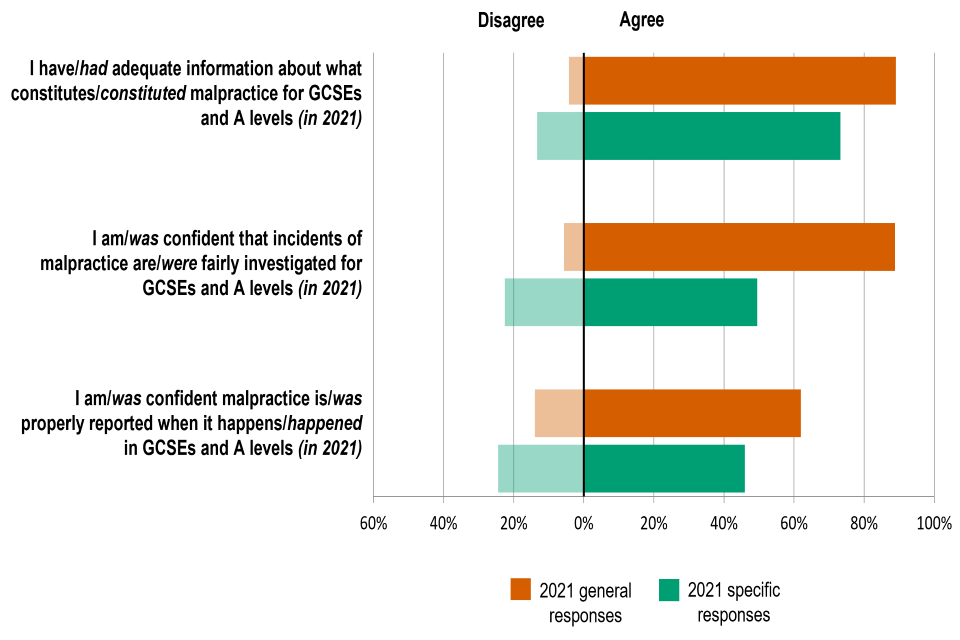
Among teachers and head teachers who teach GCSEs or A levels, 73% agreed that they had ‘adequate information about what constituted malpractice’ for GCSEs and A levels in 2021. In comparison, levels of agreement were higher when the same respondent groups were asked whether they generally felt they have adequate information about this (89%).
Similarly, teachers and head teachers who teach GCSEs or A levels were much less likely to agree that they were confident that ‘incidents of malpractice were fairly investigated’ for these qualifications in 2021 (49%) in comparison with general perceptions (89%). When considering levels of agreement that they were ‘confident malpractice was properly reported when it happened in GCSEs and A levels’; levels of agreement were lower for 2021 (46%) than for their overall perceptions (62%).
Figure 5. 2021-specific perceptions of malpractice for GCSEs and A Levels vs general perceptions of malpractice for GCSEs and A Levels in 2021
Note: Italics are used to highlight text used in the 2021-specific question set.
In wave 20, the question text changed to remove reference to AS levels.
| Statement | 2021 general responses | 2021-specific responses |
|---|---|---|
| “I have adequate information about what constitutes malpractice for GCSEs and A levels” or “I had adequate information about what constituted malpractice for GCSEs and A levels in 2021” – agree | 89% | 73% |
| “I have adequate information about what constitutes malpractice for GCSEs and A levels” or “I had adequate information about what constituted malpractice for GCSEs and A levels in 2021” – disagree | 4% | 13% |
| “I am confident that incidents of malpractice are fairly investigated for GCSEs and A levels” or “I was confident that incidents of malpractice were fairly investigated for GCSEs and A levels in 2021” – agree | 89% | 49% |
| “I am confident that incidents of malpractice are fairly investigated for GCSEs and A levels” or “I was confident that incidents of malpractice were fairly investigated for GCSEs and A levels in 2021” – disagree | 6% | 23% |
| “I am confident malpractice is properly reported when it happens in GCSEs and A levels” or “I was confident malpractice was properly reported when it happened in GCSEs and A levels in 2021” – agree | 62% | 46% |
| “I am confident malpractice is properly reported when it happens in GCSEs and A levels” or “I was confident malpractice was properly reported when it happened in GCSEs and A levels in 2021” –disagree | 14% | 24% |
Appeals for Applied General qualification results in 2021
For Figure 6 the wave 20 effective base was: All who teach Applied General qualifications and were aware of the appeals against results process for Applied General qualifications (N=63) (general perceptions); All who teach Applied General qualifications and were aware of the appeals against results (hereafter this will be referred to as ‘the appeals process’) process for Applied General qualifications in 2021 (N=67) (2021-specific perceptions).
Teachers and head teachers who teach Applied General qualifications were informed (or reminded) that the appeals process for these qualifications results was different than usual in 2021, as there was no reviews of marking and moderation stage. The appeals process was the way in which students or centres could get the results reconsidered if there was an error in their grades.
When asked if they were aware that this was the appeals process in place for Applied General qualifications in 2021, 93% said that they were. Notably, a similar proportion reported being aware of the normal appeals process for Applied General qualifications (88%).
Teachers and head teachers of Applied General qualifications who were aware of the appeals process were also asked if they felt they had ‘adequate information about the process’ in 2021, and 83% agreed that this was the case, a very similar proportion to those who agreed that they have adequate information about the normal appeals process (84%). Similarly, when asked if they were ‘confident that appeals were dealt with fairly for Applied General qualifications in 2021’, 70% agreed in comparison with 72% who agreed with this statement regarding the normal process.
Figure 6. 2021-specific perceptions of the appeals process for Applied General qualification results vs general perceptions of the appeals process for Applied General qualification results in 2021

Note: Italics are used to highlight text used in the 2021-specific question set.
| Statement | 2021 general responses | 2021-specific responses |
|---|---|---|
| “I have adequate information about the appeals against results process for Applied General qualifications” or “I had adequate information about the appeals against results process for Applied General qualifications in 2021” – agree | 84% | 83% |
| “I have adequate information about the appeals against results process for Applied General qualifications” or “I had adequate information about the appeals against results process for Applied General qualifications in 2021” – disagree | 4% | 6% |
| “I am confident that appeals are dealt with fairly for Applied General qualifications” or “I was confident that appeals were dealt with fairly for Applied General qualifications in 2021” – agree | 72% | 70% |
| “I am confident that appeals are dealt with fairly for Applied General qualifications” or “I was confident that appeals were dealt with fairly for Applied General qualifications in 2021” – disagree | 4% | 6% |
Malpractice for Applied General qualifications in 2021
For Figure 7 the wave 20 effective base was: All who teach Applied General qualifications (N=73).
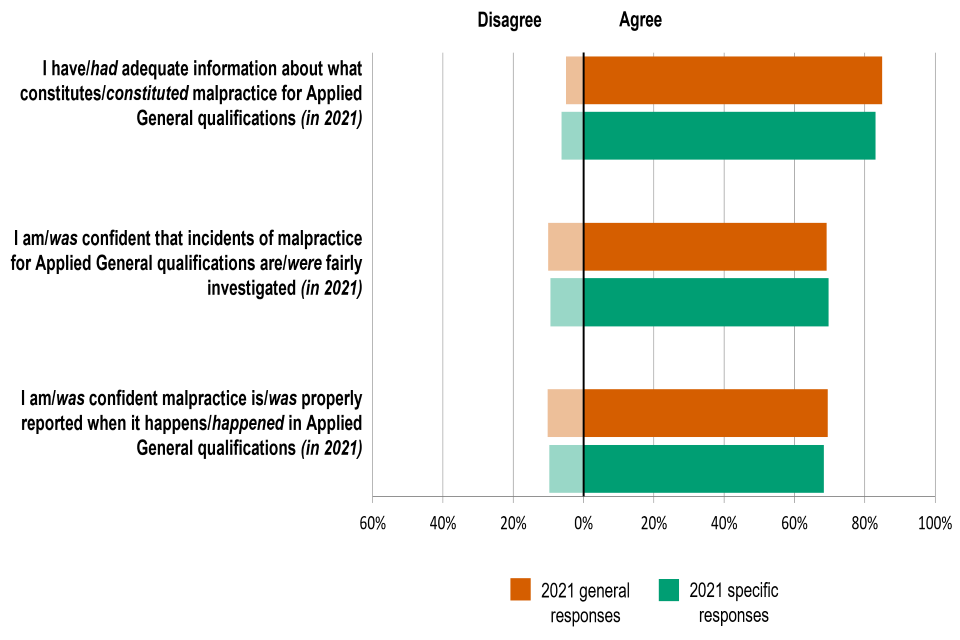
Teachers and head teachers who teach Applied General Qualifications were also presented with three statements about malpractice for these qualifications in 2021. Unlike GCSEs and A levels, opinions about malpractice in Applied General qualifications in 2021 were consistent with opinions about malpractice for these qualifications in general.
Overall, 83% agreed that they had ‘adequate information about what constituted malpractice for Applied General qualifications in 2021’, in line with the 85% who agreed that this is normally the case. Thinking about confidence in the system, 70% agreed that in 2021 they were ‘confident that incidents of malpractice for Applied General qualifications were fairly investigated’, which compared with 69% who agreed with this statement more generally. In addition, 68% agreed that they were confident malpractice was properly reported in these qualifications in 2021, in comparison with 69% who agreed with this statement regarding the normal system.
Figure 7. 2021-specific perceptions of malpractice for Applied General qualifications vs general perceptions of Applied General qualifications in 2021
Note: Italics are used to highlight text used in the 2021-specific question set.
| Statement | 2021 general responses | 2021-specific responses |
|---|---|---|
| “I have adequate information about what constitutes malpractice for Applied General qualifications” or “I had adequate information about what constituted malpractice for Applied General qualifications in 2021” – agree | 85% | 83% |
| “I have adequate information about what constitutes malpractice for Applied General qualifications” or “I had adequate information about what constituted malpractice for Applied General qualifications in 2021” – disagree | 5% | 6% |
| “I am confident that incidents of malpractice are fairly investigated for Applied General qualifications” or “I was confident that incidents of malpractice for Applied General qualifications were fairly investigated in 2021” – agree | 69% | 70% |
| “I am confident that incidents of malpractice are fairly investigated for Applied General qualifications” or “I was confident that incidents of malpractice for Applied General qualifications were fairly investigated in 2021” – disagree | 10% | 9% |
| “I am confident malpractice is properly reported when it happens in Applied General qualifications” or “I was confident malpractice was properly reported when it happened in Applied General qualifications in 2021” – agree | 69% | 68% |
| “I am confident malpractice is properly reported when it happens in Applied General qualifications” or “I was confident malpractice was properly reported when it happened in Applied General qualifications in 2021” – disagree | 10% | 10% |
Section 2: Composite confidence measure of qualifications in general
The following section looks at respondents’ composite confidence in GCSEs, A levels and Applied General qualifications in general. The results in this section relate to general perceptions, as opposed to 2021-specific perceptions.
The composite confidence measure was calculated based on levels of agreement with eight separate questions relating to the following criteria: understanding, trust, maintenance of standards, preparation for further study, preparation for work, skill development, accuracy in marking, and value for money. For more information on how the composite confidence measure is calculated, please see the accompanying background information document.
Composite confidence in GCSEs in general
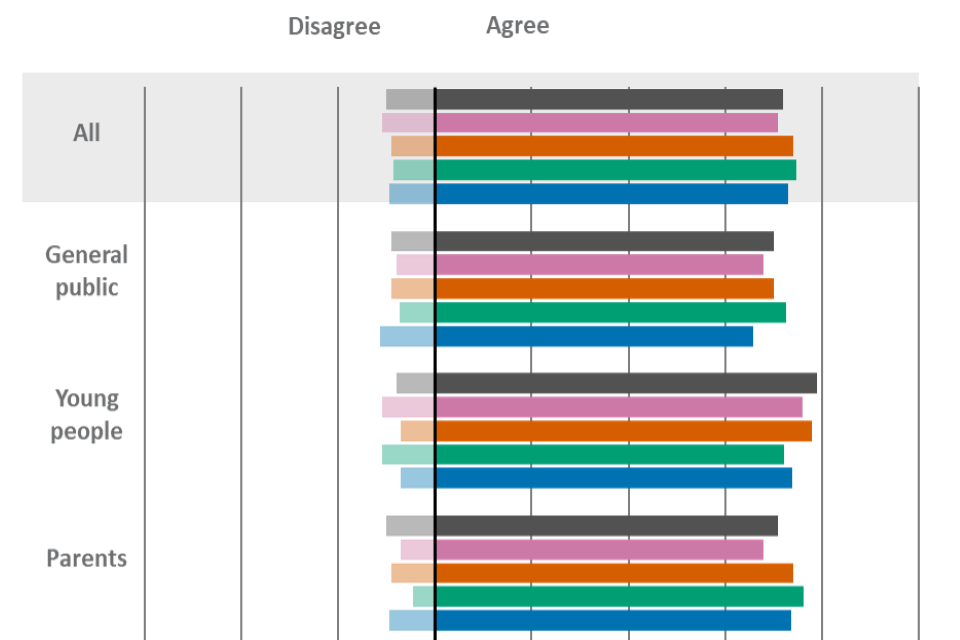
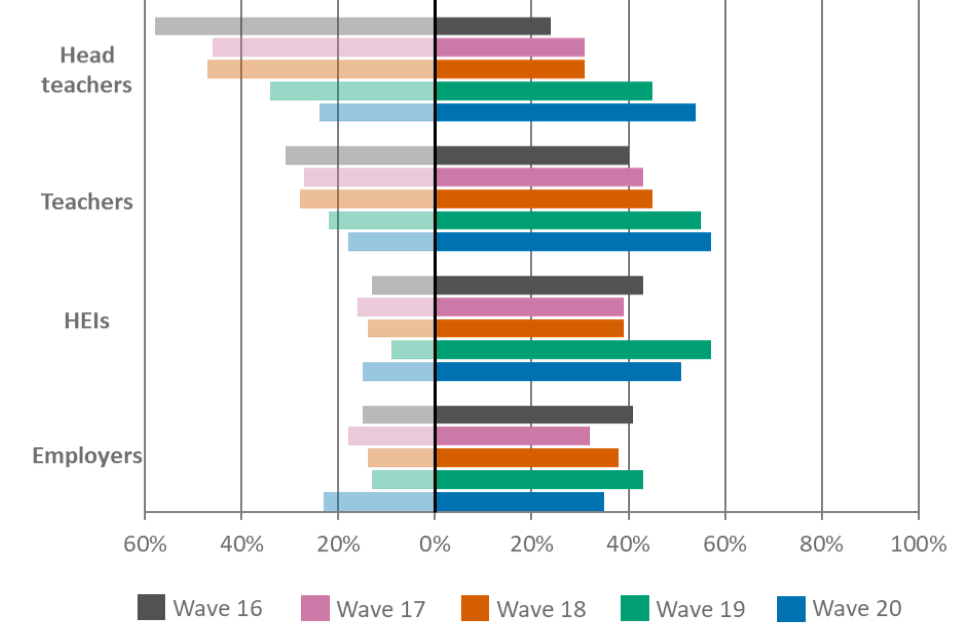
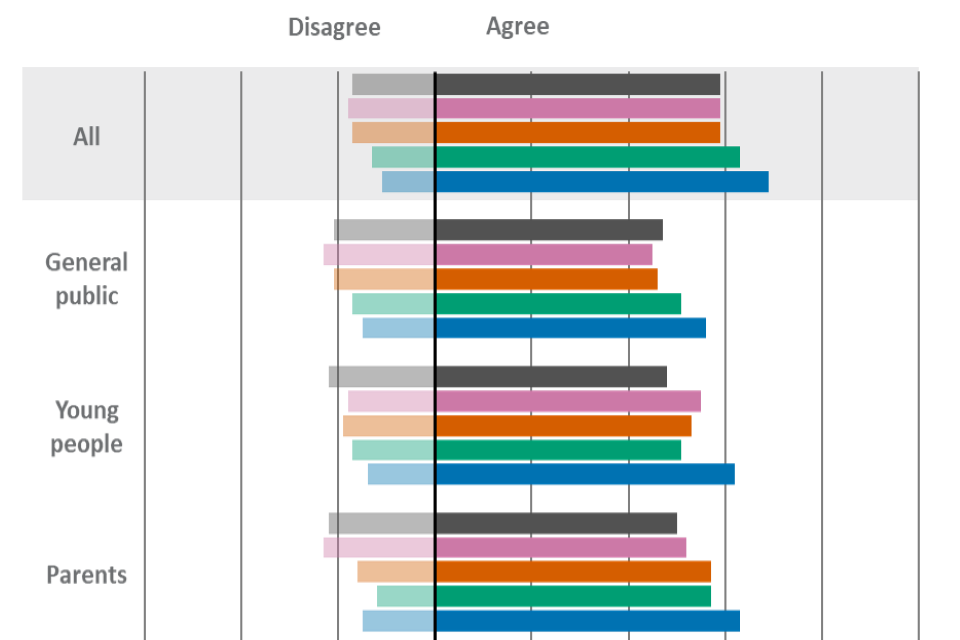
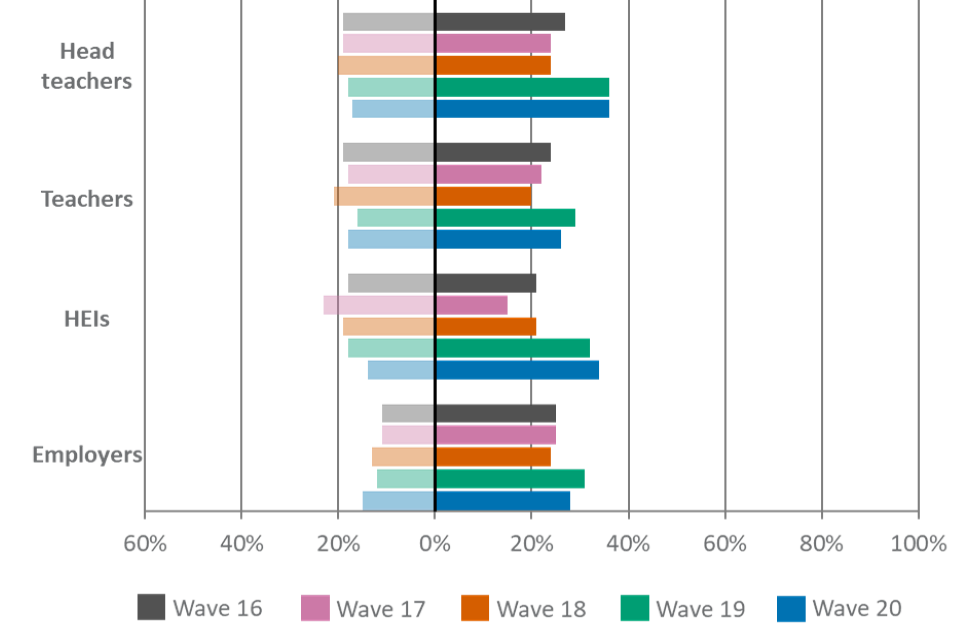
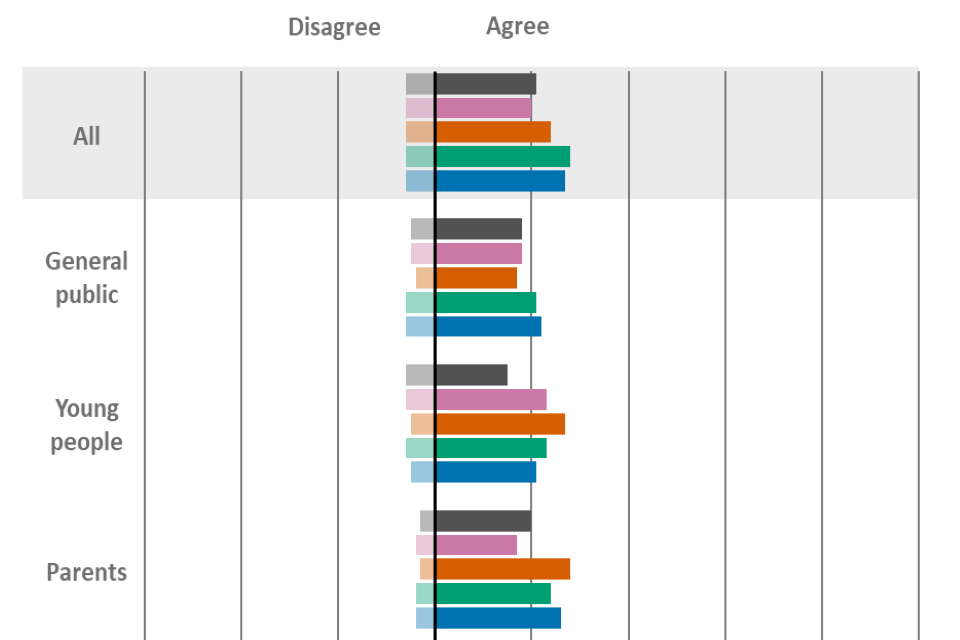
For Figure 8 the wave 20 base is: All responses (N=2,987); Young people (N=303); Parents (N=249); Teachers (N=688); Head teachers (N=269); HEIs (N=250); Employers (N=249); General public (N=979).
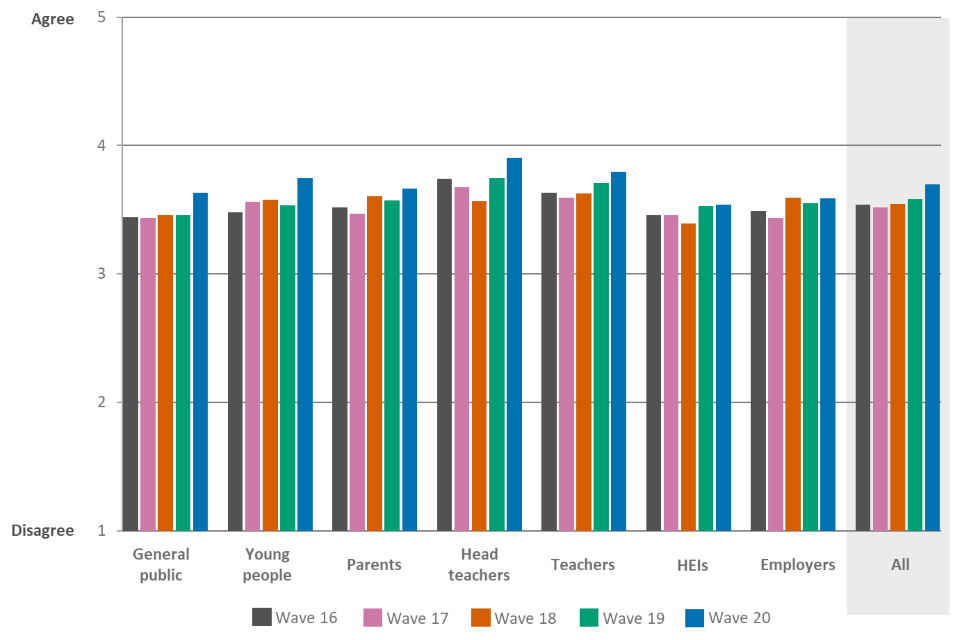
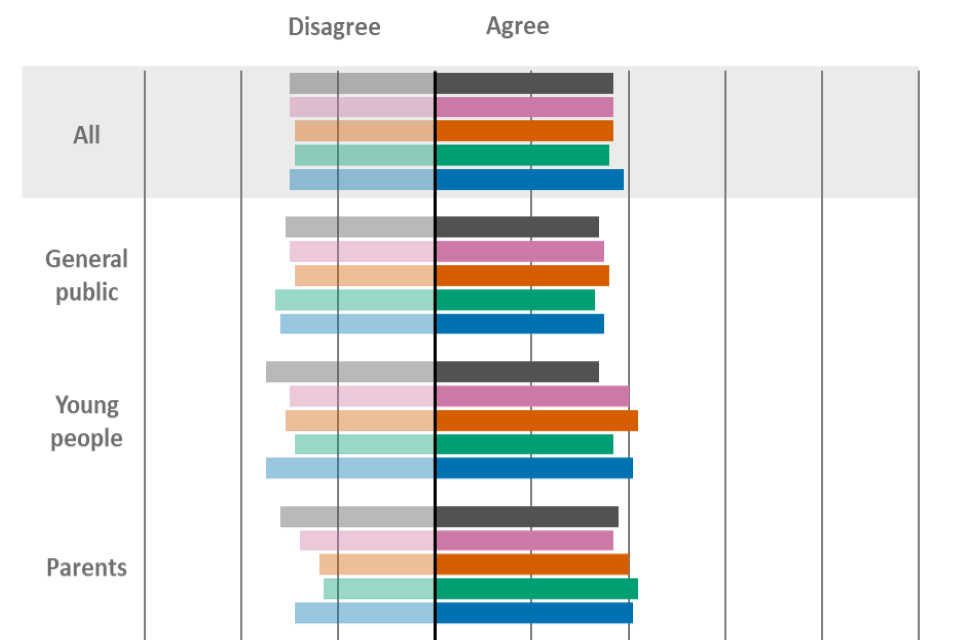
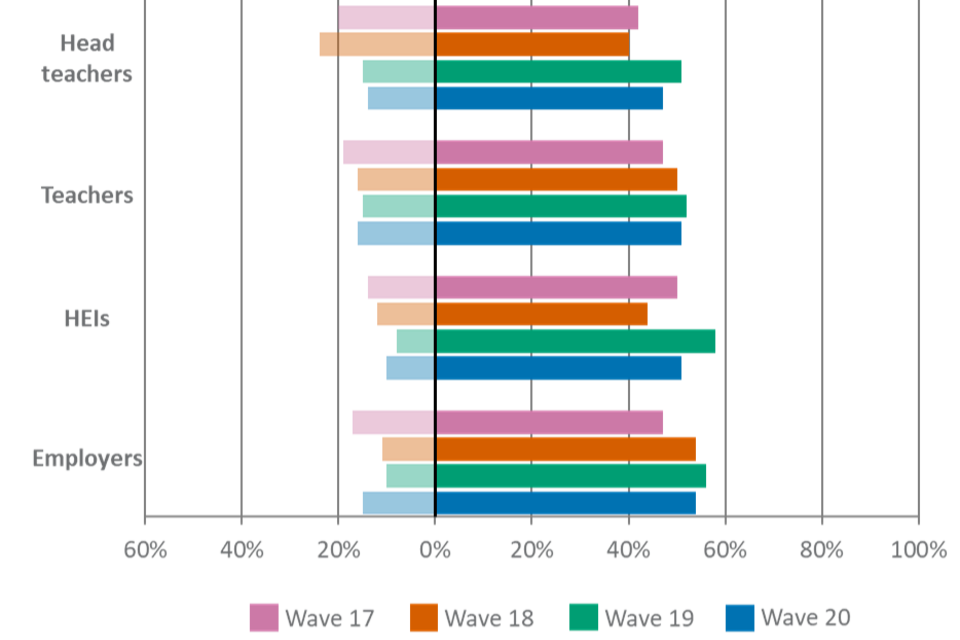
There was no statistically significant shift in composite confidence in GCSE qualifications in comparison with wave 19; it levelled out after having increased wave-on-wave between waves 17 and 19 (figure 8). Among employers and HEIs, however, there was a decrease in confidence in comparison with wave 19.
Figure 8. Composite confidence in GCSEs
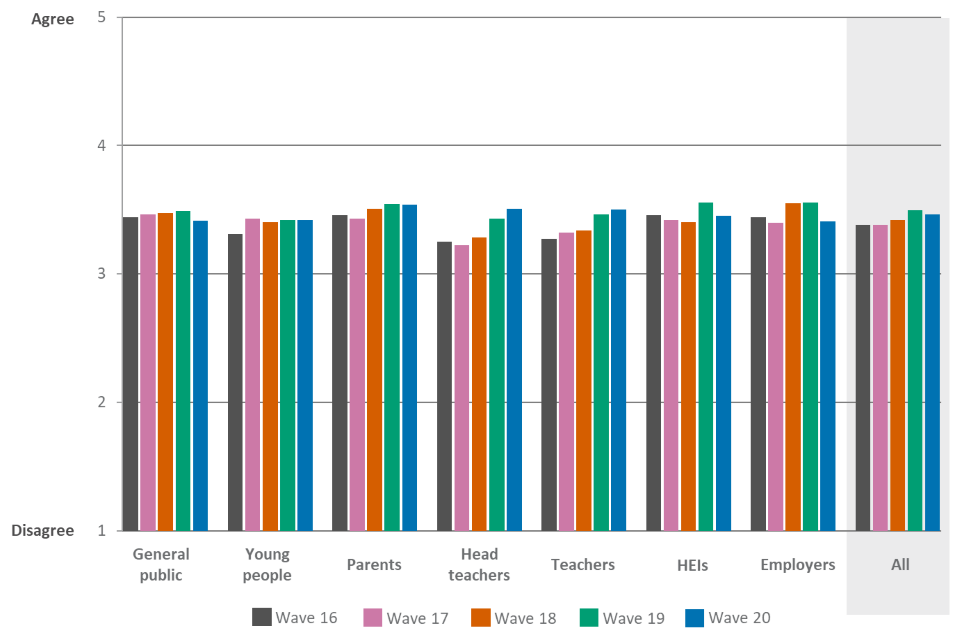
Strongly agree = 5, Agree = 4, Neither agree nor disagree = 3, Disagree = 2, Strongly disagree = 1. ‘Don’t know’ responses have been excluded.
| Respondent type | Wave 16 | Wave 17 | Wave 18 | Wave 19 | Wave 20 |
|---|---|---|---|---|---|
| All | 3.38 | 3.38 | 3.42 | 3.49 | 3.46 |
| General public | 3.44 | 3.47 | 3.47 | 3.49 | 3.42 |
| Young people | 3.31 | 3.43 | 3.40 | 3.42 | 3.42 |
| Parents | 3.46 | 3.43 | 3.51 | 3.55 | 3.54 |
| Head teachers | 3.25 | 3.22 | 3.28 | 3.43 | 3.51 |
| Teachers | 3.27 | 3.32 | 3.34 | 3.46 | 3.50 |
| HEIs | 3.46 | 3.42 | 3.40 | 3.56 | 3.45 |
| Employers | 3.44 | 3.40 | 3.55 | 3.55 | 3.41 |
Composite confidence in A levels in general
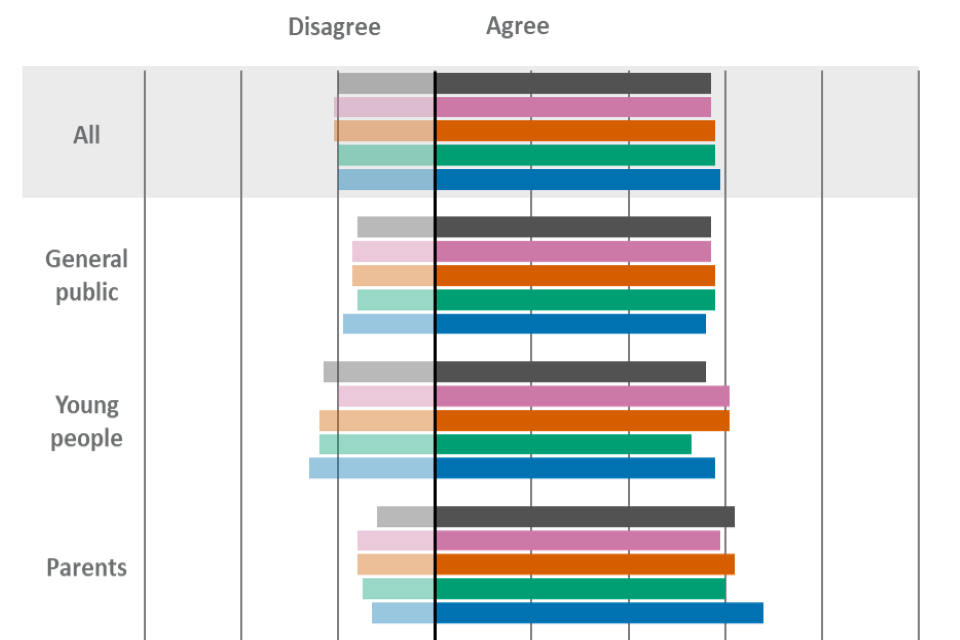
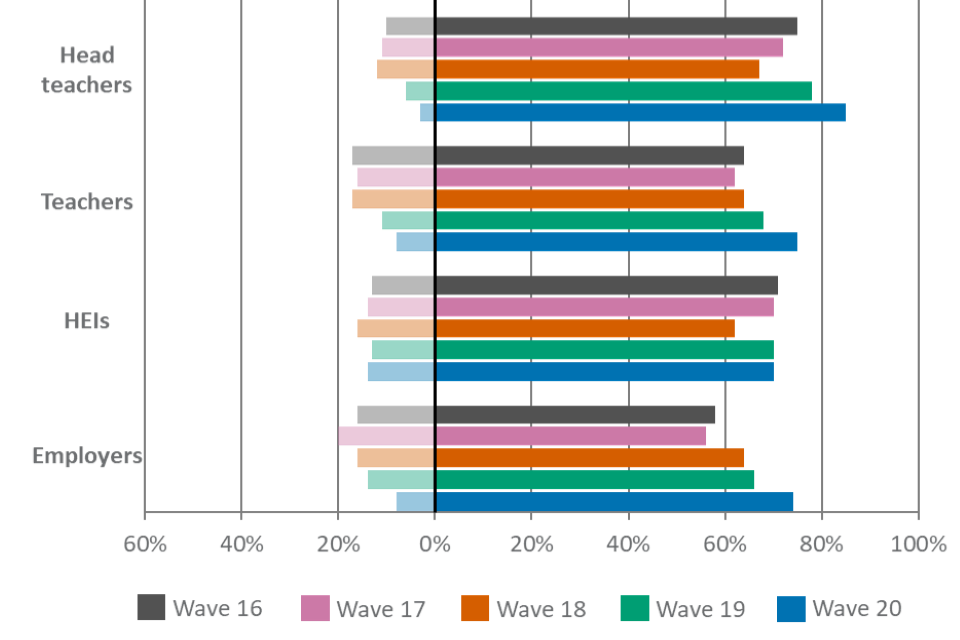
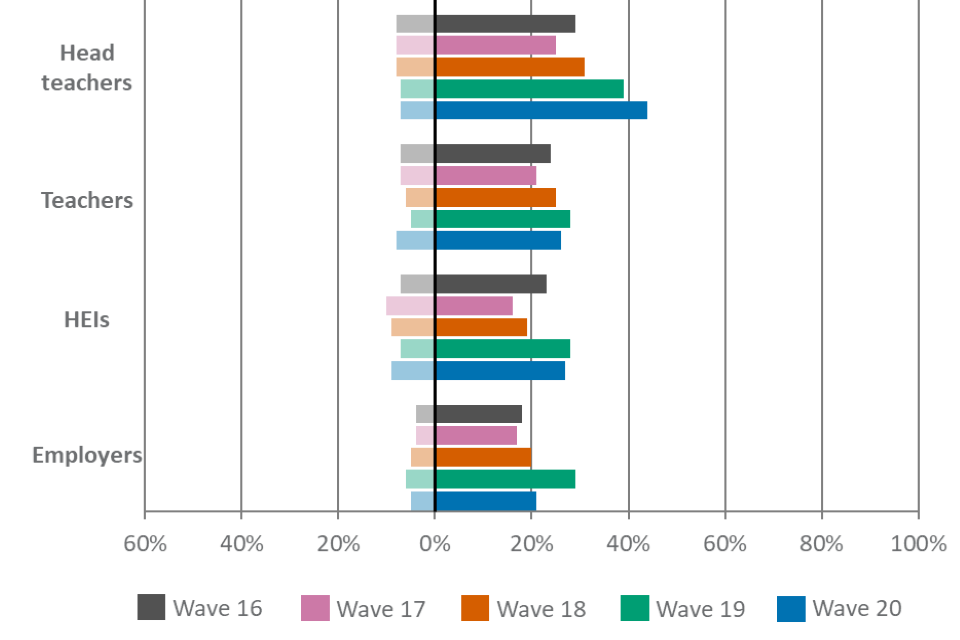
For Figure 9 the wave 20 base is: All responses (N=3,027); Young people (N=309); Parents (N=251); Teachers (N=693); Head teachers (N=269); HEIs (N=253); Employers (N=252); General public (N=1,000).
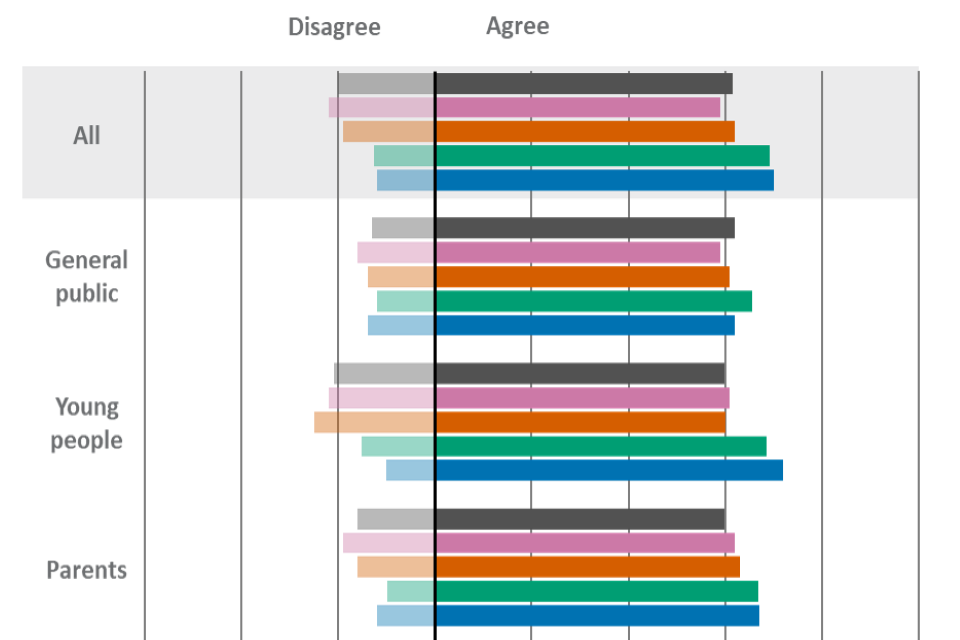
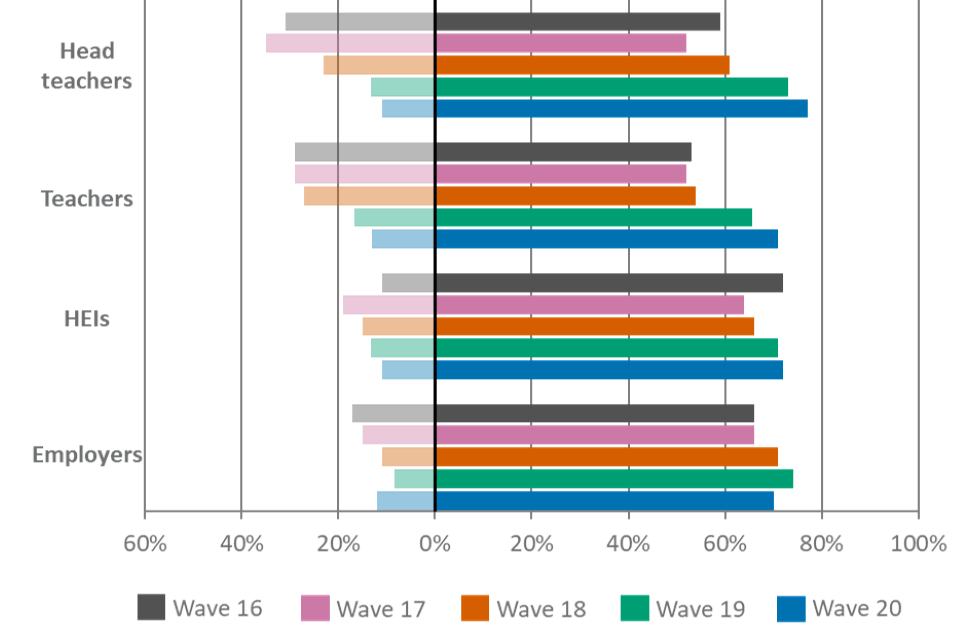
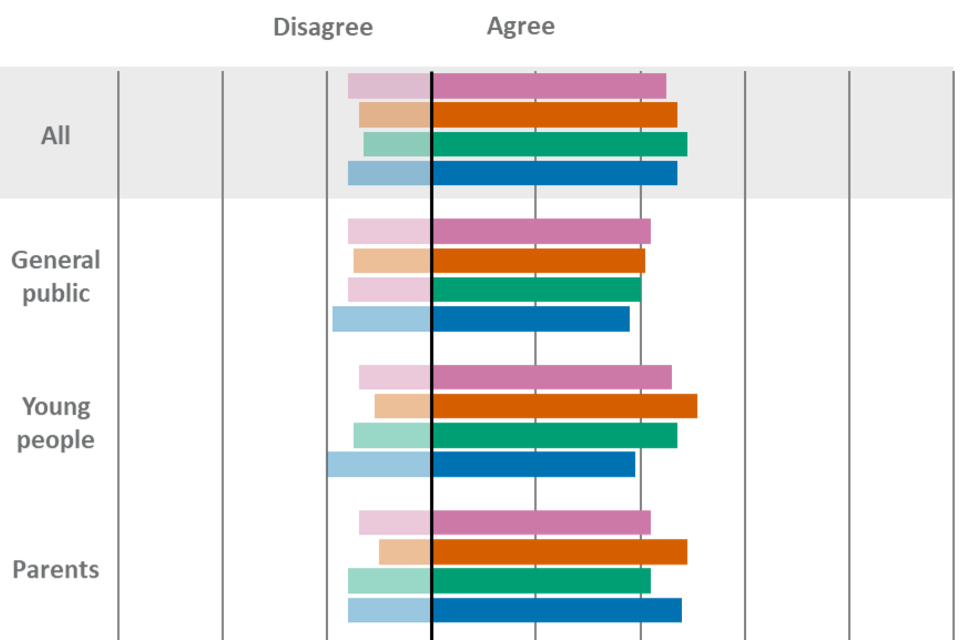
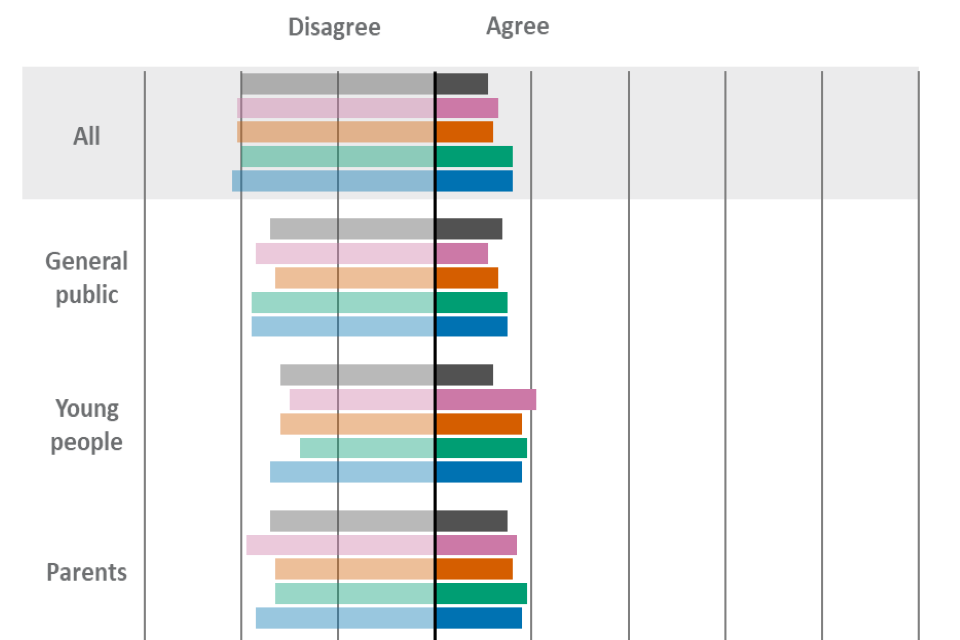
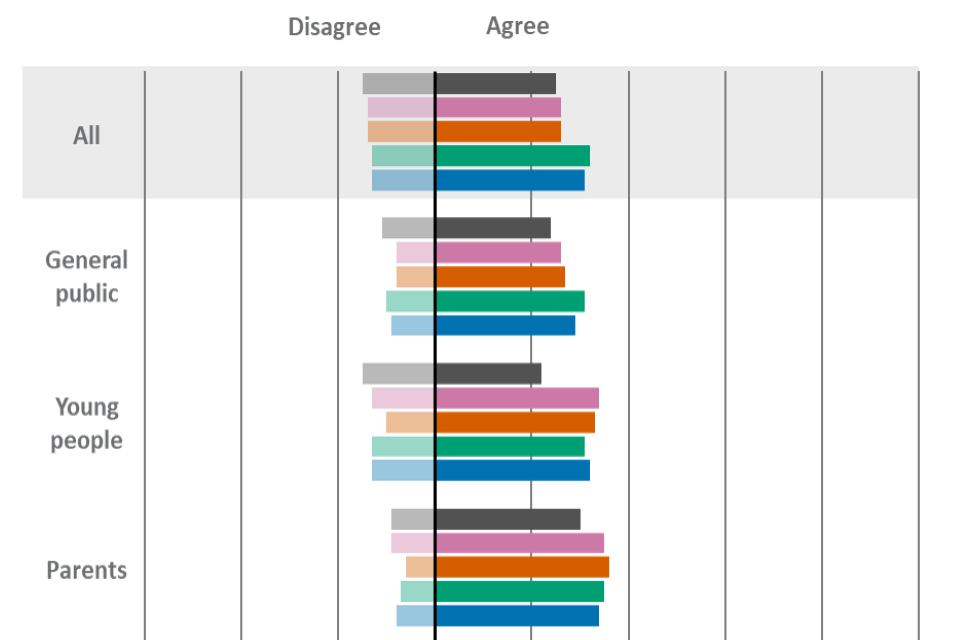
Composite confidence in A levels increased in comparison with wave 19, marking a continual rise occurring since wave 17 (figure 9). Confidence increased among all stakeholder groups apart from employers and HEIs, among whom it remained broadly consistent.
Figure 9. Composite confidence in A levels
Strongly agree = 5, Agree = 4, Neither agree nor disagree = 3, Disagree = 2, Strongly disagree = 1. ‘Don’t know’ responses have been excluded.
| Respondent type | Wave 16 | Wave 17 | Wave 18 | Wave 19 | Wave 20 |
|---|---|---|---|---|---|
| All | 3.54 | 3.52 | 3.55 | 3.59 | 3.70 |
| General public | 3.44 | 3.44 | 3.46 | 3.46 | 3.63 |
| Young people | 3.48 | 3.56 | 3.58 | 3.53 | 3.75 |
| Parents | 3.52 | 3.47 | 3.60 | 3.57 | 3.66 |
| Head teachers | 3.74 | 3.68 | 3.57 | 3.75 | 3.90 |
| Teachers | 3.63 | 3.59 | 3.63 | 3.71 | 3.79 |
| HEIs | 3.46 | 3.46 | 3.39 | 3.53 | 3.54 |
| Employers | 3.49 | 3.44 | 3.59 | 3.55 | 3.59 |
Composite confidence in Applied General qualifications in general
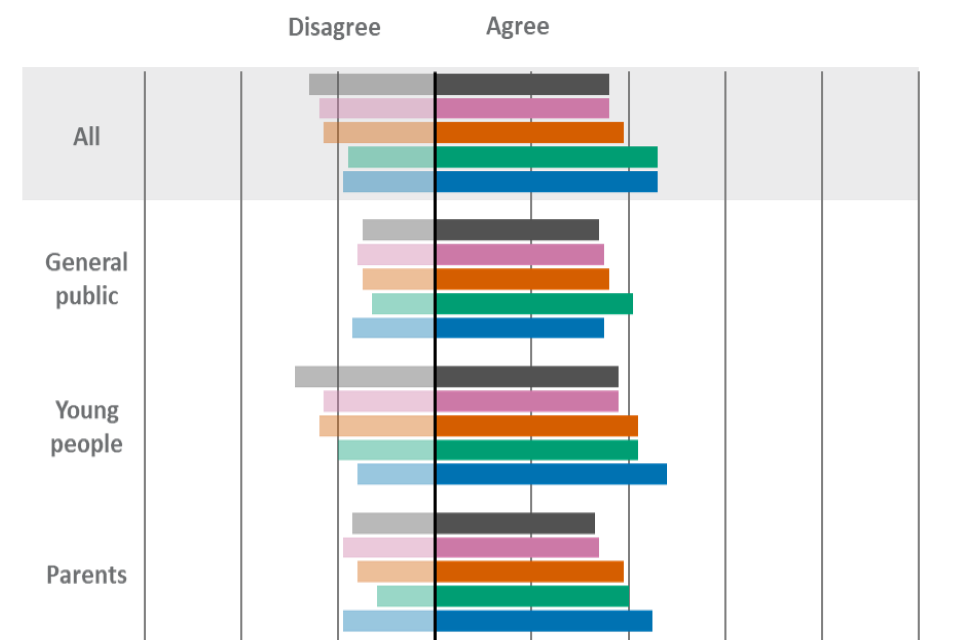
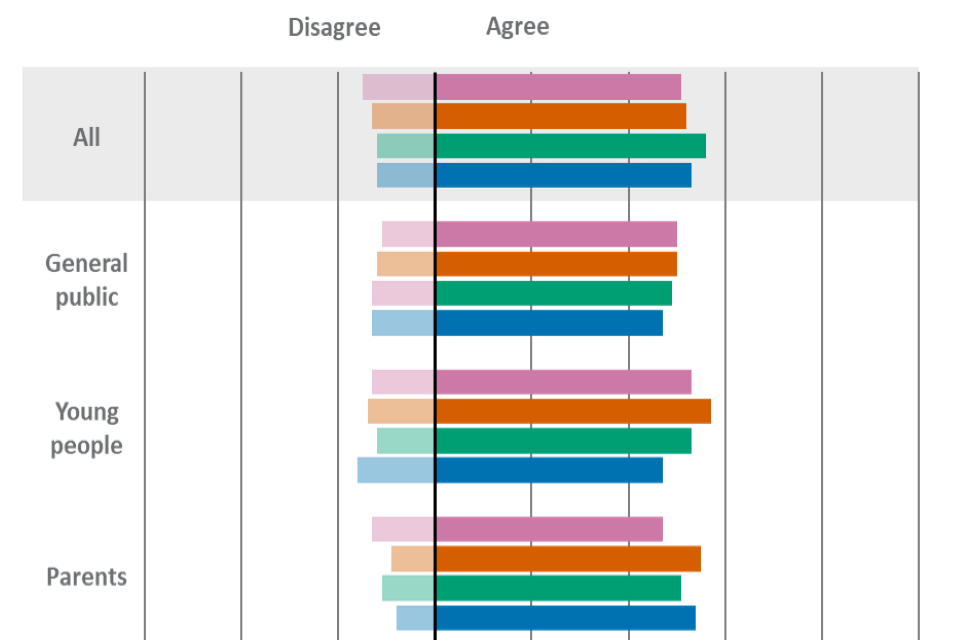
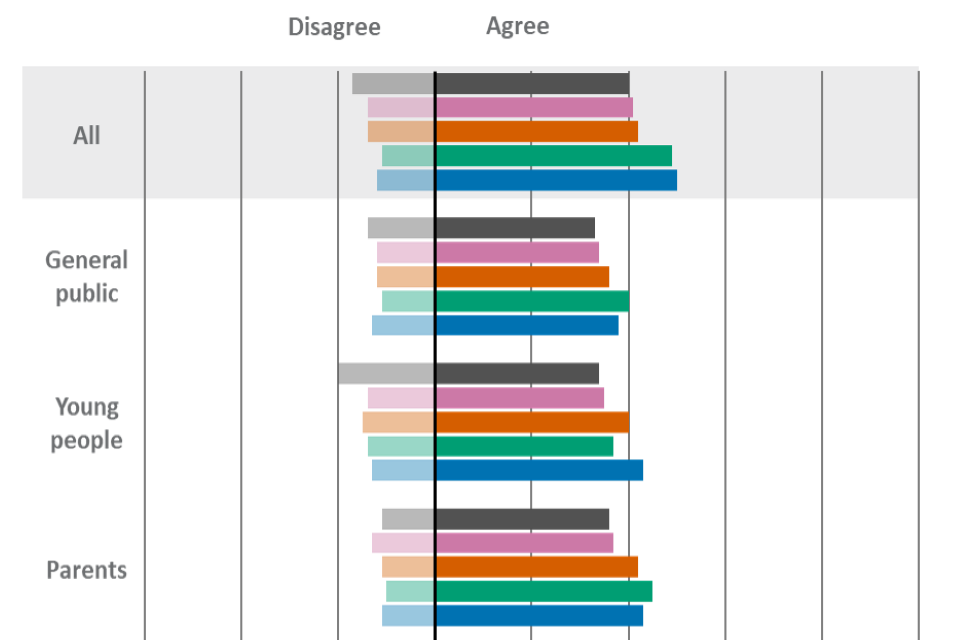
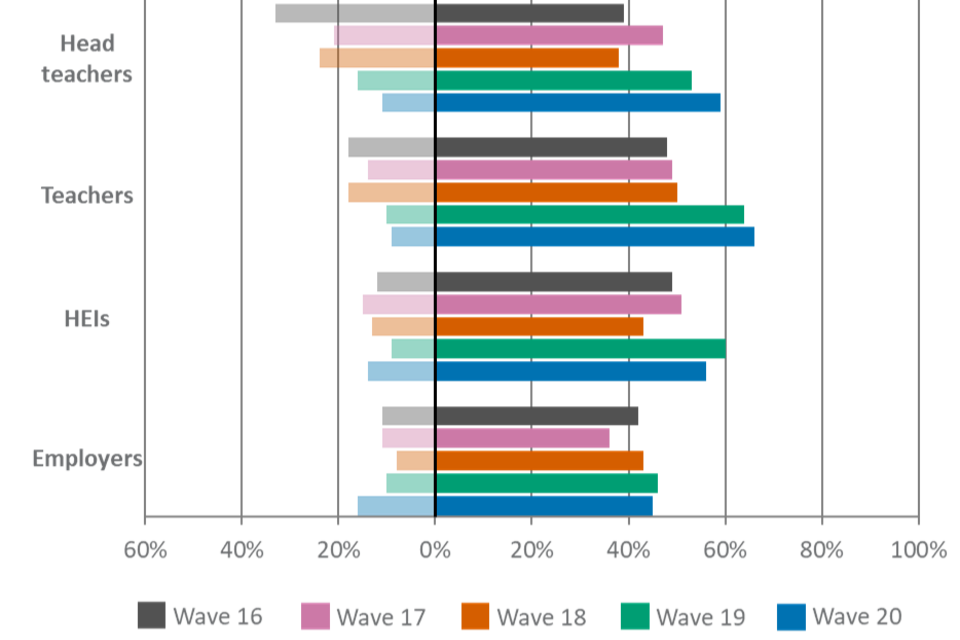
For Figure 10 the wave 20 base is: All responses (N=2,445); Young people (N=237); Parents (N=212); Teachers (N=547); Head teachers (N=227); HEIs (N=205); Employers (N=208); General public (N=809).
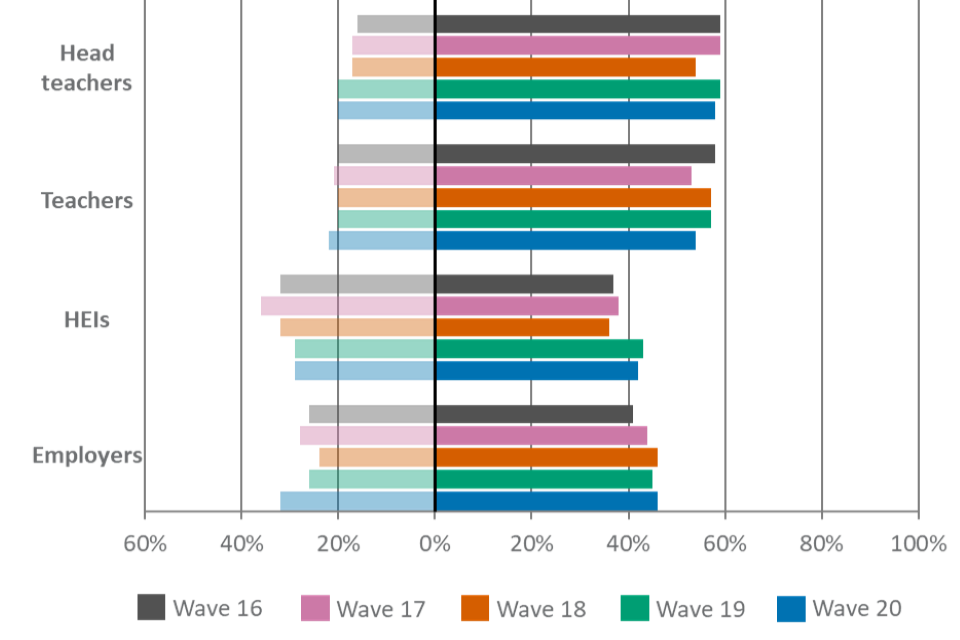
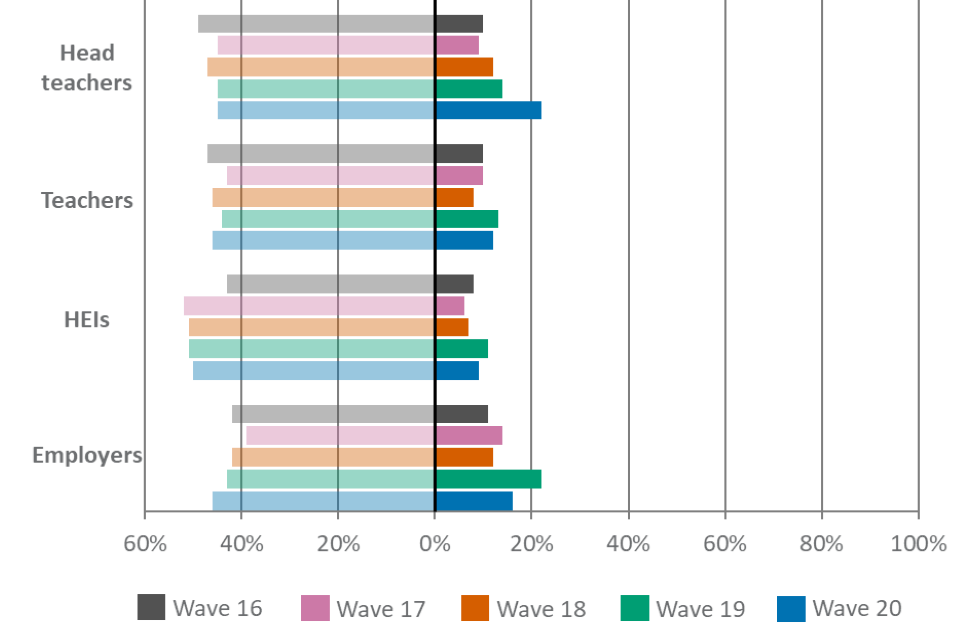
Composite confidence in Applied General qualifications was broadly consistent with wave 19 (figure 10). Equally, there were no statistically significant shifts across any of the stakeholder groups.
Figure 10. Composite confidence in Applied General qualifications
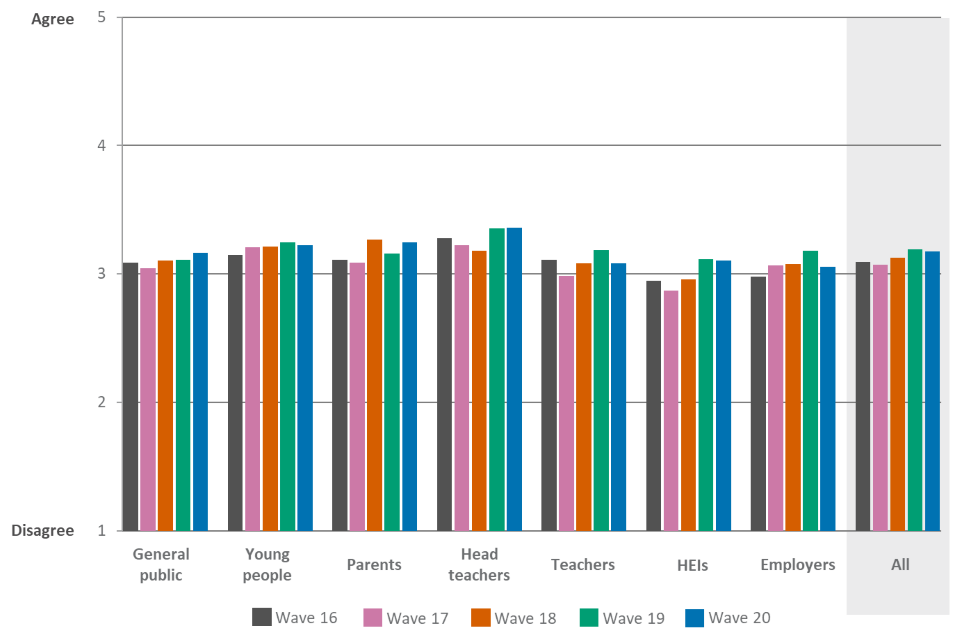
Strongly agree = 5, Agree = 4, Neither agree nor disagree = 3, Disagree = 2, Strongly disagree = 1. ‘Don’t know’ responses have been excluded.
| Respondent type | Wave 16 | Wave 17 | Wave 18 | Wave 19 | Wave 20 |
|---|---|---|---|---|---|
| All | 3.09 | 3.07 | 3.13 | 3.19 | 3.18 |
| General public | 3.09 | 3.04 | 3.10 | 3.11 | 3.16 |
| Young people | 3.15 | 3.21 | 3.21 | 3.24 | 3.22 |
| Parents | 3.11 | 3.09 | 3.27 | 3.16 | 3.25 |
| Head teachers | 3.28 | 3.22 | 3.18 | 3.35 | 3.36 |
| Teachers | 3.11 | 2.99 | 3.08 | 3.18 | 3.08 |
| HEIs | 2.94 | 2.87 | 2.96 | 3.12 | 3.10 |
| Employers | 2.98 | 3.07 | 3.08 | 3.18 | 3.05 |
Section 3: General perceptions of GCSEs
The following section looks at respondents’ general perceptions of GCSEs, as opposed to 2021-specific perceptions. For how this compares to respondents’ perceptions of GCSEs in 2021, please see section 1.
Overall perceptions
For the following 8 survey items the wave 20 effective base was: All responses (N=2106); Students (N=293); Parents (N=251); Teachers (N=576); Head teachers (N=214); HEIs (N=225); Employers (N=250); General public (n=979).
As shown in figure 11, seven in ten (70%) respondents in wave 20 agreed that, in general, ‘GCSEs are well understood by people’. This was broadly consistent with wave 19.
Figure 11 displays that teachers showed an increase in levels of agreement in comparison with wave 19 (71% compared with 66%), marking a continuation of the rising agreement seen in the previous wave. Head teachers also showed gradually increasing levels of agreement over the past three waves (77% compared with 52% in wave 17).
Figure 11. Results for “GCSEs are well understood by people”
Respondents were shown a 5-point agreement scale. Agree is an aggregation of strongly agree and agree and disagree an aggregation of strongly disagree and disagree.
| Respondent type | Wave 16 | Wave 17 | Wave 18 | Wave 19 | Wave 20 |
|---|---|---|---|---|---|
| All – agree | 62% | 59% | 62% | 69% | 70% |
| All – disagree | 20% | 22% | 19% | 13% | 12% |
| General public – agree | 62% | 59% | 61% | 66% | 62% |
| General public – disagree | 13% | 16% | 14% | 12% | 14% |
| Young people – agree | 60% | 61% | 60% | 69% | 72% |
| Young people – disagree | 21% | 22% | 25% | 15% | 10% |
| Parents – agree | 60% | 62% | 63% | 67% | 67% |
| Parents– disagree | 16% | 19% | 16% | 10% | 12% |
| Head teachers – agree | 59% | 52% | 61% | 73% | 77% |
| Head teachers – disagree | 31% | 35% | 23% | 13% | 11% |
| Teachers – agree | 53% | 52% | 54% | 66% | 71% |
| Teachers – disagree | 29% | 29% | 27% | 17% | 13% |
| HEIs – agree | 72% | 64% | 66% | 71% | 72% |
| HEIs – disagree | 11% | 19% | 15% | 13% | 11% |
| Employers – agree | 66% | 66% | 71% | 74% | 70% |
| Employers – disagree | 17% | 15% | 11% | 8% | 12% |
As shown in Figure 12, approximately seven in ten (73%) respondents in wave 20 agreed that, in general, ‘GCSEs are a trusted qualification’. This was roughly consistent with wave 19.
The general public expressed a decrease in levels of agreement that ‘GCSEs are a trusted qualification’ in comparison with wave 19 (66% compared with 73%), making agreement roughly comparable to wave 17.
Figure 12. Results for “GCSEs are a trusted qualification”
Respondents were shown a 5-point agreement scale. Agree is an aggregation of strongly agree and agree and disagree an aggregation of strongly disagree and disagree.
| Respondent type | Wave 16 | Wave 17 | Wave 18 | Wave 19 | Wave 20 |
|---|---|---|---|---|---|
| All – agree | 72% | 71% | 74% | 75% | 73% |
| All – disagree | 10% | 11% | 9% | 9% | 9% |
| General public – agree | 70% | 68% | 70% | 73% | 66% |
| General public – disagree | 9% | 8% | 9% | 7% | 11% |
| Young people – agree | 79% | 76% | 78% | 72% | 74% |
| Young people – disagree | 8% | 11% | 7% | 11% | 7% |
| Parents – agree | 71% | 68% | 74% | 76% | 74% |
| Parents– disagree | 10% | 7% | 9% | 5% | 9% |
| Head teachers – agree | 72% | 72% | 75% | 77% | 82% |
| Head teachers – disagree | 12% | 14% | 11% | 14% | 8% |
| Teachers – agree | 67% | 69% | 74% | 78% | 78% |
| Teachers – disagree | 13% | 13% | 10% | 8% | 8% |
| HEIs – agree | 73% | 72% | 70% | 77% | 71% |
| HEIs – disagree | 10% | 9% | 10% | 8% | 10% |
| Employers – agree | 67% | 69% | 75% | 70% | 67% |
| Employers – disagree | 10% | 13% | 10% | 7% | 12% |
Confidence in standards and marking
Approximately two in five (42%) respondents agreed in wave 20 that, in general, ‘GCSE standards are maintained year-on-year’ (figure 13). This was a decrease in comparison with wave 19 but roughly consistent with waves 16, 17 and 18.
HEIs recorded a decrease in levels of agreement in comparison with wave 19 (55% compared with 39%), which represents an approximate return to wave 18 agreement levels. Among all other groups there were no significant movements (figure 13).
Figure 13. Results for “GCSE standards are maintained year-on-year.”

Respondents were shown a 5-point agreement scale. Agree is an aggregation of strongly agree and agree and disagree an aggregation of strongly disagree and disagree.
| Respondent type | Wave 16 | Wave 17 | Wave 18 | Wave 19 | Wave 20 | |
|---|---|---|---|---|---|---|
| All – agree | 40% | 40% | 41% | 45% | 42% | |
| All – disagree | 29% | 27% | 26% | 22% | 27% | |
| General public – agree | 36% | 38% | 36% | 37% | 34% | |
| General public – disagree | 23% | 21% | 20% | 20% | 28% | |
| Young people – agree | 35% | 37% | 37% | 43% | 39% | |
| Young people – disagree | 34% | 31% | 32% | 22% | 26% | |
| Parents – agree | 41% | 38% | 40% | 43% | 43% | |
| Parents– disagree | 24% | 26% | 22% | 18% | 25% | |
| Head teachers – agree | 44% | 43% | 48% | 49% | 57% | |
| Head teachers – disagree | 38% | 34% | 32% | 29% | 27% | |
| Teachers – agree | 37% | 41% | 46% | 53% | 50% | |
| Teachers – disagree | 34% | 31% | 30% | 24% | 24% | |
| HEIs – agree | 46% | 42% | 42% | 55% | 39% | |
| HEIs – disagree | 21% | 23% | 21% | 18% | 28% | |
| Employers – agree | 39% | 37% | 39% | 38% | 32% | |
| Employers – disagree | 26% | 26% | 26% | 26% | 34% |
As shown in figure 14, overall, just under half (46%) of respondents agreed that, in general, ‘the marking of GCSEs is accurate’. This was in line with wave 19 but an increase in comparison with waves 16, 17 and 18.
Head teachers saw an increase in comparison with wave 18 (54% compared with 31%), continuing on an upward trend observed since wave 16, and this was also the case for teachers (57% in wave 20 compared with 45% in wave 18). In contrast, the general public saw a decline in agreement between wave 19 and wave 20 (41% compared with 35%) (figure 14).
Figure 14. Results for “The marking of GCSEs is accurate.”
Respondents were shown a 5-point agreement scale. Agree is an aggregation of strongly agree and agree and disagree an aggregation of strongly disagree and disagree.
| Respondent type | Wave 16 | Wave 17 | Wave 18 | Wave 19 | Wave 20 |
|---|---|---|---|---|---|
| All – agree | 36% | 36% | 39% | 46% | 46% |
| All – disagree | 26% | 24% | 23% | 18% | 19% |
| General public – agree | 34% | 35% | 36% | 41% | 35% |
| General public – disagree | 15% | 16% | 15% | 13% | 17% |
| Young people – agree | 38% | 38% | 42% | 42% | 48% |
| Young people – disagree | 29% | 23% | 24% | 20% | 16% |
| Parents – agree | 33% | 34% | 39% | 40% | 45% |
| Parents– disagree | 17% | 19% | 16% | 12% | 19% |
| Head teachers – agree | 24% | 31% | 31% | 45% | 54% |
| Head teachers – disagree | 58% | 46% | 47% | 34% | 24% |
| Teachers – agree | 40% | 43% | 45% | 55% | 57% |
| Teachers – disagree | 31% | 27% | 28% | 22% | 18% |
| HEIs – agree | 43% | 39% | 39% | 57% | 51% |
| HEIs – disagree | 13% | 16% | 14% | 9% | 15% |
| Employers – agree | 41% | 32% | 38% | 43% | 35% |
| Employers – disagree | 15% | 18% | 14% | 13% | 23% |
Skills and preparation
Figure 15 shows that seven in ten (70%) respondents agreed that, in general, ‘GCSEs are good preparation for further study’. This represented a decrease in comparison with wave 19.
Among the individual stakeholder groups surveyed, there were no statistically significant differences wave on wave (figure 15).
Figure 15. Results for “GCSEs are good preparation for further study.”


Respondents were shown a 5-point agreement scale. Agree is an aggregation of strongly agree and agree and disagree an aggregation of strongly disagree and disagree.
| Respondent type | Wave 16 | Wave 17 | Wave 18 | Wave 19 | Wave 20 |
|---|---|---|---|---|---|
| All – agree | 70% | 69% | 72% | 73% | 70% |
| All – disagree | 13% | 13% | 13% | 12% | 13% |
| General public – agree | 69% | 70% | 71% | 73% | 69% |
| General public – disagree | 11% | 10% | 10% | 11% | 12% |
| Young people – agree | 64% | 69% | 69% | 68% | 63% |
| Young people – disagree | 16% | 16% | 19% | 16% | 19% |
| Parents – agree | 77% | 75% | 77% | 81% | 79% |
| Parents– disagree | 5% | 6% | 7% | 5% | 6% |
| Head teachers – agree | 76% | 71% | 78% | 77% | 77% |
| Head teachers – disagree | 12% | 14% | 13% | 13% | 10% |
| Teachers – agree | 66% | 68% | 70% | 70% | 68% |
| Teachers – disagree | 16% | 16% | 16% | 15% | 16% |
| HEIs – agree | 64% | 60% | 64% | 68% | 64% |
| HEIs – disagree | 15% | 17% | 20% | 16% | 18% |
| Employers – agree | 72% | 69% | 76% | 75% | 69% |
| Employers – disagree | 12% | 11% | 9% | 10% | 10% |
Approximately a third (35%) of respondents agreed that, in general, ‘GCSEs are good preparation for work’. This was consistent with each of the previous four waves (figure 16). Agreement among each individual stakeholder group also remained broadly consistent, with no significant differences in comparison with wave 19.
Figure 16. Results for “GSCEs are good preparation for work.”


Respondents were shown a 5-point agreement scale. Agree is an aggregation of strongly agree and agree and disagree an aggregation of strongly disagree and disagree.
| Respondent type | Wave 16 | Wave 17 | Wave 18 | Wave 19 | Wave 20 |
|---|---|---|---|---|---|
| All – agree | 35% | 34% | 34% | 35% | 35% |
| All – disagree | 37% | 36% | 37% | 37% | 36% |
| General public – agree | 36% | 37% | 37% | 36% | 37% |
| General public – disagree | 36% | 34% | 33% | 35% | 36% |
| Young people – agree | 28% | 33% | 33% | 29% | 29% |
| Young people – disagree | 50% | 39% | 44% | 45% | 45% |
| Parents – agree | 38% | 37% | 36% | 38% | 46% |
| Parents– disagree | 32% | 31% | 31% | 34% | 29% |
| Head teachers – agree | 42% | 31% | 31% | 32% | 33% |
| Head teachers – disagree | 36% | 38% | 38% | 37% | 37% |
| Teachers – agree | 33% | 34% | 31% | 33% | 33% |
| Teachers – disagree | 39% | 37% | 42% | 39% | 38% |
| HEIs – agree | 35% | 31% | 32% | 39% | 30% |
| HEIs – disagree | 29% | 32% | 38% | 33% | 33% |
| Employers – agree | 33% | 33% | 38% | 36% | 35% |
| Employers – disagree | 39% | 41% | 36% | 36% | 34% |
Overall, perceptions that, in general, ‘GCSEs develop a broad range of skills for students’ were consistent with wave 19 as well as with the previous three waves, with approximately six in ten (59%) respondents agreeing (figure 17).
Among parents, agreement levels increased in wave 20 in comparison with wave 19 (68% compared with 60%). For all other stakeholder groups, levels of agreement remained relatively consistent with wave 19.
Figure 17. Results for “GCSEs develop a broad range of skills for students.”

Respondents were shown a 5-point agreement scale. Agree is an aggregation of strongly agree and agree and disagree an aggregation of strongly disagree and disagree.
| Respondent type | Wave 16 | Wave 17 | Wave 18 | Wave 19 | Wave 20 |
|---|---|---|---|---|---|
| All – agree | 57% | 57% | 58% | 58% | 59% |
| All – disagree | 20% | 21% | 21% | 20% | 20% |
| General public – agree | 57% | 57% | 58% | 58% | 56% |
| General public – disagree | 16% | 17% | 17% | 16% | 19% |
| Young people – agree | 56% | 61% | 61% | 53% | 58% |
| Young people – disagree | 23% | 20% | 24% | 24% | 26% |
| Parents – agree | 62% | 59% | 62% | 60% | 68% |
| Parents– disagree | 12% | 16% | 16% | 15% | 13% |
| Head teachers – agree | 59% | 51% | 56% | 56% | 58% |
| Head teachers – disagree | 23% | 28% | 25% | 27% | 23% |
| Teachers – agree | 54% | 54% | 51% | 56% | 57% |
| Teachers – disagree | 24% | 25% | 29% | 25% | 24% |
| HEIs – agree | 53% | 58% | 52% | 58% | 61% |
| HEIs – disagree | 23% | 19% | 22% | 21% | 16% |
| Employers – agree | 59% | 57% | 66% | 64% | 57% |
| Employers – disagree | 19% | 22% | 17% | 12% | 18% |
Value for money
In wave 20, approximately half (53%) of respondents agreed that ‘GCSEs offer value for money’, largely consistent with wave 19.
Among each of the stakeholder groups, levels of agreement were broadly consistent with wave 19.
Figure 18. Results for “GCSEs offer ‘value for money’.”
Respondents were shown a 5-point agreement scale. Agree is an aggregation of strongly agree and agree and disagree an aggregation of strongly disagree and disagree.
| Respondent type | Wave 17 | Wave 18 | Wave 19 | Wave 20 |
|---|---|---|---|---|
| All – agree | 51% | 52% | 56% | 53% |
| All – disagree | 15% | 13% | 12% | 12% |
| General public – agree | 50% | 50% | 49% | 47% |
| General public – disagree | 11% | 12% | 13% | 13% |
| Young people – agree | 53% | 57% | 53% | 47% |
| Young people – disagree | 13% | 14% | 12% | 16% |
| Parents – agree | 47% | 55% | 51% | 54% |
| Parents– disagree | 13% | 9% | 11% | 8% |
| Head teachers – agree | 48% | 48% | 59% | 57% |
| Head teachers – disagree | 23% | 23% | 18% | 19% |
| Teachers – agree | 52% | 55% | 59% | 58% |
| Teachers – disagree | 17% | 16% | 13% | 12% |
| HEIs – agree | 51% | 46% | 61% | 53% |
| HEIs – disagree | 13% | 10% | 9% | 8% |
| Employers – agree | 55% | 57% | 59% | 57% |
| Employers – disagree | 16% | 8% | 7% | 9% |
Section 4: General perceptions of A levels
The following section looks at respondents’ general perceptions of A levels, as opposed to 2021-specific perceptions. For how this compares to respondents’ perceptions of A levels in 2021, please see section 1. To account for changes made to the A level qualification system over recent years, in wave 20, the question text changed to remove reference to AS levels.
Overall perceptions
For the following 8 survey items the wave 20 effective base was: All responses (N=2,106); Young people (N=293); Parents (N=251); Teachers (N=576); Head teachers (N=214); HEIs (N=225); Employers (N=250); General public (N=979).
Approximately seven in ten (69%) respondents in wave 20 agreed that, in general, ‘A levels are well understood by people’, an increase in comparison with all previous waves shown (figure 19).
This increase from wave 19 was evident across all stakeholder groups, with the exception of HEIs, who remained stable (70% in wave 19 and 20). Headteachers reported the highest levels of agreement that ‘A levels are well understood by people’ (85% compared with 78% in wave 19), followed by teachers (76% compared with 68%), employers (74% compared with 66%), parents (63% compared with 57%), young people (62% compared with 51%) and the general public (56% compared with 51%).
Figure 19. Results for “A levels are well understood by people”
Respondents were shown a 5-point agreement scale. Agree is an aggregation of strongly agree and agree and disagree an aggregation of strongly disagree and disagree. In wave 20, the question text changed to remove reference to AS levels.
| Respondent type | Wave 16 | Wave 17 | Wave 18 | Wave 19 | Wave 20 | |
|---|---|---|---|---|---|---|
| All – agree | 59% | 59% | 59% | 63% | 69% | |
| All – disagree | 17% | 18% | 17% | 13% | 11% | |
| General public – agree | 47% | 45% | 46% | 51% | 56% | |
| General public – disagree | 21% | 23% | 21% | 17% | 15% | |
| Young people – agree | 48% | 55% | 53% | 51% | 62% | |
| Young people – disagree | 22% | 18% | 19% | 17% | 14% | |
| Parents – agree | 50% | 52% | 57% | 57% | 63% | |
| Parents– disagree | 22% | 23% | 16% | 12% | 15% | |
| Head teachers – agree | 75% | 72% | 67% | 78% | 85% | |
| Head teachers – disagree | 10% | 11% | 12% | 6% | 3% | |
| Teachers – agree | 64% | 62% | 64% | 68% | 75% | |
| Teachers – disagree | 17% | 16% | 17% | 11% | 8% | |
| HEIs – agree | 71% | 70% | 62% | 70% | 70% | |
| HEIs – disagree | 13% | 14% | 16% | 13% | 14% | |
| Employers – agree | 58% | 56% | 64% | 66% | 74% | |
| Employers – disagree | 16% | 20% | 16% | 14% | 8% |
Approximately eight in ten (83%) respondents believed that, in general, ‘A levels are trusted qualifications’ in wave 20, consistent with recent waves (figure 20).
All stakeholders’ levels of agreement were comparable with the previous wave. Head teachers showed the highest agreement levels (92%).
Figure 20. Results for “A levels are trusted qualifications.”


Respondents were shown a 5-point agreement scale. Agree is an aggregation of strongly agree and agree and disagree an aggregation of strongly disagree and disagree.
In wave 20, the question text changed to remove reference to AS levels.
| Respondent type | Wave 16 | Wave 17 | Wave 18 | Wave 19 | Wave 20 |
|---|---|---|---|---|---|
| All – agree | 81% | 81% | 82% | 82% | 83% |
| All – disagree | 4% | 4% | 3% | 3% | 5% |
| General public – agree | 74% | 72% | 73% | 76% | 74% |
| General public – disagree | 6% | 5% | 4% | 5% | 6% |
| Young people – agree | 83% | 83% | 86% | 80% | 81% |
| Young people – disagree | 2% | 3% | 3% | 3% | 5% |
| Parents – agree | 79% | 79% | 82% | 82% | 82% |
| Parents– disagree | 6% | 4% | 2% | 3% | 4% |
| Head teachers – agree | 87% | 89% | 82% | 88% | 92% |
| Head teachers – disagree | 1% | 2% | 1% | 2% | 2% |
| Teachers – agree | 87% | 87% | 89% | 89% | 90% |
| Teachers – disagree | 2% | 3% | 2% | 2% | 1% |
| HEIs – agree | 81% | 79% | 79% | 84% | 81% |
| HEIs – disagree | 6% | 7% | 7% | 5% | 7% |
| Employers – agree | 77% | 75% | 82% | 78% | 82% |
| Employers – disagree | 5% | 6% | 5% | 4% | 7% |
Confidence in standards and marking
Less than half (45%) of respondents in wave 20 agreed that, in general, ‘A level standards are maintained year-on-year’ (figure 21). This represented a decline compared with wave 19 (50%) after a long period of consistency.
This decline in agreement was the result of marginal decreases among most stakeholder groups, as well as statistically significant decreases among the general public (38% in wave 19 and 33% in wave 20) and HEIs (55% in wave 19 and 41% in wave 20).
Figure 21. Results for “A level standards are maintained year-on-year.”


Respondents were shown a 5-point agreement scale. Agree is an aggregation of strongly agree and agree and disagree an aggregation of strongly disagree and disagree.
In wave 20, the question text changed to remove reference to AS levels.
| Respondent type | Wave 16 | Wave 17 | Wave 18 | Wave 19 | Wave 20 |
|---|---|---|---|---|---|
| All – agree | 49% | 49% | 49% | 50% | 45% |
| All – disagree | 18% | 16% | 17% | 16% | 22% |
| General public – agree | 37% | 41% | 38% | 38% | 33% |
| General public – disagree | 20% | 16% | 16% | 18% | 26% |
| Young people – agree | 38% | 41% | 40% | 44% | 39% |
| Young people – disagree | 18% | 14% | 18% | 15% | 20% |
| Parents – agree | 48% | 41% | 46% | 44% | 47% |
| Parents– disagree | 15% | 16% | 14% | 13% | 19% |
| Head teachers – agree | 66% | 69% | 60% | 66% | 60% |
| Head teachers – disagree | 13% | 9% | 13% | 12% | 15% |
| Teachers – agree | 57% | 56% | 61% | 64% | 60% |
| Teachers – disagree | 18% | 14% | 13% | 11% | 16% |
| HEIs – agree | 51% | 50% | 50% | 55% | 41% |
| HEIs – disagree | 17% | 23% | 24% | 20% | 31% |
| Employers – agree | 44% | 41% | 45% | 42% | 34% |
| Employers – disagree | 23% | 19% | 20% | 22% | 26% |
In wave 20, half of respondents (50%) believed that, in general, ‘the marking of A levels is accurate’. This maintained wave 19’s agreement levels (figure 22).
In wave 20, two thirds (66%) of teachers and six in ten headteachers (59%) agreed, which represented an increase compared with waves 16, 17 and 18.
Figure 22. Results for “The marking of A levels is accurate.”
Respondents were shown a 5-point agreement scale. Agree is an aggregation of strongly agree and agree and disagree an aggregation of strongly disagree and disagree.
In wave 20, the question text changed to remove reference to AS levels.
| Respondent type | Wave 16 | Wave 17 | Wave 18 | Wave 19 | Wave 20 |
|---|---|---|---|---|---|
| All – agree | 40% | 41% | 42% | 49% | 50% |
| All – disagree | 17% | 14% | 14% | 11% | 12% |
| General public – agree | 33% | 34% | 36% | 40% | 38% |
| General public – disagree | 14% | 12% | 12% | 11% | 13% |
| Young people – agree | 34% | 35% | 40% | 37% | 43% |
| Young people – disagree | 20% | 14% | 15% | 14% | 13% |
| Parents – agree | 36% | 37% | 42% | 45% | 43% |
| Parents– disagree | 11% | 13% | 11% | 10% | 11% |
| Head teachers – agree | 39% | 47% | 38% | 53% | 59% |
| Head teachers – disagree | 33% | 21% | 24% | 16% | 11% |
| Teachers – agree | 48% | 49% | 50% | 64% | 66% |
| Teachers – disagree | 18% | 14% | 18% | 10% | 9% |
| HEIs – agree | 49% | 51% | 43% | 60% | 56% |
| HEIs – disagree | 12% | 15% | 13% | 9% | 14% |
| Employers – agree | 42% | 36% | 43% | 46% | 45% |
| Employers – disagree | 11% | 11% | 8% | 10% | 16% |
Skills and preparation
Overall, approximately eight in ten (81%) respondents agreed in wave 20 that, in general, ‘A levels are good preparation for further study’, consistent with recent waves, although an increase in comparison with wave 17.
Parents showed an increase in agreement compared with wave 17 (85% compared with 78%). Agreement among the general public sat at just over three quarters (77%), an increase on wave 16 (73%).
Figure 23. Results for “A levels are good preparation for further study.”


Respondents were shown a 5-point agreement scale. Agree is an aggregation of strongly agree and agree and disagree an aggregation of strongly disagree and disagree.
In wave 20, the question text changed to remove reference to AS levels.
| Respondent type | Wave 16 | Wave 17 | Wave 18 | Wave 19 | Wave 20 | |
|---|---|---|---|---|---|---|
| All – agree | 79% | 77% | 78% | 79% | 81% | |
| All – disagree | 8% | 7% | 6% | 7% | 7% | |
| General public – agree | 73% | 74% | 76% | 78% | 77% | |
| General public – disagree | 6% | 5% | 5% | 5% | 6% | |
| Young people – agree | 77% | 78% | 79% | 74% | 75% | |
| Young people – disagree | 8% | 7% | 5% | 5% | 8% | |
| Parents – agree | 82% | 78% | 84% | 82% | 85% | |
| Parents– disagree | 5% | 5% | 3% | 3% | 5% | |
| Head teachers – agree | 87% | 83% | 82% | 86% | 88% | |
| Head teachers – disagree | 4% | 4% | 3% | 4% | 3% | |
| Teachers – agree | 85% | 84% | 85% | 85% | 87% | |
| Teachers – disagree | 4% | 3% | 4% | 5% | 3% | |
| HEIs – agree | 67% | 65% | 62% | 66% | 70% | |
| HEIs – disagree | 20% | 21% | 21% | 20% | 16% | |
| Employers – agree | 80% | 80% | 81% | 81% | 83% | |
| Employers – disagree | 7% | 7% | 3% | 5% | 6% |
The perception that, in general, ‘A levels are good preparation for work’ remained largely consistent with recent waves, with just under four in ten (39%) agreeing (figure 24).
There were no significant changes wave-on-wave by stakeholder group.
Figure 24. Results for “A levels are good preparation for work.”
Respondents were shown a 5-point agreement scale. Agree is an aggregation of strongly agree and agree and disagree an aggregation of strongly disagree and disagree.
In wave 20, the question text changed to remove reference to AS levels.
| Respondent type | Wave 16 | Wave 17 | Wave 18 | Wave 19 | Wave 20 |
|---|---|---|---|---|---|
| All – agree | 37% | 37% | 37% | 36% | 39% |
| All – disagree | 30% | 30% | 29% | 29% | 30% |
| General public – agree | 34% | 35% | 36% | 33% | 35% |
| General public – disagree | 31% | 30% | 29% | 33% | 32% |
| Young people – agree | 34% | 40% | 42% | 37% | 41% |
| Young people – disagree | 35% | 30% | 31% | 29% | 35% |
| Parents – agree | 38% | 37% | 40% | 42% | 41% |
| Parents– disagree | 32% | 28% | 24% | 23% | 29% |
| Head teachers – agree | 46% | 41% | 41% | 39% | 43% |
| Head teachers – disagree | 22% | 23% | 22% | 22% | 21% |
| Teachers – agree | 39% | 39% | 38% | 39% | 39% |
| Teachers – disagree | 29% | 25% | 29% | 28% | 28% |
| HEIs – agree | 33% | 31% | 26% | 28% | 30% |
| HEIs – disagree | 31% | 33% | 36% | 33% | 32% |
| Employers – agree | 35% | 34% | 40% | 36% | 41% |
| Employers – disagree | 34% | 38% | 30% | 32% | 34% |
In wave 20, approximately half (49%) of respondents believed that, in general, ‘A levels develop a broad range of skills for students’ (figure 25). This was broadly consistent with each of the previous four waves.
There were no significant changes wave-on-wave by stakeholder group.
Figure 25. Results for “A levels develop a broad range of skills for students.”

Respondents were shown a 5-point agreement scale. Agree is an aggregation of strongly agree and agree and disagree an aggregation of strongly disagree and disagree.
In wave 20, the question text changed to remove reference to AS levels.
| Respondent type | Wave 16 | Wave 17 | Wave 18 | Wave 19 | Wave 20 |
|---|---|---|---|---|---|
| All – agree | 49% | 49% | 49% | 51% | 49% |
| All – disagree | 22% | 23% | 22% | 22% | 25% |
| General public – agree | 46% | 47% | 45% | 47% | 47% |
| General public – disagree | 19% | 18% | 21% | 21% | 24% |
| Young people – agree | 49% | 53% | 51% | 50% | 48% |
| Young people – disagree | 21% | 18% | 25% | 19% | 25% |
| Parents – agree | 52% | 48% | 53% | 53% | 51% |
| Parents– disagree | 19% | 22% | 16% | 17% | 22% |
| Head teachers – agree | 59% | 59% | 54% | 59% | 58% |
| Head teachers – disagree | 16% | 17% | 17% | 20% | 20% |
| Teachers – agree | 58% | 53% | 57% | 57% | 54% |
| Teachers – disagree | 20% | 21% | 20% | 20% | 22% |
| HEIs – agree | 37% | 38% | 36% | 43% | 42% |
| HEIs – disagree | 32% | 36% | 32% | 29% | 29% |
| Employers – agree | 41% | 44% | 46% | 45% | 46% |
| Employers – disagree | 26% | 28% | 24% | 26% | 32% |
Value for money
Overall, just under half (47%) of respondents agreed in wave 20 that, in general, ‘A levels offer value for money’ (figure 26). This was roughly consistent with previous waves.
There were no significant changes wave-on-wave for most stakeholder groups, however, agreement among young people declined between wave 19 and wave 20 (47% compared with 39%).
Figure 26. Results for “A levels offer ‘value for money’.”
Respondents were shown a 5-point agreement scale. Agree is an aggregation of strongly agree and agree and disagree an aggregation of strongly disagree and disagree.
Note: This survey item was included for the first time in wave 17. In wave 20, the question text changed to remove reference to AS levels. The question wording was also updated to reflect the published fees and the later rebate given in light of exam cancellation.
| Respondent type | Wave 17 | Wave 18 | Wave 19 | Wave 20 |
|---|---|---|---|---|
| All – agree | 45% | 47% | 49% | 47% |
| All – disagree | 16% | 14% | 13% | 16% |
| General public – agree | 42% | 41% | 40% | 38% |
| General public – disagree | 16% | 15% | 16% | 19% |
| Young people – agree | 46% | 51% | 47% | 39% |
| Young people – disagree | 14% | 11% | 15% | 20% |
| Parents – agree | 42% | 49% | 42% | 48% |
| Parents– disagree | 14% | 10% | 16% | 16% |
| Head teachers – agree | 42% | 40% | 51% | 47% |
| Head teachers – disagree | 20% | 24% | 15% | 14% |
| Teachers – agree | 47% | 50% | 52% | 51% |
| Teachers – disagree | 19% | 16% | 15% | 16% |
| HEIs – agree | 50% | 44% | 58% | 51% |
| HEIs – disagree | 14% | 12% | 8% | 10% |
| Employers – agree | 47% | 54% | 56% | 54% |
| Employers – disagree | 17% | 11% | 10% | 15% |
Section 5: General perceptions of Applied General qualifications
The following section looks at respondents’ general perceptions of Applied General qualifications, as opposed to 2021-specific perceptions. For how this compares to respondents’ perceptions of Applied General qualifications in 2021, please see section 1.
Overall perceptions
For the following 8 survey items the wave 20 effective base was: All responses (N=2,106); Young people (N=293); Parents (N=251); Teachers (N=576); Head teachers (N=214); HEIs (N=225); Employers (N=250); General public (N=979).
Overall, 16% of respondents in wave 20 agreed that, in general, ‘Applied General qualifications are well understood by people’ (figure 27). This was consistent with wave 19.
Most stakeholder groups’ agreement remained in line with previous waves, with the exception of head teachers whose agreement increased from 14% in wave 19 to 22% in wave 20.
Figure 27. Results for “Applied General qualifications are well understood by people.”
Respondents were shown a 5-point agreement scale. Agree is an aggregation of strongly agree and agree and disagree an aggregation of strongly disagree and disagree.
| Respondent type | Wave 16 | Wave 17 | Wave 18 | Wave 19 | Wave 20 |
|---|---|---|---|---|---|
| All – agree | 11% | 13% | 12% | 16% | 16% |
| All – disagree | 40% | 41% | 41% | 40% | 42% |
| General public – agree | 14% | 11% | 13% | 15% | 15% |
| General public – disagree | 34% | 37% | 33% | 38% | 38% |
| Young people – agree | 12% | 21% | 18% | 19% | 18% |
| Young people – disagree | 32% | 30% | 32% | 28% | 34% |
| Parents – agree | 15% | 17% | 16% | 19% | 18% |
| Parents– disagree | 34% | 39% | 33% | 33% | 37% |
| Head teachers – agree | 10% | 9% | 12% | 14% | 22% |
| Head teachers – disagree | 49% | 45% | 47% | 45% | 45% |
| Teachers – agree | 10% | 10% | 8% | 13% | 12% |
| Teachers – disagree | 47% | 43% | 46% | 44% | 46% |
| HEIs – agree | 8% | 6% | 7% | 11% | 9% |
| HEIs – disagree | 43% | 52% | 51% | 51% | 50% |
| Employers – agree | 11% | 14% | 12% | 22% | 16% |
| Employers – disagree | 42% | 39% | 42% | 43% | 46% |
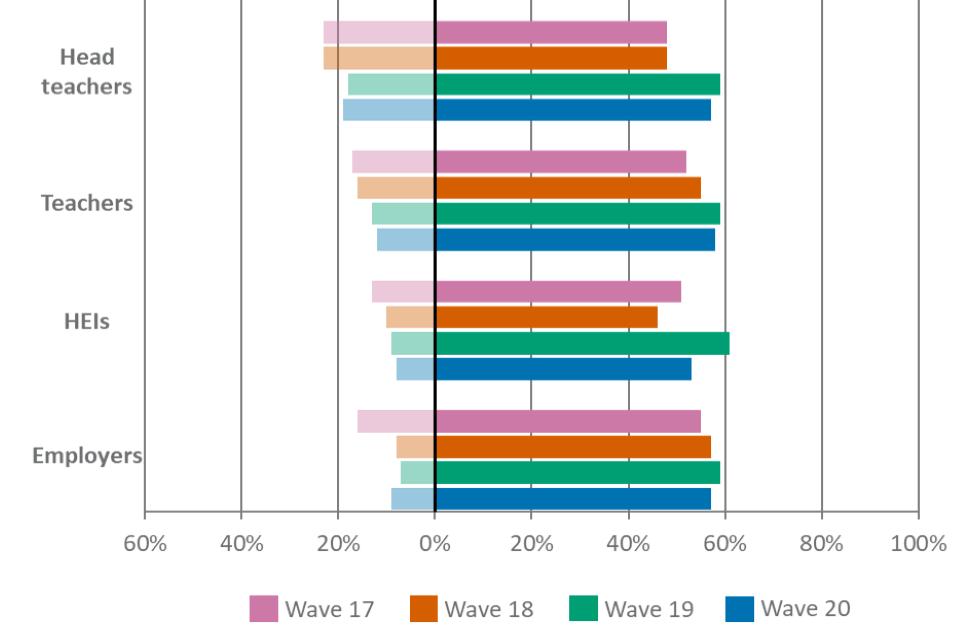
Approximately three in ten (31%) respondents in wave 20 agreed that, in general, ‘Applied General qualifications are trusted qualifications’ (figure 28). This was in line with wave 19 but represented an increase in comparison with wave 18 (26%).
Head teachers, teachers and employers maintained the increased agreement levels initially recorded in wave 19. HEIs were more likely to agree in comparison with wave 18 (34% compared with 21%), marking a continuing trend of increasing levels of agreement starting from wave 17.
Figure 28. Results for “Applied General qualifications are trusted qualifications.”
Respondents were shown a 5-point agreement scale. Agree is an aggregation of strongly agree and agree and disagree an aggregation of strongly disagree and disagree.
| Respondent type | Wave 16 | Wave 17 | Wave 18 | Wave 19 | Wave 20 | |
|---|---|---|---|---|---|---|
| All – agree | 25% | 26% | 26% | 32% | 31% | |
| All – disagree | 15% | 14% | 14% | 13% | 13% | |
| General public – agree | 24% | 26% | 27% | 31% | 29% | |
| General public – disagree | 11% | 8% | 8% | 10% | 9% | |
| Young people – agree | 22% | 34% | 33% | 31% | 32% | |
| Young people – disagree | 15% | 13% | 10% | 13% | 13% | |
| Parents – agree | 30% | 35% | 36% | 35% | 34% | |
| Parents– disagree | 9% | 9% | 6% | 7% | 8% | |
| Head teachers – agree | 27% | 24% | 24% | 36% | 36% | |
| Head teachers – disagree | 19% | 19% | 20% | 18% | 17% | |
| Teachers – agree | 24% | 22% | 20% | 29% | 26% | |
| Teachers – disagree | 19% | 18% | 21% | 16% | 18% | |
| HEIs – agree | 21% | 15% | 21% | 32% | 34% | |
| HEIs – disagree | 18% | 23% | 19% | 18% | 14% | |
| Employers – agree | 25% | 25% | 24% | 31% | 28% | |
| Employers – disagree | 11% | 11% | 13% | 12% | 15% |
Confidence in standards and marking
Approximately a quarter (27%) of respondents agreed that, in general, ‘Applied General qualifications standards are maintained year-on-year’ (figure 29). This was in line with wave 19.
Most stakeholder groups’ agreement levels remained consistent. However, employers’ agreement declined between wave 19 and wave 20 (29% compared with 21%), and head teachers’ agreement increased in comparison with wave 18 (31% compared with 44%), representing steady increasing trend over time.
Figure 29. Results for “Applied General qualifications standards are maintained year-on-year.”
Respondents were shown a 5-point agreement scale. Agree is an aggregation of strongly agree and agree and disagree an aggregation of strongly disagree and disagree.
| Respondent type | Wave 16 | Wave 17 | Wave 18 | Wave 19 | Wave 20 |
|---|---|---|---|---|---|
| All – agree | 21% | 20% | 24% | 28% | 27% |
| All – disagree | 6% | 6% | 6% | 6% | 6% |
| General public – agree | 18% | 18% | 17% | 21% | 22% |
| General public – disagree | 5% | 5% | 4% | 6% | 6% |
| Young people – agree | 15% | 23% | 27% | 23% | 21% |
| Young people – disagree | 6% | 6% | 5% | 6% | 5% |
| Parents – agree | 20% | 17% | 28% | 24% | 26% |
| Parents– disagree | 3% | 4% | 3% | 4% | 4% |
| Head teachers – agree | 29% | 25% | 31% | 39% | 44% |
| Head teachers – disagree | 8% | 8% | 8% | 7% | 7% |
| Teachers – agree | 24% | 21% | 25% | 28% | 26% |
| Teachers – disagree | 7% | 7% | 6% | 5% | 8% |
| HEIs – agree | 23% | 16% | 19% | 28% | 27% |
| HEIs – disagree | 7% | 10% | 9% | 7% | 9% |
| Employers – agree | 18% | 17% | 20% | 29% | 21% |
| Employers – disagree | 4% | 4% | 5% | 6% | 5% |
Approximately a quarter (27%) of respondents in wave 20 agreed that, in general, ‘the marking of Applied General qualifications is accurate’ (figure 30). This was in line with wave 19, maintaining the increase compared with earlier waves.
Head teachers (41%) and teachers (27%) maintained increases seen in wave 19. Meanwhile, the general public’s agreement in wave 20 (23%) continued to increase and as a result was significantly higher than wave 18 (18%). Comparatively, employers saw a decline in agreement between wave 19 and wave 20 (29% compared with 22%).
Figure 30. Results for “The marking of Applied General qualifications is accurate.”
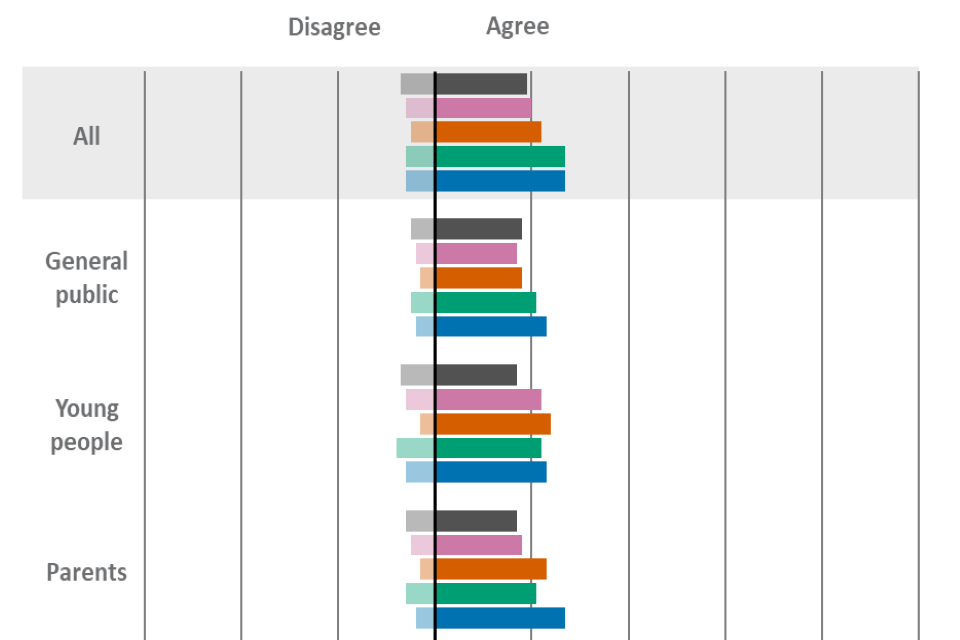
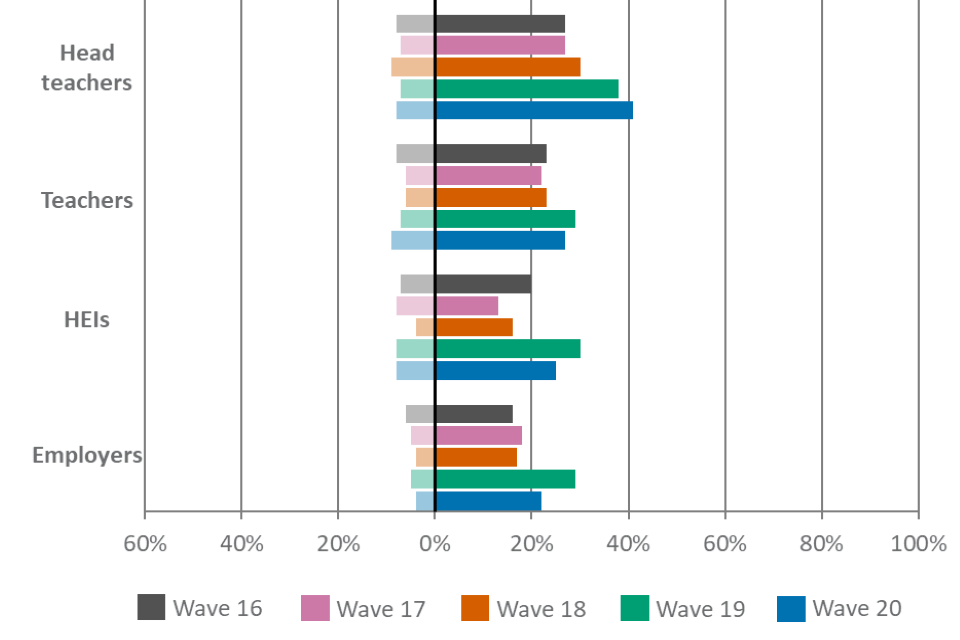
Respondents were shown a 5-point agreement scale. Agree is an aggregation of strongly agree and agree and disagree an aggregation of strongly disagree and disagree.
| Respondent type | Wave 16 | Wave 17 | Wave 18 | Wave 19 | Wave 20 |
|---|---|---|---|---|---|
| All – agree | 19% | 20% | 22% | 27% | 27% |
| All – disagree | 7% | 6% | 5% | 6% | 6% |
| General public – agree | 18% | 17% | 18% | 21% | 23% |
| General public – disagree | 5% | 4% | 3% | 5% | 4% |
| Young people – agree | 17% | 22% | 24% | 22% | 23% |
| Young people – disagree | 7% | 6% | 3% | 8% | 6% |
| Parents – agree | 17% | 18% | 23% | 21% | 27% |
| Parents– disagree | 6% | 5% | 3% | 6% | 4% |
| Head teachers – agree | 27% | 27% | 30% | 38% | 41% |
| Head teachers – disagree | 8% | 7% | 9% | 7% | 8% |
| Teachers – agree | 23% | 22% | 23% | 29% | 27% |
| Teachers – disagree | 8% | 6% | 6% | 7% | 9% |
| HEIs – agree | 20% | 13% | 16% | 30% | 25% |
| HEIs – disagree | 7% | 8% | 4% | 8% | 8% |
| Employers – agree | 16% | 18% | 17% | 29% | 22% |
| Employers – disagree | 6% | 5% | 4% | 5% | 4% |
Skills and preparation
Overall, just over a third (36%) of respondents in wave 20 agreed that, in general, ‘Applied General qualifications are good preparation for further study’ (figure 31). This was stable with wave 19.
Agreement among teachers declined between wave 19 (38%) and wave 20 (32%).
Figure 31. Results for “Applied General qualifications are good preparation for further study.”


Respondents were shown a 5-point agreement scale. Agree is an aggregation of strongly agree and agree and disagree an aggregation of strongly disagree and disagree.
| Respondent type | Wave 16 | Wave 17 | Wave 18 | Wave 19 | Wave 20 |
|---|---|---|---|---|---|
| All – agree | 30% | 31% | 33% | 38% | 36% |
| All – disagree | 10% | 11% | 10% | 9% | 9% |
| General public – agree | 28% | 31% | 31% | 35% | 35% |
| General public – disagree | 7% | 8% | 8% | 7% | 8% |
| Young people – agree | 20% | 34% | 36% | 38% | 33% |
| Young people – disagree | 14% | 12% | 11% | 7% | 10% |
| Parents – agree | 35% | 32% | 39% | 40% | 42% |
| Parents– disagree | 5% | 9% | 3% | 6% | 3% |
| Head teachers – agree | 46% | 43% | 43% | 52% | 50% |
| Head teachers – disagree | 5% | 6% | 6% | 5% | 8% |
| Teachers – agree | 32% | 29% | 32% | 38% | 32% |
| Teachers – disagree | 11% | 9% | 10% | 9% | 11% |
| HEIs – agree | 21% | 19% | 19% | 29% | 29% |
| HEIs – disagree | 20% | 25% | 23% | 23% | 18% |
| Employers – agree | 30% | 27% | 32% | 34% | 32% |
| Employers – disagree | 5% | 8% | 6% | 7% | 6% |
In wave 20, 45% of respondents agreed that, in general, ‘Applied General qualifications are good preparation for work’ (figure 32). This was consistent with wave 19. Respondents remained more likely to share the opinion that Applied General qualifications are good preparation for work than they are for further study.
Agreement among parents (48%) increased significantly compared with the earlier waves of the survey (39% in wave 17).
Figure 32. Results for “Applied General qualifications are good preparation for work.”
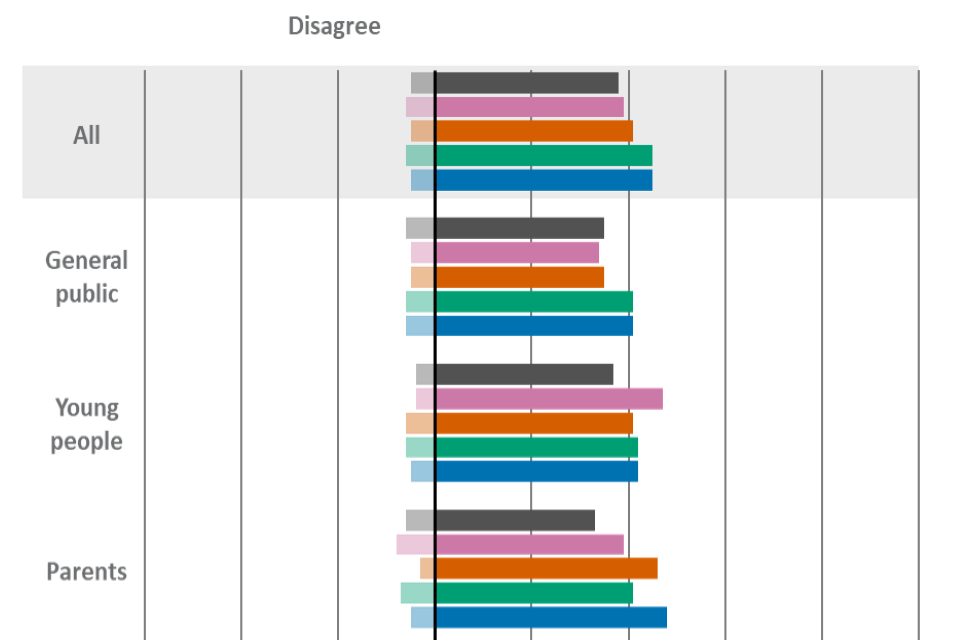

Respondents were shown a 5-point agreement scale. Agree is an aggregation of strongly agree and agree and disagree an aggregation of strongly disagree and disagree.
| Respondent type | Wave 16 | Wave 17 | Wave 18 | Wave 19 | Wave 20 |
|---|---|---|---|---|---|
| All – agree | 38% | 39% | 41% | 45% | 45% |
| All – disagree | 5% | 6% | 5% | 6% | 5% |
| General public – agree | 35% | 34% | 35% | 41% | 41% |
| General public – disagree | 6% | 5% | 5% | 6% | 6% |
| Young people – agree | 37% | 47% | 41% | 42% | 42% |
| Young people – disagree | 4% | 4% | 6% | 6% | 5% |
| Parents – agree | 33% | 39% | 46% | 41% | 48% |
| Parents– disagree | 6% | 8% | 3% | 7% | 5% |
| Head teachers – agree | 52% | 51% | 48% | 57% | 60% |
| Head teachers – disagree | 3% | 3% | 3% | 4% | 5% |
| Teachers – agree | 43% | 36% | 41% | 45% | 40% |
| Teachers – disagree | 6% | 6% | 5% | 6% | 7% |
| HEIs – agree | 32% | 31% | 39% | 50% | 45% |
| HEIs – disagree | 7% | 9% | 6% | 6% | 5% |
| Employers – agree | 34% | 35% | 37% | 42% | 40% |
| Employers – disagree | 6% | 4% | 6% | 6% | 4% |
Overall, 45% of respondents agreed that, in general, ‘Applied General qualifications develop a broad range of skills for students’ (figure 33). This was consistent with wave 19.
There were no significant changes wave-on-wave by stakeholder group.
Figure 33. “Applied General qualifications develop a broad range of skills for students.”
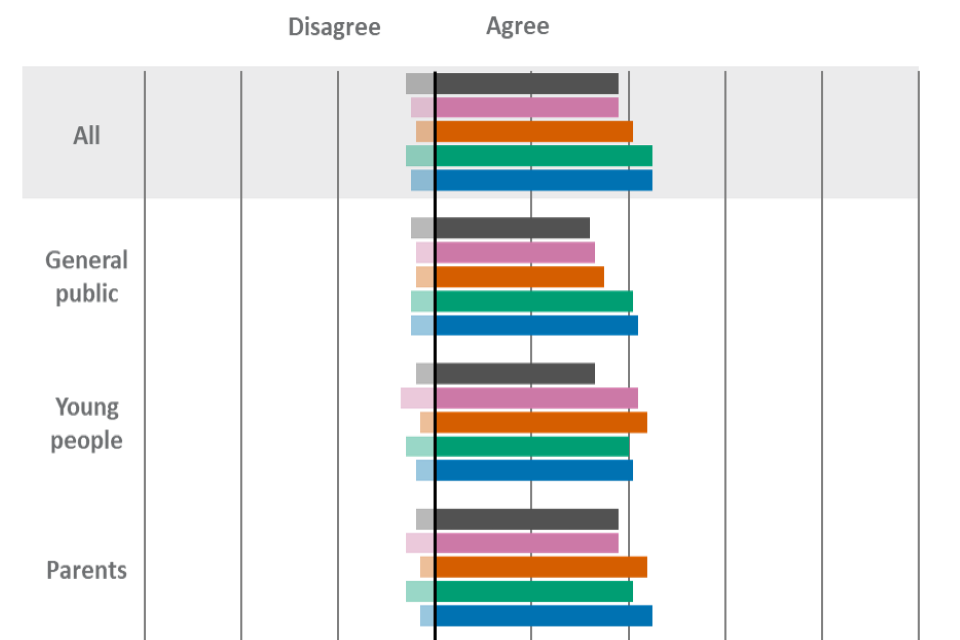
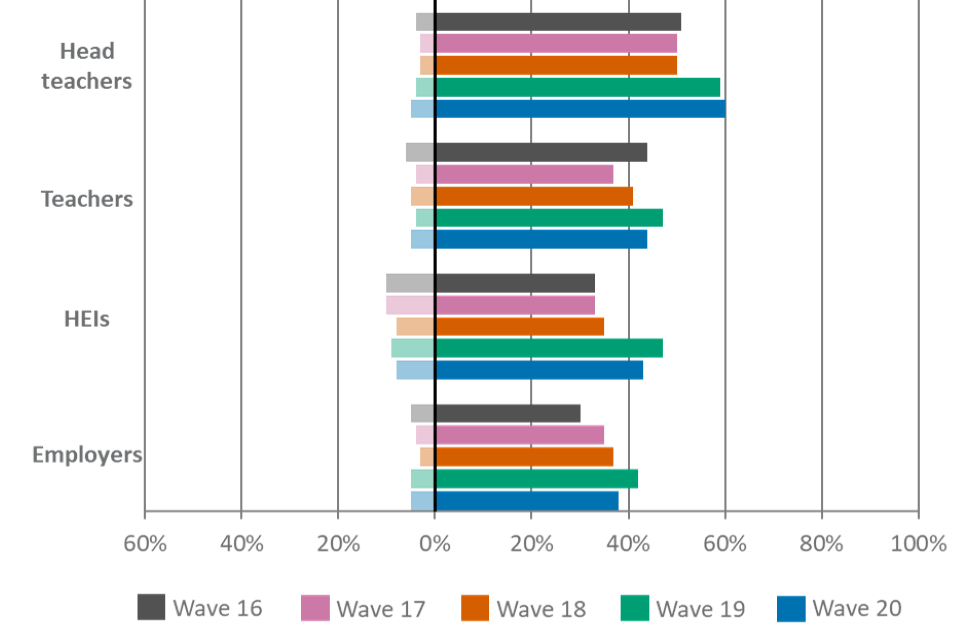
Respondents were shown a 5-point agreement scale. Agree is an aggregation of strongly agree and agree and disagree an aggregation of strongly disagree and disagree.
| Respondent type | Wave 16 | Wave 17 | Wave 18 | Wave 19 | Wave 20 |
|---|---|---|---|---|---|
| All – agree | 38% | 38% | 41% | 45% | 45% |
| All – disagree | 6% | 5% | 4% | 6% | 5% |
| General public – agree | 32% | 33% | 35% | 41% | 42% |
| General public – disagree | 5% | 4% | 4% | 5% | 5% |
| Young people – agree | 33% | 42% | 44% | 40% | 41% |
| Young people – disagree | 4% | 7% | 3% | 6% | 4% |
| Parents – agree | 38% | 38% | 44% | 41% | 45% |
| Parents– disagree | 4% | 6% | 3% | 6% | 3% |
| Head teachers – agree | 51% | 50% | 50% | 59% | 60% |
| Head teachers – disagree | 4% | 3% | 3% | 4% | 5% |
| Teachers – agree | 44% | 37% | 41% | 47% | 44% |
| Teachers – disagree | 6% | 4% | 5% | 4% | 5% |
| HEIs – agree | 33% | 33% | 35% | 47% | 43% |
| HEIs – disagree | 10% | 10% | 8% | 9% | 8% |
| Employers – agree | 30% | 35% | 37% | 42% | 38% |
| Employers – disagree | 5% | 4% | 3% | 5% | 5% |
Value for money
Overall, approximately a quarter (26%) of respondents in wave 20 agreed that, in general, ‘Applied General qualifications offer value for money’. This was consistent with the previous wave.
There were no significant changes wave-on-wave by stakeholder group.
Figure 34. Results for “Applied General qualifications offer “value for money””
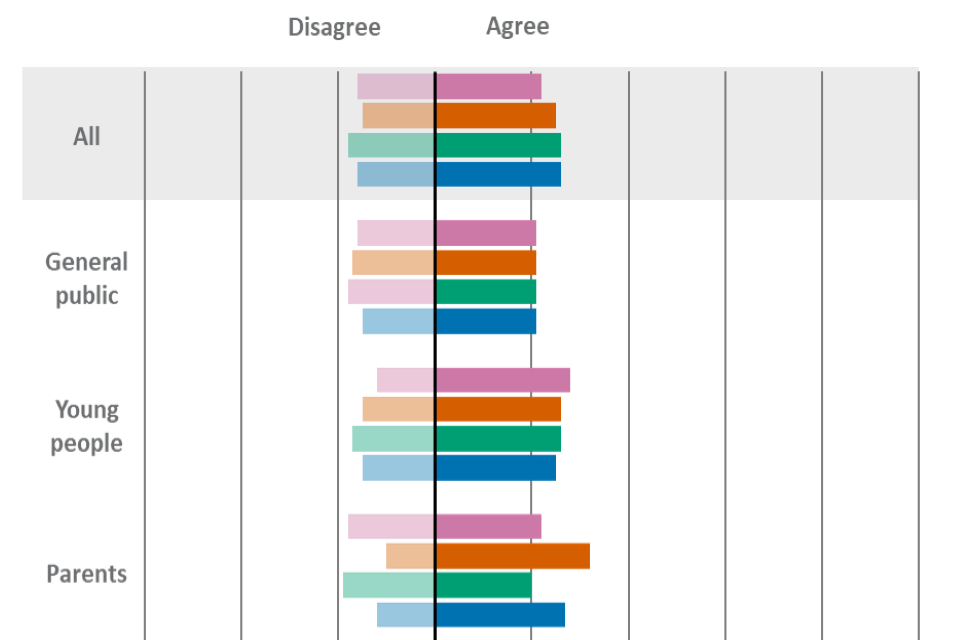
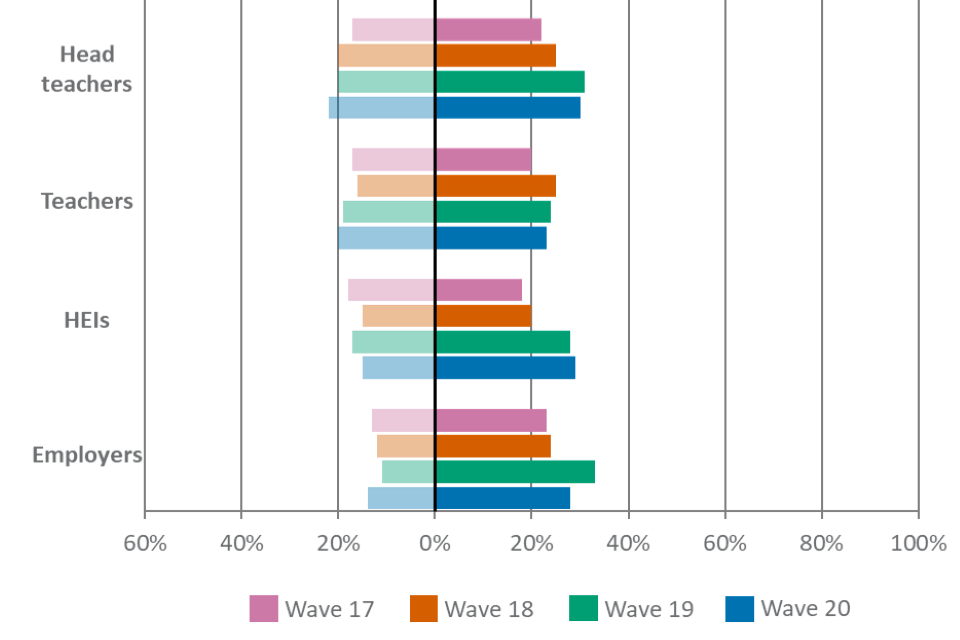
Respondents were shown a 5-point agreement scale. Agree is an aggregation of strongly agree and agree and disagree an aggregation of strongly disagree and disagree.
Note: This survey item was included for the first time in wave 17.
| Respondent type | Wave 17 | Wave 18 | Wave 19 | Wave 20 |
|---|---|---|---|---|
| All – agree | 22% | 25% | 26% | 26% |
| All – disagree | 16% | 15% | 18% | 16% |
| General public – agree | 21% | 21% | 21% | 21% |
| General public – disagree | 16% | 17% | 18% | 15% |
| Young people – agree | 28% | 26% | 26% | 25% |
| Young people – disagree | 12% | 15% | 17% | 15% |
| Parents – agree | 22% | 32% | 20% | 27% |
| Parents– disagree | 18% | 10% | 19% | 12% |
| Head teachers – agree | 22% | 25% | 31% | 30% |
| Head teachers – disagree | 17% | 20% | 20% | 22% |
| Teachers – agree | 20% | 25% | 24% | 23% |
| Teachers – disagree | 17% | 16% | 19% | 20% |
| HEIs – agree | 18% | 20% | 28% | 29% |
| HEIs – disagree | 18% | 15% | 17% | 15% |
| Employers – agree | 23% | 24% | 33% | 28% |
| Employers – disagree | 13% | 12% | 11% | 14% |
Section 6: ‘The review of marking and moderation, and appeals against results’ for GCSEs and A levels
Awareness and perceptions
For the following survey item, the wave 20 effective base was: All responses (N=2106); Young people (N=293); Parents (N=251); Teachers (N=576); Head teachers (N=214); HEIs (N=225); Employers (N=250); General public (N=979).
Eighty-four percent of respondents were ‘aware that there is a process of reviews of marking and moderation, and appeals systems for GCSE and A level results’ (figure 35). This was in line with wave 19 overall as well as among each stakeholder group.
Figure 35. Are you aware that there is a process of reviews of marking and moderation, and appeals for GCSE and A level results?
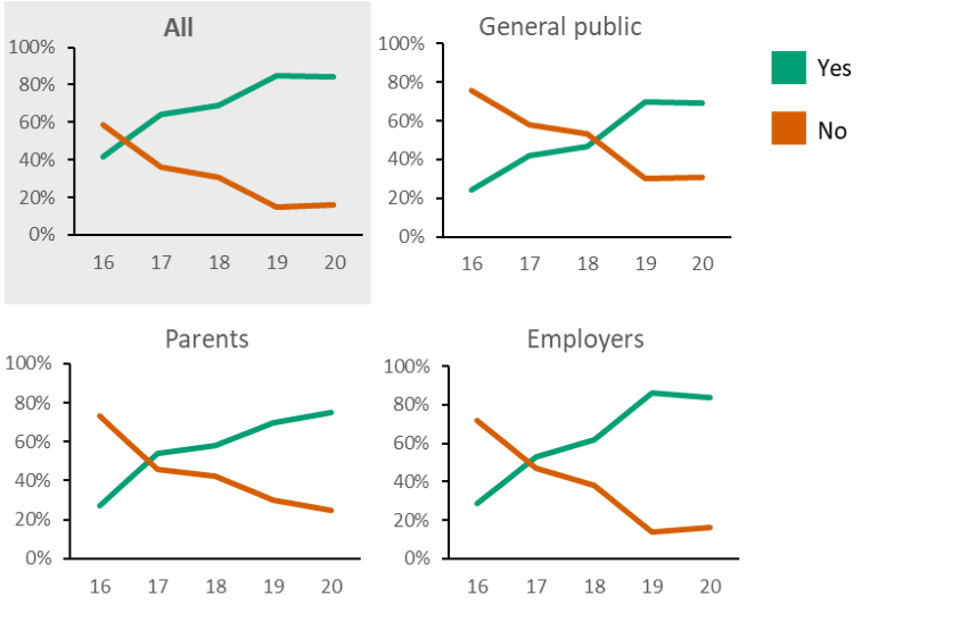
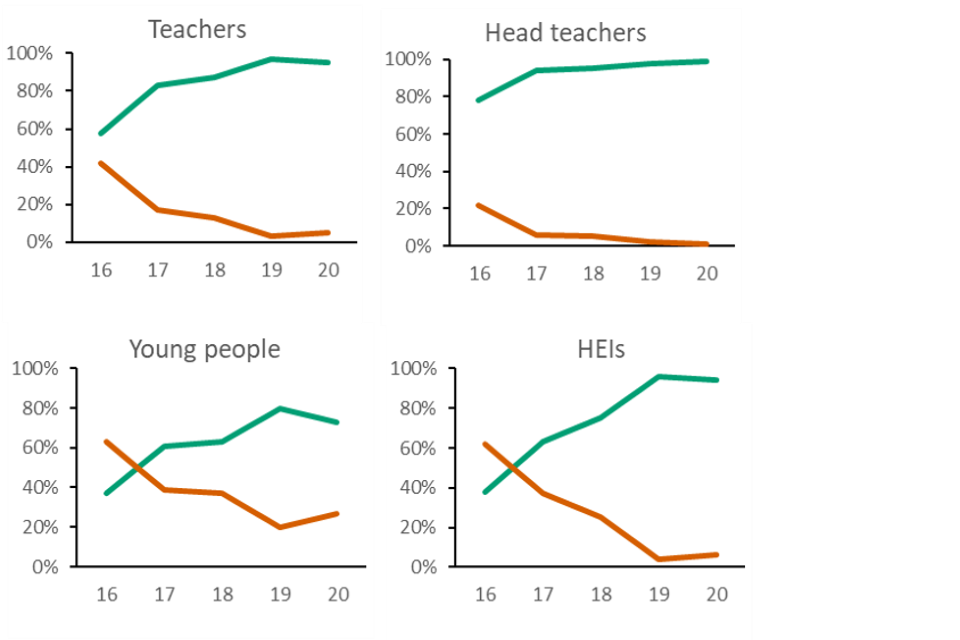
Note: An option for ‘Don’t know’ was not included in waves 17, 18, 19, 20 but it did feature in previous waves. To allow for comparison, responses for ‘No’ and ‘Don’t know’ have been combined in this figure for waves 14, 15 and 16. Before wave 17, this question was asked as: “Are you aware that there is a review of marking and moderation, and appeals system (formerly known as Enquiries about Results and Appeals) for GCSE and AS/A level results?” Employers were not included in the sample for this question in wave 14. In wave 19, the question text changed from “Are you aware that there is a review of marking, moderation and appeals system (formerly known as Enquiries about Results and Appeals) for GCSE and AS/A level results?”. In wave 20, the question text changed to remove reference to AS levels.
| Respondent type | Wave 16 | Wave 17 | Wave 18 | Wave 19 | Wave 20 |
|---|---|---|---|---|---|
| All – Yes | 42% | 64% | 69% | 85% | 84% |
| All – No | 59% | 36% | 31% | 15% | 16% |
| General public – Yes | 24% | 42% | 47% | 70% | 69% |
| General public – No | 76% | 58% | 53% | 30% | 31% |
| Young people – Yes | 37% | 61% | 63% | 80% | 73% |
| Young people – No | 63% | 39% | 37% | 20% | 27% |
| Parents – Yes | 27% | 54% | 58% | 70% | 75% |
| Parents– No | 73% | 46% | 42% | 30% | 25% |
| Head teachers – Yes | 78% | 94% | 95% | 98% | 99% |
| Head teachers – No | 22% | 6% | 5% | 2% | 1% |
| Teachers – Yes | 58% | 83% | 87% | 97% | 95% |
| Teachers – No | 42% | 17% | 13% | 3% | 5% |
| HEIs – Yes | 38% | 63% | 75% | 96% | 94% |
| HEIs – No | 62% | 37% | 25% | 4% | 6% |
| Employers – Yes | 28% | 53% | 62% | 86% | 84% |
| Employers – No | 72% | 47% | 38% | 14% | 16% |
For the following 3 survey items the wave 20 effective base was: All responses (N=1,727); Young People (N=206); Parents (N=189); Teachers (N=550); Head teachers (N=212); HEIs (N=210); Employers (N=210); General public (N=683)
As shown in figure 36, approximately half (51%) of respondents in wave 20 agreed that ‘the reviews of marking and moderation, and appeals for GCSE results is fair’. Agreement among teachers increased in wave 20 (62% compared with 55%), while for other stakeholder groups there were no significant differences.
Figure 36. Results for “The process of reviews of marking and moderation, and appeals for GCSE results is fair.”
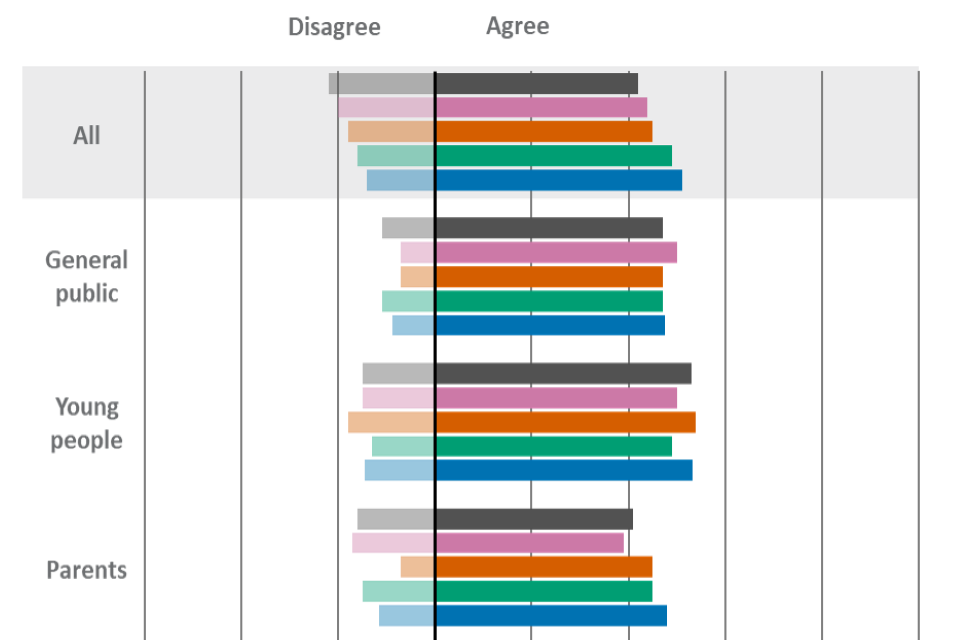

Note: This survey item was available only to those who were aware that there is a review of marking and moderation, and appeals system for GCSE and A level results. Before wave 17, this question included a reference to the system being “formerly known as Enquiries about Results and Appeals”. In wave 20, the question text changed to remove reference to AS levels.
| Respondent type | Wave 16 | Wave 17 | Wave 18 | Wave 19 | Wave 20 |
|---|---|---|---|---|---|
| All – agree | 42% | 44% | 45% | 49% | 51% |
| All – disagree | 22% | 20% | 18% | 16% | 14% |
| General public – agree | 47% | 50% | 47% | 47% | 48% |
| General public – disagree | 11% | 7% | 7% | 11% | 9% |
| Young people – agree | 53% | 50% | 54% | 49% | 53% |
| Young people – disagree | 15% | 15% | 18% | 13% | 15% |
| Parents – agree | 41% | 39% | 45% | 45% | 48% |
| Parents– disagree | 16% | 17% | 7% | 15% | 12% |
| Head teachers – agree | 34% | 35% | 44% | 45% | 52% |
| Head teachers – disagree | 40% | 43% | 37% | 31% | 26% |
| Teachers – agree | 39% | 50% | 50% | 55% | 62% |
| Teachers – disagree | 25% | 22% | 23% | 19% | 13% |
| HEIs – agree | 43% | 38% | 38% | 50% | 48% |
| HEIs – disagree | 12% | 12% | 11% | 12% | 11% |
| Employers – agree | 53% | 50% | 42% | 49% | 46% |
| Employers – disagree | 9% | 8% | 9% | 10% | 13% |
Approximately half of respondents (49%) agreed that the ‘process of reviews of marking and moderation, and appeals for A level results is fair’. This was in line with wave 19.
As with GCSEs, agreement increased among teachers in comparison with wave 19 (62% compared with 53%) (figure 37).
Figure 37. Results for “The process of reviews of marking and moderation, and appeals for A level results is fair.”


Note: This survey item was available only to those who were aware that there is a review of marking and moderation and appeals system for GCSE and A level results. Before wave 17, this question included a reference to the system being “formerly known as Enquiries about Results and Appeals”. In wave 20, the question text changed to remove reference to AS levels.
| Respondent type | Wave 16 | Wave 17 | Wave 18 | Wave 19 | Wave 20 |
|---|---|---|---|---|---|
| All – agree | 42% | 42% | 43% | 47% | 49% |
| All – disagree | 20% | 17% | 15% | 15% | 13% |
| General public – agree | 47% | 49% | 45% | 47% | 47% |
| General public – disagree | 11% | 7% | 8% | 11% | 10% |
| Young people – agree | 45% | 47% | 47% | 45% | 48% |
| Young people – disagree | 14% | 13% | 12% | 17% | 15% |
| Parents – agree | 41% | 35% | 44% | 43% | 46% |
| Parents– disagree | 12% | 15% | 7% | 13% | 11% |
| Head teachers – agree | 34% | 33% | 37% | 42% | 46% |
| Head teachers – disagree | 36% | 30% | 28% | 25% | 19% |
| Teachers – agree | 40% | 48% | 47% | 53% | 62% |
| Teachers – disagree | 22% | 19% | 19% | 17% | 12% |
| HEIs – agree | 46% | 40% | 39% | 51% | 50% |
| HEIs – disagree | 13% | 14% | 11% | 12% | 12% |
| Employers – agree | 55% | 48% | 47% | 48% | 43% |
| Employers – disagree | 6% | 9% | 7% | 10% | 11% |
Half of respondents (50%) agreed that they have ‘adequate information about the process of reviews of marking and moderation, and appeals for GCSE and A level results’. This represented no change from wave 19 and was broadly stable across all stakeholders (figure 38).
Figure 38. Results for “I have adequate information about the process of reviews of marking and moderation, and appeals for GCSE and A level results.”


Note: This survey item was available only to those who were aware that there is a review of marking and moderation, and appeals system for GCSE and A level results Before wave 17, this question included a reference to the system being “formerly known as Enquiries about Results and Appeals”. In wave 19, the question text changed from “I have adequate information about the changes to the review of marking, moderation and appeals system (formally known as Enquiries about Results and Appeals) for GCSEs and AS/A levels?”. In wave 20, the question text changed to remove reference to AS levels.
| Respondent type | Wave 16 | Wave 17 | Wave 18 | Wave 19 | Wave 20 |
|---|---|---|---|---|---|
| All – agree | 39% | 43% | 48% | 50% | 50% |
| All – disagree | 33% | 30% | 27% | 25% | 24% |
| General public – agree | 26% | 24% | 26% | 33% | 31% |
| General public – disagree | 38% | 38% | 36% | 33% | 35% |
| Young people – agree | 42% | 40% | 52% | 36% | 40% |
| Young people – disagree | 38% | 31% | 27% | 39% | 33% |
| Parents – agree | 36% | 32% | 34% | 34% | 38% |
| Parents– disagree | 41% | 39% | 40% | 39% | 31% |
| Head teachers – agree | 52% | 66% | 73% | 79% | 83% |
| Head teachers – disagree | 27% | 18% | 13% | 8% | 8% |
| Teachers – agree | 41% | 53% | 63% | 69% | 68% |
| Teachers – disagree | 31% | 25% | 20% | 15% | 14% |
| HEIs – agree | 18% | 30% | 35% | 46% | 46% |
| HEIs – disagree | 32% | 37% | 31% | 24% | 26% |
| Employers – agree | 33% | 28% | 30% | 39% | 34% |
| Employers – disagree | 34% | 37% | 32% | 27% | 31% |
Section 7: Special consideration and reasonable adjustments for GCSE and A level qualifications
Special consideration
For the following 6 survey items the wave 20 effective base was: All responses (N=548); (N=Teachers 515); Head teachers (N=194). These survey items were available only to teachers and head teachers, therefore ‘All’ in the following items represent only head teachers and teachers.
Overall, approximately eight in ten (79%) head teachers and teachers agreed that they have ‘adequate information about the arrangements available for a GCSE or A level student who is eligible for special consideration’ (figure 39). This was consistent with recent waves.
There were no changes compared to any previous waves for either teachers or head teachers.
Figure 39. Results for “I have adequate information about the arrangements that are available for a GCSE or A level student who is eligible for special consideration.”
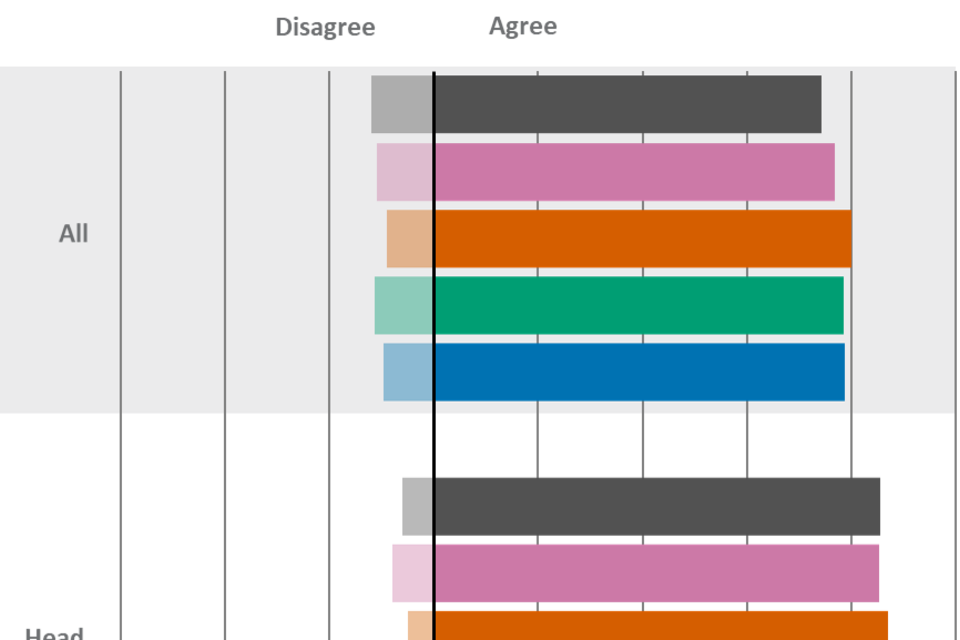
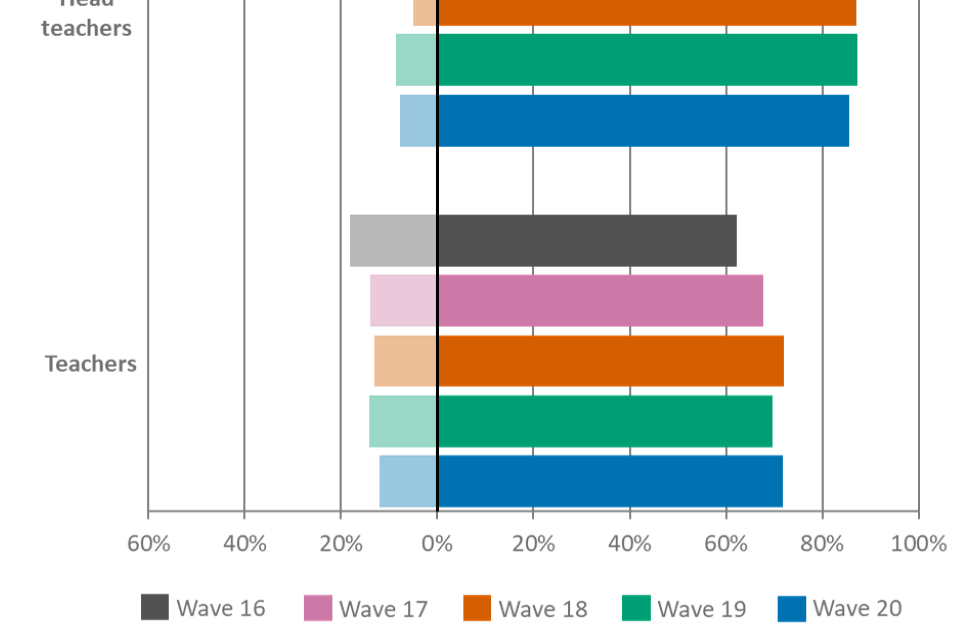
| Respondent type | Wave 16 | Wave 17 | Wave 18 | Wave 19 | Wave 20 |
|---|---|---|---|---|---|
| All – agree | 74% | 77% | 80% | 79% | 79% |
| All – disagree | 12% | 11% | 9% | 11% | 10% |
| Head teachers – agree | 86% | 85% | 87% | 87% | 86% |
| Head teachers – disagree | 6% | 8% | 5% | 9% | 8% |
| Teachers – agree | 62% | 68% | 72% | 70% | 72% |
| Teachers – disagree | 18% | 14% | 13% | 14% | 12% |
Nearly two thirds (64%) of head teachers, and teachers agreed that ‘special consideration makes the qualification system fairer for all GCSE and A level students’ (figure 40). This was in line with the previous waves. While attitudes were consistent at an overall level, teachers saw an increase in agreement between wave 19 (57%) and wave 20 (64%).
Figure 40. Results for “Special consideration makes the qualification system fairer for all GCSE and A level students”
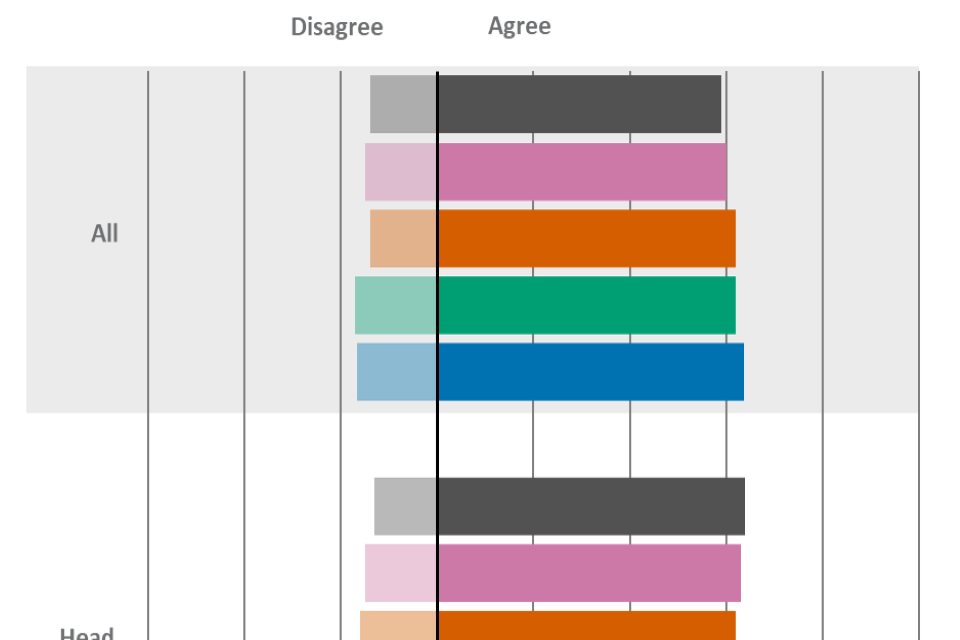
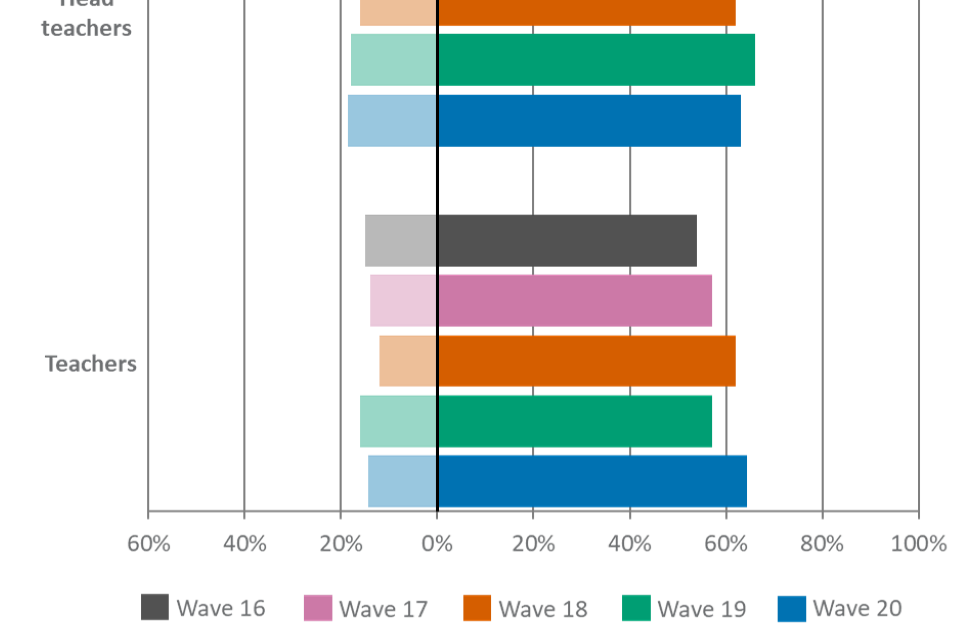
| Respondent type | Wave 16 | Wave 17 | Wave 18 | Wave 19 | Wave 20 |
|---|---|---|---|---|---|
| All – agree | 59% | 60% | 62% | 62% | 64% |
| All – disagree | 14% | 15% | 14% | 17% | 17% |
| Head teachers – agree | 64% | 63% | 62% | 66% | 63% |
| Head teachers – disagree | 13% | 15% | 16% | 18% | 19% |
| Teachers – agree | 54% | 57% | 62% | 57% | 64% |
| Teachers – disagree | 15% | 14% | 12% | 16% | 14% |
Just over half (54%) of head teachers, and teachers agreed that the ‘right arrangements are made for the right GCSE and A level students in the current special consideration system’ (figure 41). This was broadly consistent with wave 19.
There were no significant changes wave-on-wave by stakeholder group.
Figure 41. Results for “In the current special consideration system, the right arrangements are made for the right GCSE and A level students.”
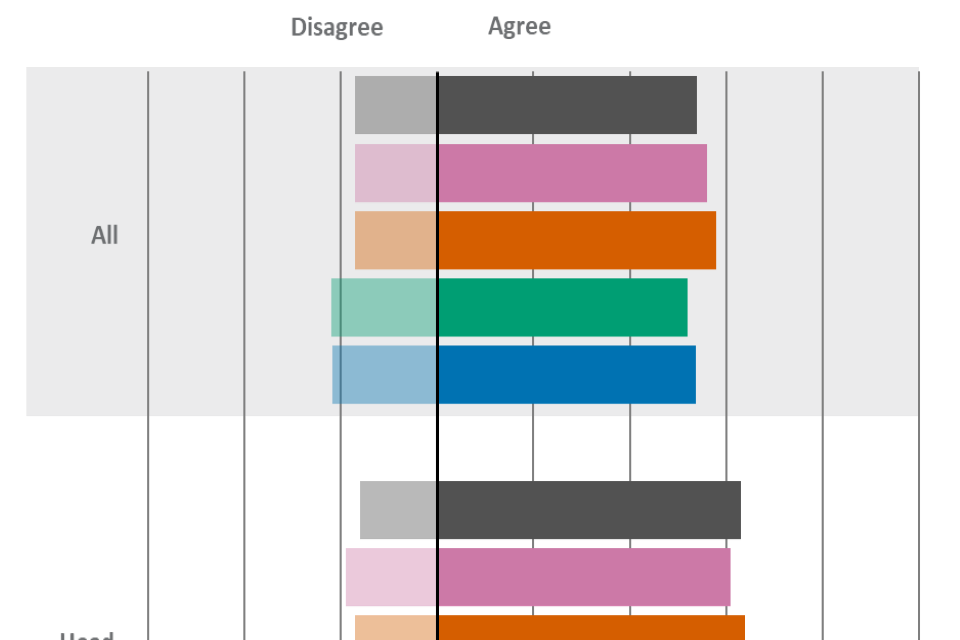
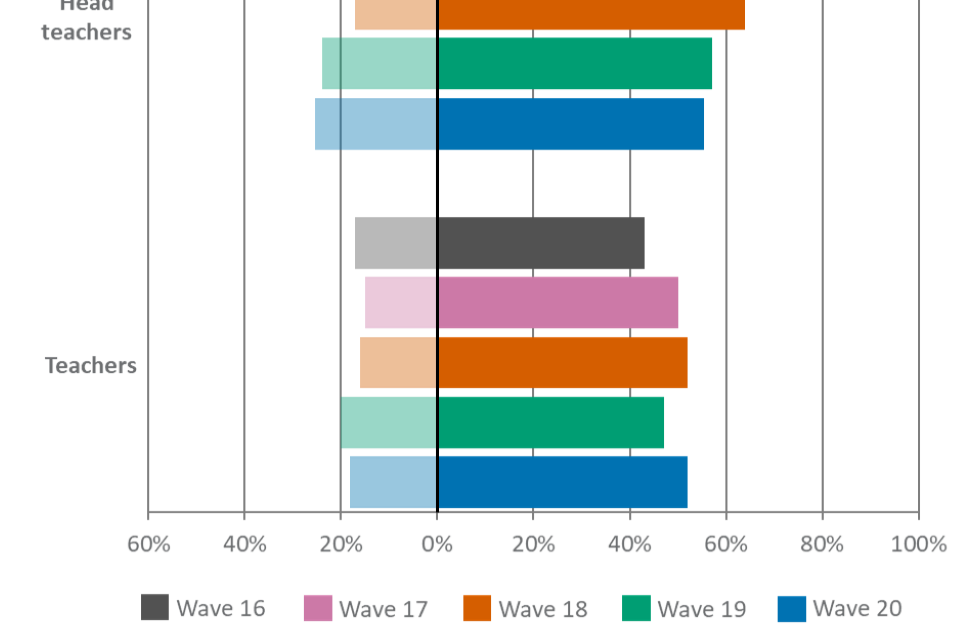
| Respondent type | Wave 16 | Wave 17 | Wave 18 | Wave 19 | Wave 20 |
|---|---|---|---|---|---|
| All – agree | 54% | 56% | 58% | 52% | 54% |
| All – disagree | 17% | 17% | 17% | 22% | 22% |
| Head teachers – agree | 63% | 61% | 64% | 57% | 55% |
| Head teachers – disagree | 16% | 19% | 17% | 24% | 25% |
| Teachers – agree | 43% | 50% | 52% | 47% | 52% |
| Teachers – disagree | 17% | 15% | 16% | 20% | 18% |
Reasonable adjustments
Approximately seven in ten (72%) head teachers and teachers agreed that they have ‘adequate information about the adjustments available for a disabled GCSE or A level student who is eligible for reasonable adjustments’ (figure 42) (being disabled under the Equality Act 2010 is defined as having a physical or mental impairment that has a ‘substantial’ and ‘long-term’ negative effect on the ability to do normal daily activities.). This was remains stable, in line with previous waves.
Agreement for head teachers and teachers saw no significant changes wave-on-wave.
Figure 42. Results for “I have adequate information about the adjustments that are available for a GCSE or A level disabled student who is eligible for reasonable adjustments.”
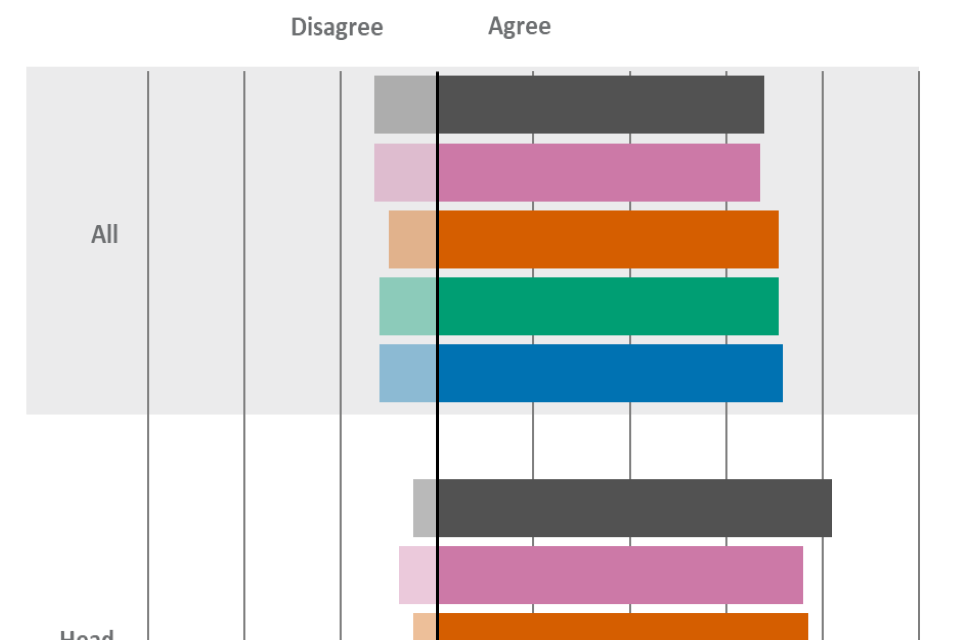
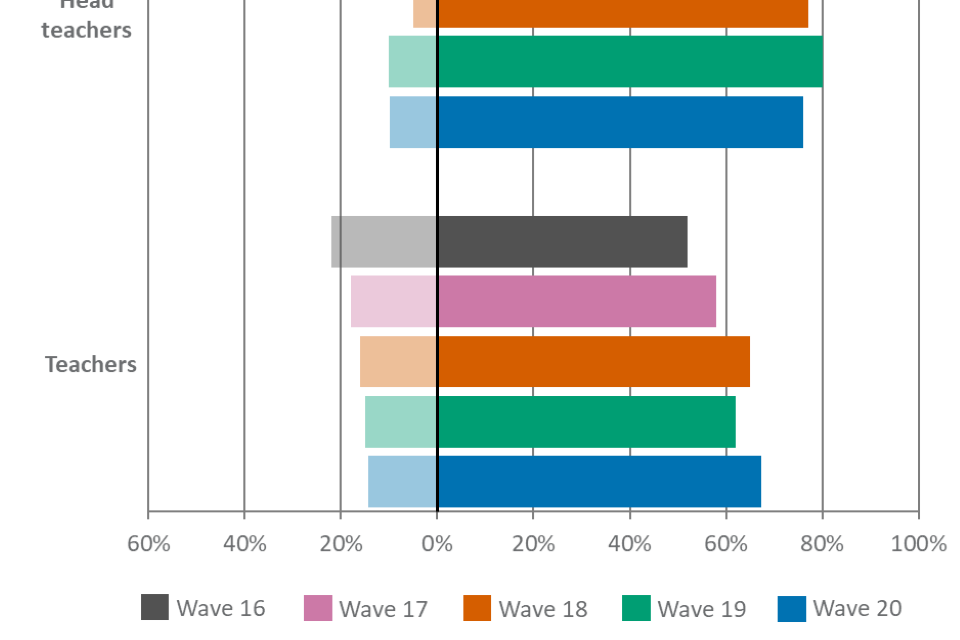
| Respondent type | Wave 16 | Wave 17 | Wave 18 | Wave 19 | Wave 20 |
|---|---|---|---|---|---|
| All – agree | 68% | 67% | 71% | 71% | 72% |
| All – disagree | 13% | 13% | 10% | 12% | 12% |
| Head teachers – agree | 82% | 76% | 77% | 80% | 76% |
| Head teachers – disagree | 5% | 8% | 5% | 10% | 10% |
| Teachers – agree | 52% | 58% | 65% | 62% | 67% |
| Teachers – disagree | 22% | 18% | 16% | 15% | 14% |
Overall, approximately half (53%) of head teachers and teachers agreed that the ‘right reasonable adjustments are made for the right GCSE and A level disabled students’. This was consistent with the previous waves. Wave 20 agreement among teachers (51%) was consistent with recent previous waves and was significantly higher than wave 16 (41%).
Figure 43. Results for “Currently, the right reasonable adjustments are made for the right GCSE and A level disabled students.”
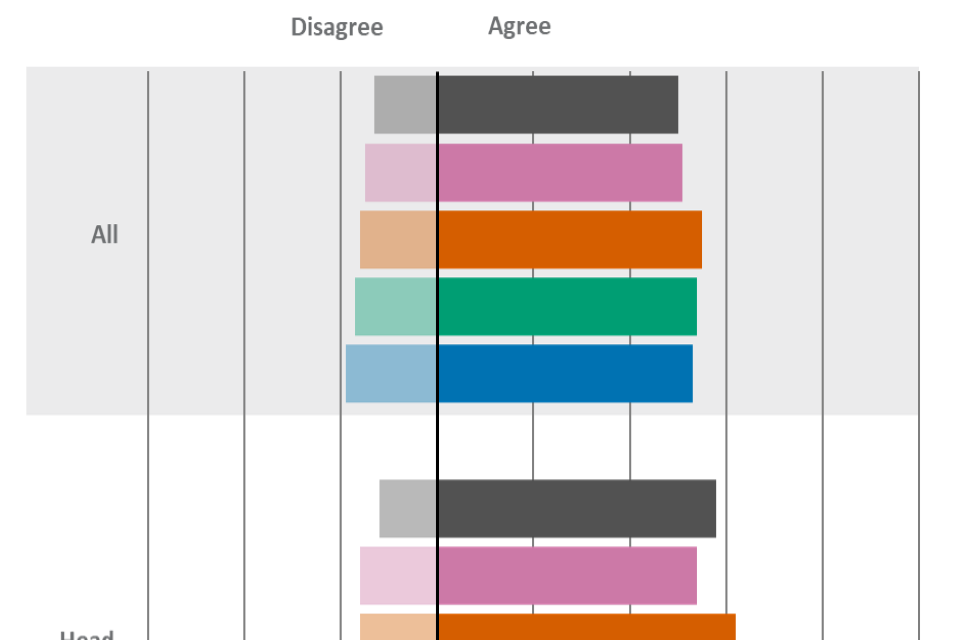
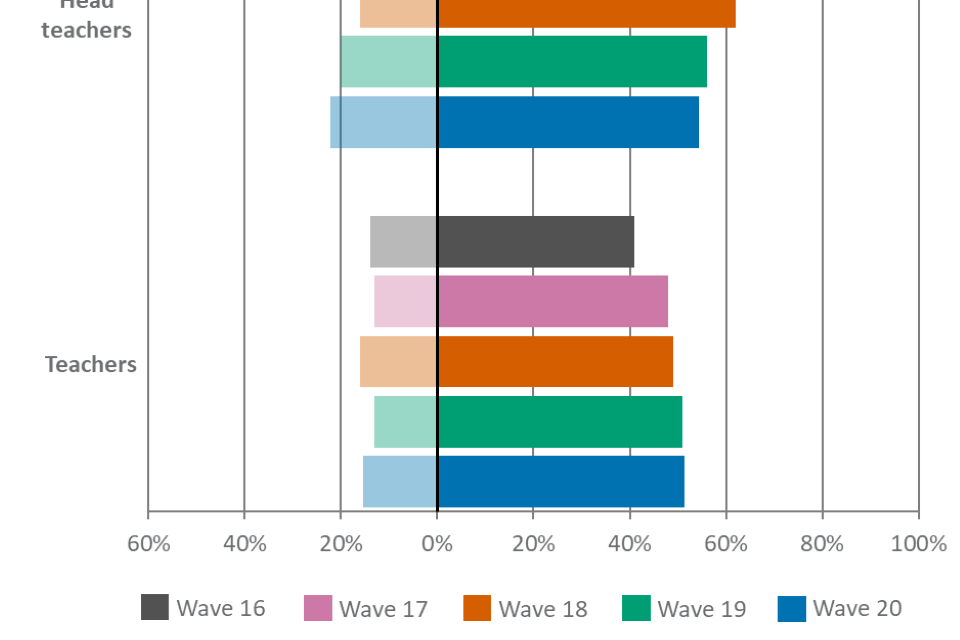
| Respondent type | Wave 16 | Wave 17 | Wave 18 | Wave 19 | Wave 20 |
|---|---|---|---|---|---|
| All – agree | 50% | 51% | 55% | 54% | 53% |
| All – disagree | 13% | 15% | 16% | 17% | 19% |
| Head teachers – agree | 58% | 54% | 62% | 56% | 54% |
| Head teachers – disagree | 12% | 16% | 16% | 20% | 22% |
| Teachers – agree | 41% | 48% | 49% | 51% | 51% |
| Teachers – disagree | 14% | 13% | 16% | 13% | 15% |
Overall, 65% of head teachers and teachers agreed that ‘reasonable adjustments make the qualification system fairer for all GCSE and A level students’ (figure 44). This was consistent with all earlier waves. Wave 20 agreement among teachers (64%) was significantly higher than in wave 17 (58%).
Figure 44. Results for “Reasonable adjustments make the qualification system fairer for all GCSE and A level students.”

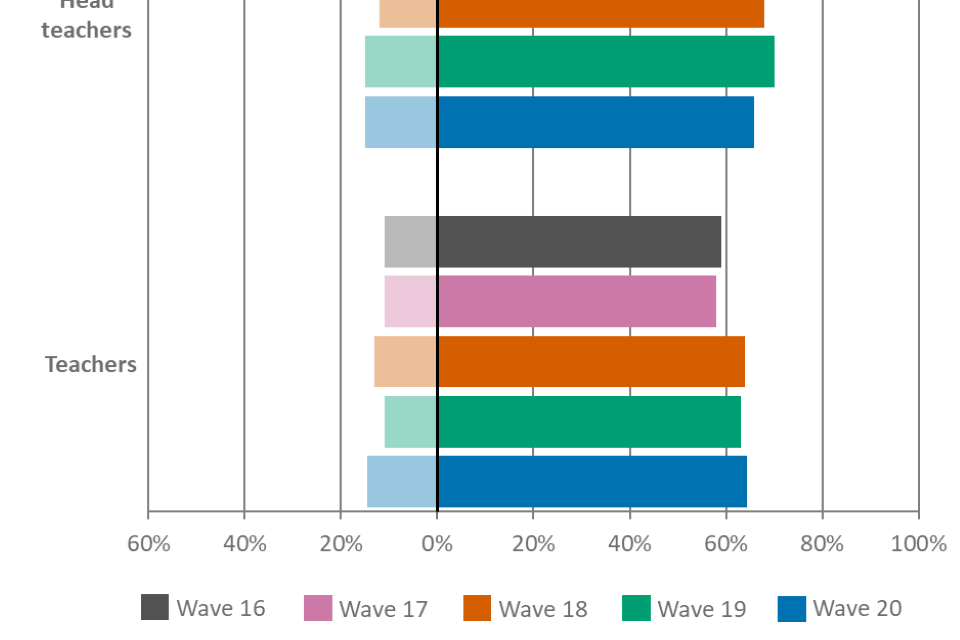
| Respondent type | Wave 16 | Wave 17 | Wave 18 | Wave 19 | Wave 20 |
|---|---|---|---|---|---|
| All – agree | 63% | 62% | 66% | 66% | 65% |
| All – disagree | 13% | 12% | 12% | 13% | 15% |
| Head teachers – agree | 66% | 66% | 68% | 70% | 66% |
| Head teachers – disagree | 15% | 12% | 12% | 15% | 15% |
| Teachers – agree | 59% | 58% | 64% | 63% | 64% |
| Teachers – disagree | 11% | 11% | 13% | 11% | 15% |
Section 8: Malpractice for GCSE and A level qualifications
Awareness and perceptions
For the following 4 survey items the wave 20 effective base was: All responses (N=548); Teachers (N=515); Head teachers (N=194). These survey items were available only to teachers and head teachers, therefore ‘All’ in the following items represent only head teachers and teachers.
Figure 45 shows approximately nine in ten (89%) teachers and head teachers agreed that they have ‘adequate information about what constitutes malpractice for GCSEs and A levels’. This was comparable to previous waves.
Figure 45. Results for “I have adequate information about what constitutes malpractice for GCSEs and A levels.”

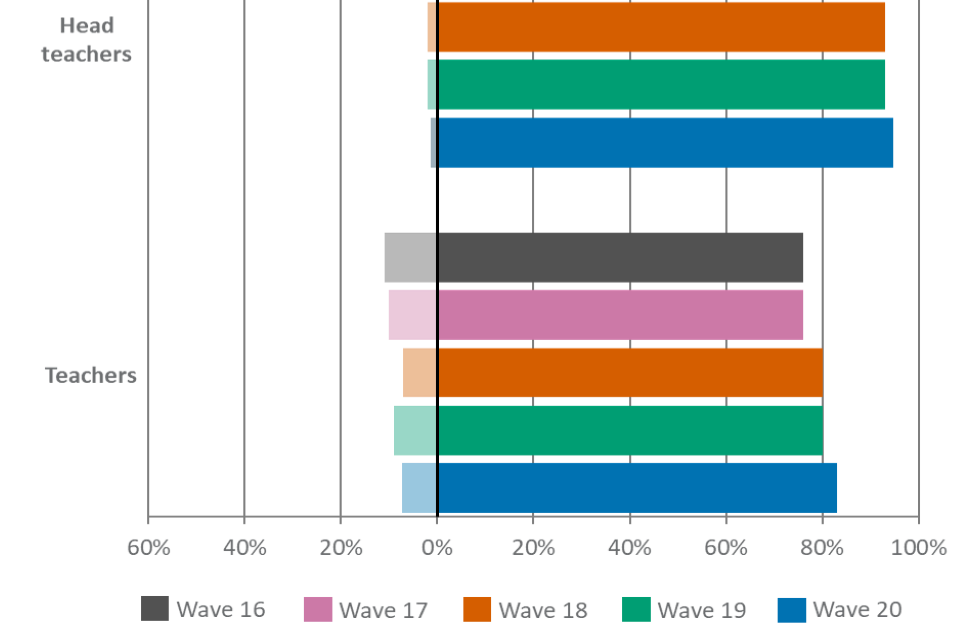
Note: In wave 20, the question text changed to remove reference to AS levels.
| Respondent type | Wave 16 | Wave 17 | Wave 18 | Wave 19 | Wave 20 | |
|---|---|---|---|---|---|---|
| All – agree | 86% | 86% | 86% | 86% | 89% | |
| All – disagree | 6% | 6% | 5% | 5% | 4% | |
| Head teachers – agree | 95% | 96% | 93% | 93% | 95% | |
| Head teachers – disagree | 2% | 1% | 2% | 2% | 1% | |
| Teachers – agree | 76% | 76% | 80% | 80% | 83% | |
| Teachers – disagree | 11% | 10% | 7% | 9% | 7% |
Consistent with the previous waves, approximately nine in ten (89%) head teachers and teachers agreed that they ‘know to whom they should report an incident of malpractice in GCSEs and A levels’. Head teachers were more likely than teachers to agree, which remains comparable with previous waves (figure 46).
Figure 46. Results for “I know to whom I should report an incident of malpractice for GCSEs and A levels.”

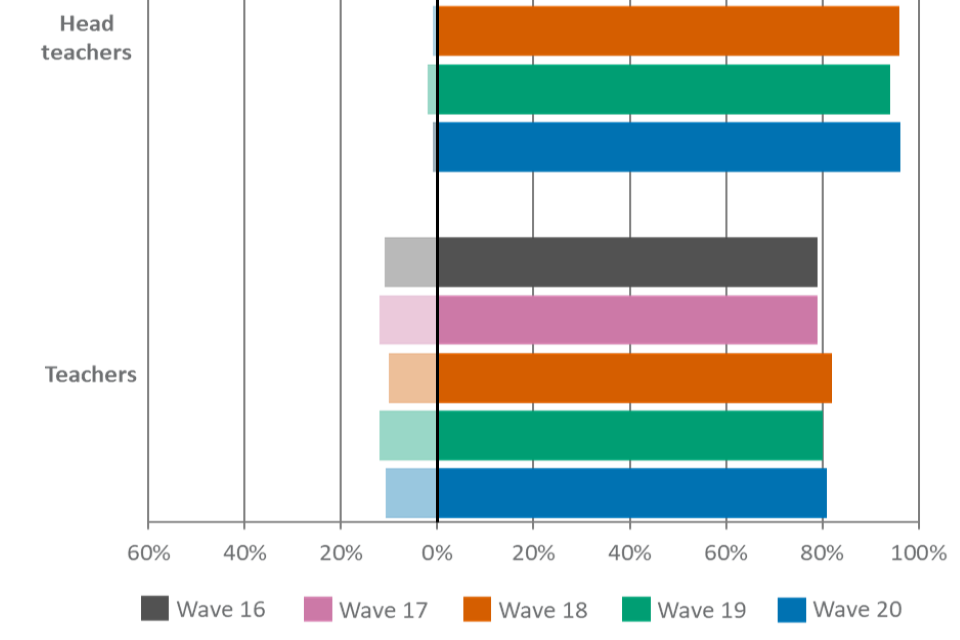
Note: In wave 20, the question text changed to remove reference to AS levels.
| Respondent type | Wave 16 | Wave 17 | Wave 18 | Wave 19 | Wave 20 |
|---|---|---|---|---|---|
| All – agree | 89% | 88% | 89% | 87% | 89% |
| All – disagree | 6% | 6% | 5% | 7% | 6% |
| Head teachers – agree | 98% | 98% | 96% | 94% | 96% |
| Head teachers – disagree | 1% | 1% | 1% | 2% | 1% |
| Teachers – agree | 79% | 79% | 82% | 80% | 81% |
| Teachers – disagree | 11% | 12% | 10% | 12% | 11% |
As figure 47 shows approximately seven in ten (72%) respondents agreed that they are ‘confident incidents of malpractice are fairly investigated for GCSEs and A levels’, which remains comparable with wave 19. Head teachers were more likely to agree than teachers; 78% head teachers agreed compared with 65% of teachers.
Figure 47. Results for “I am confident that incidents of malpractice are fairly investigated for GCSEs and A levels.”
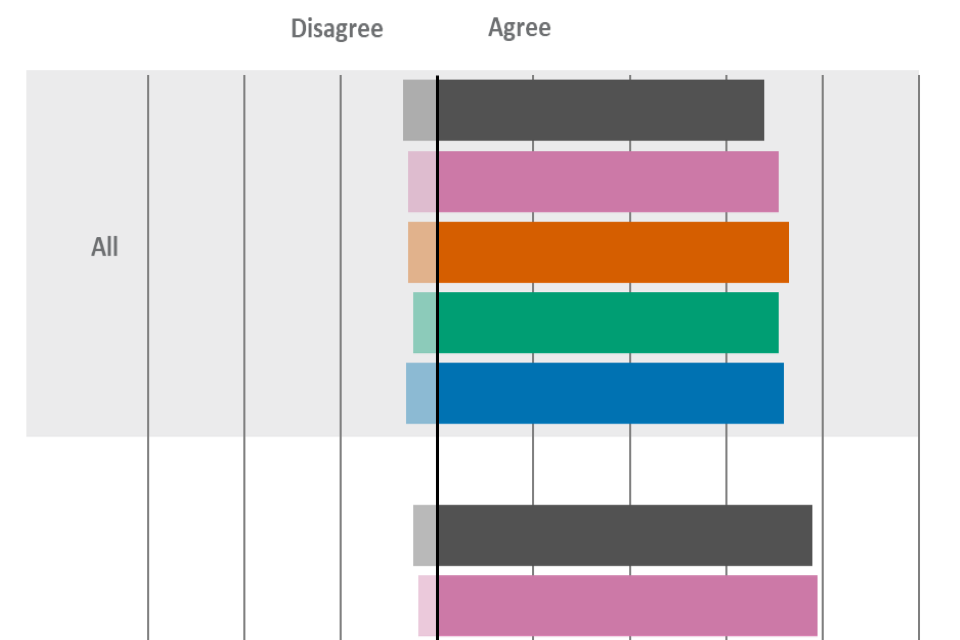
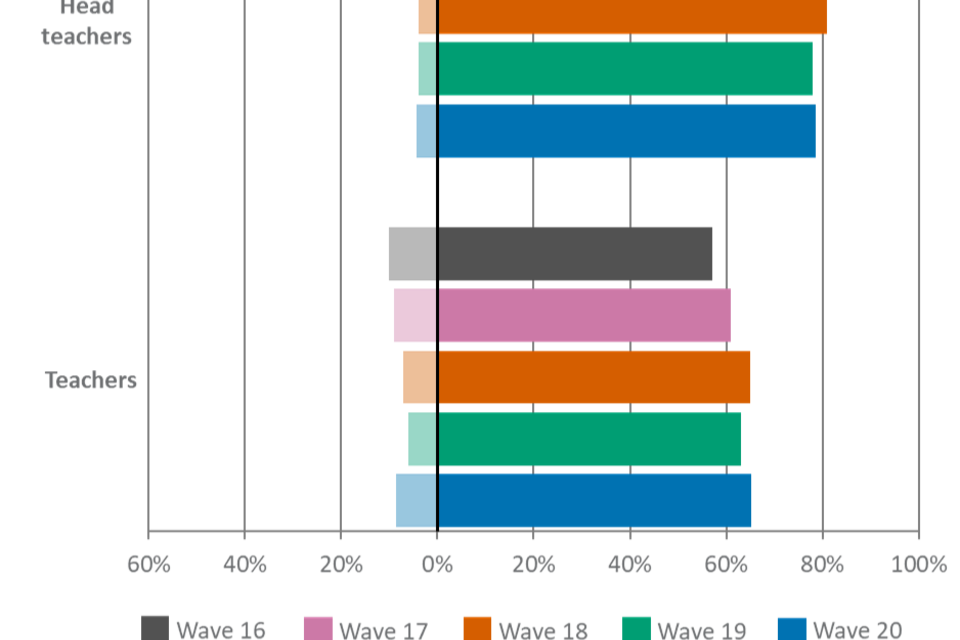
Note: In wave 20, the question text changed to remove reference to AS levels.
| Respondent type | Wave 16 | Wave 17 | Wave 18 | Wave 19 | Wave 20 |
|---|---|---|---|---|---|
| All – agree | 68% | 71% | 73% | 71% | 72% |
| All – disagree | 7% | 6% | 6% | 5% | 6% |
| Head teachers – agree | 78% | 79% | 81% | 78% | 78% |
| Head teachers – disagree | 5% | 4% | 4% | 4% | 4% |
| Teachers – agree | 57% | 61% | 65% | 63% | 65% |
| Teachers – disagree | 10% | 9% | 7% | 6% | 9% |
Overall, approximately six in ten (62%) respondents agreed that they are ‘confident malpractice is properly reported when it happens in GCSEs and A levels’. Approximately half (53%) of teachers agreed they are confident malpractice is properly reported, compared with 70% of head teachers (figure 48).
Figure 48. Results for “I am confident that malpractice is properly reported when it happens in GCSEs and A levels.”
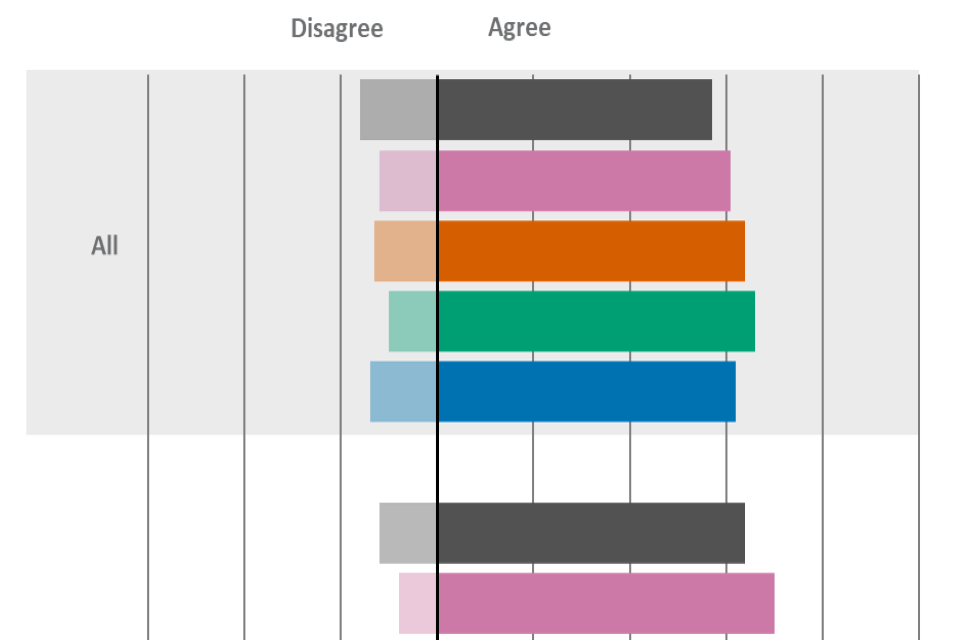

Note: In wave 20, the question text changed to remove reference to AS levels.
| Respondent type | Wave 16 | Wave 17 | Wave 18 | Wave 19 | Wave 20 |
|---|---|---|---|---|---|
| All – agree | 57% | 61% | 64% | 66% | 62% |
| All – disagree | 16% | 12% | 13% | 10% | 14% |
| Head teachers – agree | 64% | 70% | 72% | 75% | 70% |
| Head teachers – disagree | 12% | 8% | 10% | 7% | 12% |
| Teachers – agree | 50% | 52% | 56% | 58% | 53% |
| Teachers – disagree | 19% | 17% | 16% | 14% | 16% |
Section 9: Appeals against results for Applied General qualifications
Awareness and perceptions
For the following survey item, the wave 20 effective base was: All who teach Applied General qualifications (N=73); Head teachers (N=48), Teachers (N=28). Due to sample sizes, head teachers and teachers are reported as one group.
Overall, roughly nine in ten (88%) teachers and head teachers who teach Applied General qualifications were ‘aware of the appeals process for Applied General qualifications in schools and colleges’ (figure 49). This was consistent with recent waves but higher than wave 17 (71%).
Figure 49. Results for “Are you aware of the appeals against results process for Applied General qualifications in schools and colleges?”

Note: This survey item was previously asked to all respondents but was amended in wave 18 to be only asked to head teachers and teachers who teach Applied General qualifications. The wave 17 figures have been rebased to be consistent with the wave 18 data. In wave 16 the respondent base size for teachers or head teachers who teach Applied General qualifications was small (<50). Therefore, data relating to wave 16 is not included here.
| Respondent type | Wave 17 | Wave 18 | Wave 19 | Wave 20 |
|---|---|---|---|---|
| All – Yes | 71% | 82% | 87% | 88% |
| All – No | 29% | 18% | 13% | 12% |
For the following 2 survey items the wave 20 effective base was: All who teach Applied General qualifications and were aware of the appeals process for Applied General qualifications in schools and colleges (N=63); Head teachers (N=46), Teachers (N=27). Due to sample sizes, head teachers and teachers are reported as one group.
Overall, over eight in ten (84%) teachers and head teachers agreed that they have ‘adequate information about the appeals process for Applied General qualifications taught in schools and colleges’ (figure 50). This was similar to recent waves.
Figure 50. Results for “I have adequate information about the appeals against results process for Applied General qualifications taught in schools and colleges.”
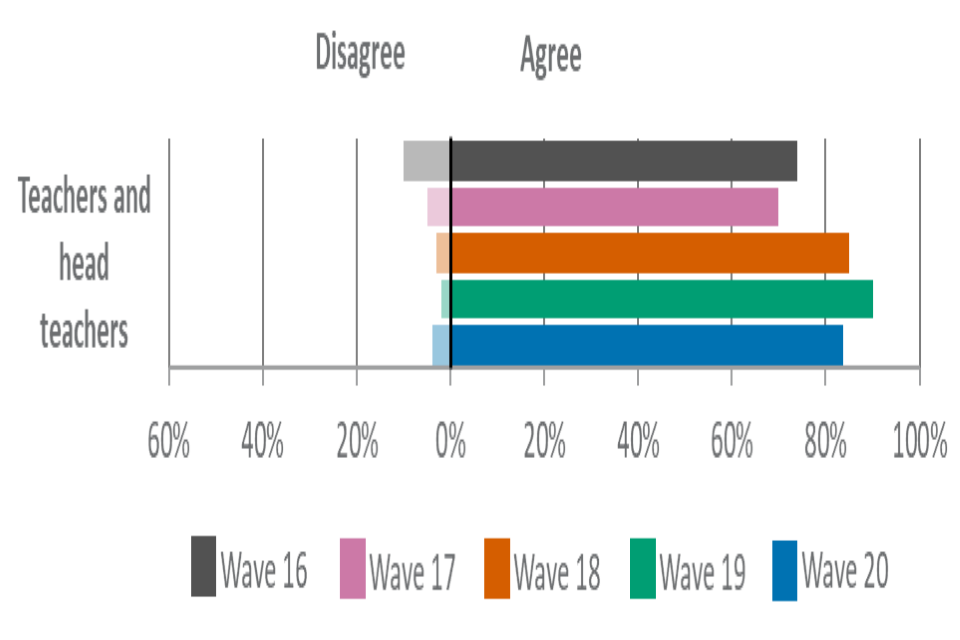
Note: This survey item was previously asked to all respondents but was amended in wave 18 to be only asked to head teachers and teachers. The wave 16 and wave 17 figures have been rebased to be consistent with the wave 18, 19 and 20 data.
| Respondent type | Wave 16 | Wave 17 | Wave 18 | Wave 19 | Wave 20 |
|---|---|---|---|---|---|
| Teachers and head teachers – agree | 74% | 70% | 85% | 90% | 84% |
| Teachers and head teachers – disagree | 10% | 5% | 3% | 2% | 4% |
Approximately seven in ten (72%) teachers and head teachers agreed that they are ‘confident that appeals are dealt with fairly for Applied General qualifications in schools and colleges’ (figure 51). This represented no significant differences compared recent waves.
Figure 51. Results for “I am confident that appeals are dealt with fairly for Applied General qualifications in schools and colleges.”

Note: This survey item was previously asked to all respondents but was amended in wave 18 to be only asked to head teachers and teachers. The wave 16 and wave 17 figures have been rebased to be consistent with the wave 18, 19 and 20 data.
| Respondent type | Wave 16 | Wave 17 | Wave 18 | Wave 19 | Wave 20 |
|---|---|---|---|---|---|
| Teachers and head teachers – agree | 62% | 66% | 71% | 81% | 72% |
| Teachers and head teachers – disagree | 9% | 7% | 2% | 4% | 4% |
Section 10: Malpractice for Applied General qualifications
For the following 4 survey items the wave 20 effective base was: All responses (N=73); teachers (N=28); Head teachers (N=48). These survey items were available only to teachers and head teachers who teach Applied General qualifications. Due to sample sizes, head teachers and teachers are reported as one group.
Figure 52 shows in wave 20, 85% of teachers and head teachers agreed that they have ‘adequate information about what constitutes malpractice for Applied General qualifications taught in schools and colleges’. This was broadly comparable to waves 18 and 19.
Figure 52. Results for “I have adequate information about what constitutes malpractice for Applied General qualifications taught in schools and colleges.”

| Respondent type | Wave 17 | Wave 18 | Wave 19 | Wave 20 |
|---|---|---|---|---|
| Teachers and head teachers – agree | 70% | 81% | 86% | 85% |
| Teachers and head teachers – disagree | 11% | 3% | 7% | 5% |
Overall, 86% of head teachers and teachers agreed that they ‘knew to whom to report an incident of malpractice for Applied General qualifications’. This remained level with waves 17, 18 and 19 (figure 53).
Figure 53. Results for “I know to whom I should report an incident of malpractice for Applied General qualifications taught in schools and colleges.”
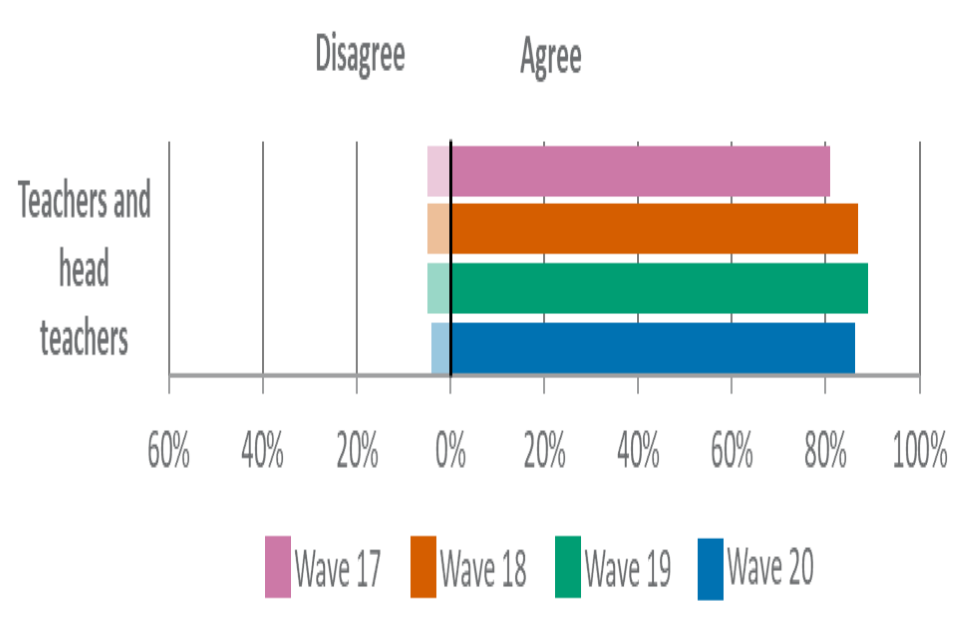
| Respondent type | Wave 17 | Wave 18 | Wave 19 | Wave 20 |
|---|---|---|---|---|
| Teachers and head teachers – agree | 81% | 87% | 89% | 86% |
| Teachers and head teachers – disagree | 5% | 5% | 5% | 4% |
Approximately seven in ten (69%) teachers and head teachers agreed that they are ‘confident incidents of malpractice for Applied General qualifications taught in schools and colleges are fairly investigated’. There was no significant difference with wave 19 (figure 54).
Figure 54. Results for “I am confident that incidents of malpractice for Applied General qualifications taught in schools and colleges are fairly investigated.”
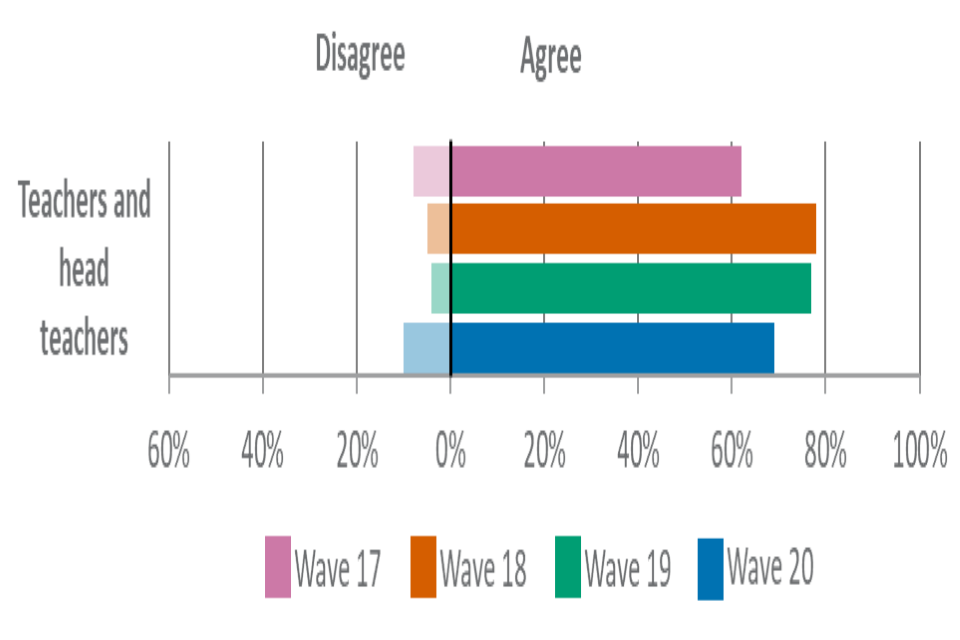
| Respondent type | Wave 17 | Wave 18 | Wave 19 | Wave 20 |
|---|---|---|---|---|
| Teachers and head teachers – agree | 62% | 78% | 77% | 69% |
| Teachers and head teachers – disagree | 8% | 5% | 4% | 10% |
In wave 20, approximately seven in ten (69%) head teachers and teachers agreed they are ‘confident malpractice is properly reported when it happens in Applied General qualifications taught in schools and colleges’. This was broadly comparable with wave 19 (figure 55).
Figure 55. Results for “I am confident malpractice is properly reported when it happens in Applied General qualifications taught in schools and colleges.”

| Respondent type | Wave 17 | Wave 18 | Wave 19 | Wave 20 |
|---|---|---|---|---|
| Teachers and head teachers – agree | 59% | 71% | 65% | 69% |
| Teachers and head teachers – disagree | 13% | 10% | 9% | 10% |
Section 11: Innovations
Onscreen examinations
For the following 2 survey items the wave 20 effective base was: All responses (N=2,106); Young people (N=293); Parents (N=251); Teachers (N=576); Head teachers (N=214); HEIs (N=225); Employers (N=250); General public (N=979).
As shown in figure 56, approximately a third (32%) of respondents in wave 20 agreed that ‘onscreen examinations in GCSE and A levels would be fairer for students’. This was an increase in comparison with wave 19 (29%). Among young people, agreement increased to 47% from 34% in wave 19, which was broadly comparable with the wave 18 figure.
Figure 56. Results for “Onscreen examinations (e.g. exams taken on a computer) in GCSE and A level qualifications would be fairer for students than existing pen and paper examinations.”


Note: In wave 20, the question text changed to remove reference to AS levels.
| Respondent type | Wave 18 | Wave 19 | Wave 20 |
|---|---|---|---|
| All – agree | 31% | 29% | 32% |
| All – disagree | 30% | 29% | 31% |
| General public – agree | 28% | 25% | 28% |
| General public – disagree | 29% | 31% | 32% |
| Young people – agree | 48% | 34% | 47% |
| Young people – disagree | 23% | 28% | 26% |
| Parents – agree | 33% | 33% | 35% |
| Parents– disagree | 23% | 20% | 26% |
| Head teachers – agree | 23% | 27% | 29% |
| Head teachers – disagree | 36% | 37% | 33% |
| Teachers – agree | 27% | 26% | 24% |
| Teachers – disagree | 36% | 36% | 41% |
| HEIs – agree | 25% | 28% | 34% |
| HEIs – disagree | 35% | 30% | 29% |
| Employers – agree | 32% | 30% | 28% |
| Employers – disagree | 29% | 23% | 26% |
In total, two in five (40%) respondents agreed that ‘onscreen examinations in GCSE and A level qualifications would be more manageable for schools and colleges’. This represented an increase in comparison with wave 19 (36%) but was comparable with wave 18 (39%).
In wave 20, agreement increased from 13% in wave 19 to 23% for head teachers, and from 20% in wave 19 to 25% for teachers (figure 57).
Figure 57. Results for “Onscreen examinations (e.g. exams taken on a computer) in GCSE and A level qualifications would be more manageable for schools and colleges than existing pen and paper examinations.”
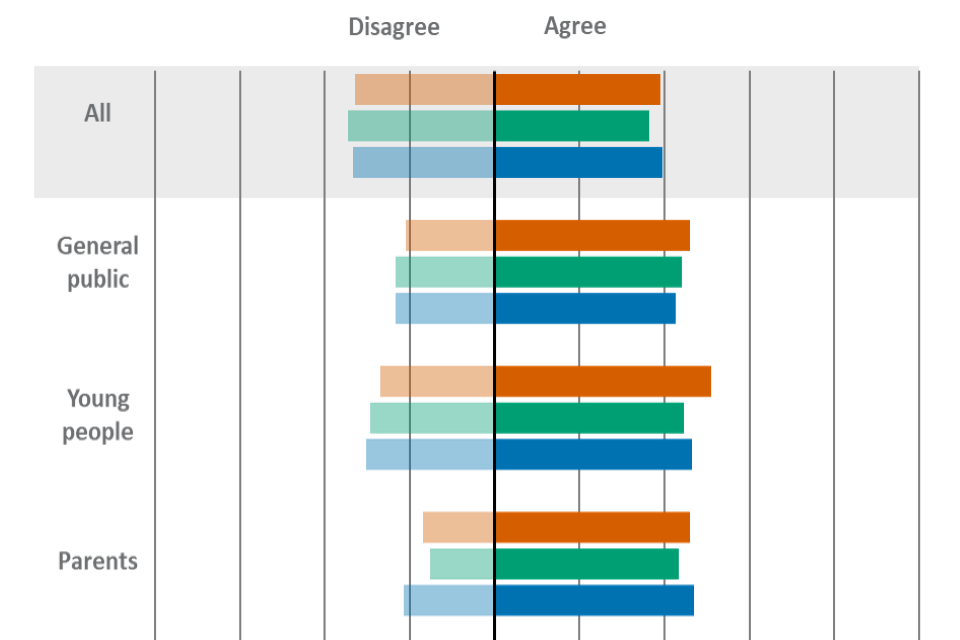
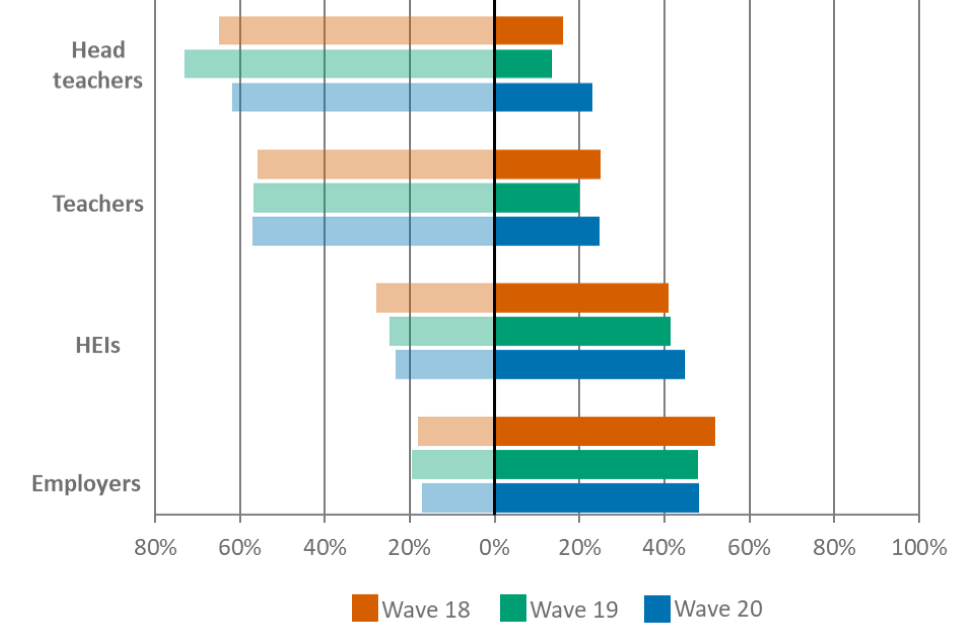
Note: In wave 20, the question text changed to remove reference to AS levels.
| Respondent type | Wave 18 | Wave 19 | Wave 20 |
|---|---|---|---|
| All – agree | 39% | 36% | 40% |
| All – disagree | 33% | 35% | 33% |
| General public – agree | 46% | 44% | 43% |
| General public – disagree | 21% | 23% | 23% |
| Young people – agree | 51% | 45% | 47% |
| Young people – disagree | 27% | 29% | 30% |
| Parents – agree | 46% | 43% | 47% |
| Parents– disagree | 17% | 15% | 21% |
| Head teachers – agree | 16% | 13% | 23% |
| Head teachers – disagree | 65% | 73% | 62% |
| Teachers – agree | 25% | 20% | 25% |
| Teachers – disagree | 56% | 57% | 57% |
| HEIs – agree | 41% | 41% | 45% |
| HEIs – disagree | 28% | 25% | 23% |
| Employers – agree | 52% | 48% | 48% |
| Employers – disagree | 18% | 19% | 17% |