Pensioners’ Incomes Series: financial year 2019 to 2020
Published 25 March 2021

© Crown copyright 2021
This publication is licensed under the terms of the Open Government Licence v3.0 except where otherwise stated. To view this licence, visit nationalarchives.gov.uk/doc/open-government-licence/version/3 or write to the Information Policy Team, The National Archives, Kew, London TW9 4DU, or email: psi@nationalarchives.gov.uk.
Where we have identified any third party copyright information you will need to obtain permission from the copyright holders concerned.
This publication is available at https://www.gov.uk/government/statistics/pensioners-incomes-series-financial-year-2019-to-2020/pensioners-incomes-series-financial-year-2019-to-2020
This report examines how much income pensioners get each week and where they get that income from. It looks at how their incomes have changed over time and variations in income between different types of pensioners.
The population age distribution has changed a lot since the start of this series in financial year ending 1995 (FYE 1995) and pensioners now make up a larger proportion of the overall population.
Changes in the economy and to the benefit system mean that the amount and components of pensioners’ average weekly incomes have changed over time. These statistics look at these changes.
1. Main story
Pensioners’ incomes have been stable for ten years.
Average weekly income of pensioners (AHC) in financial year ending 2020 prices (£)
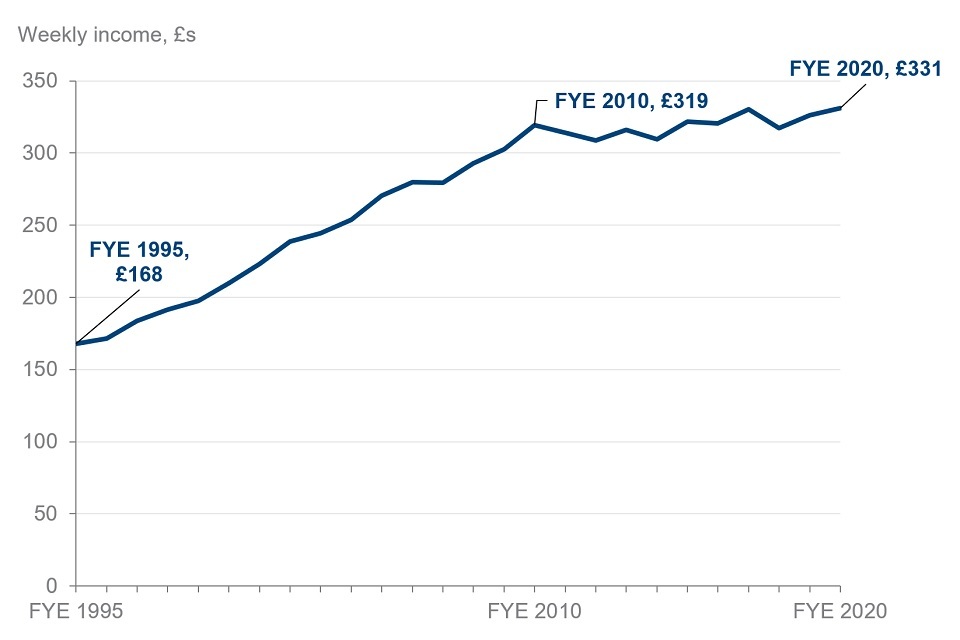
In FYE 2020, pensioners had similar average incomes after housing costs (AHC) to FYE 2010, with £331 and £319 respectively. The average income increased between the start of the series in FYE 1995, when it was £168, and FYE 2010. This increase is statistically significant.
Younger pensioners had higher incomes than older pensioners.
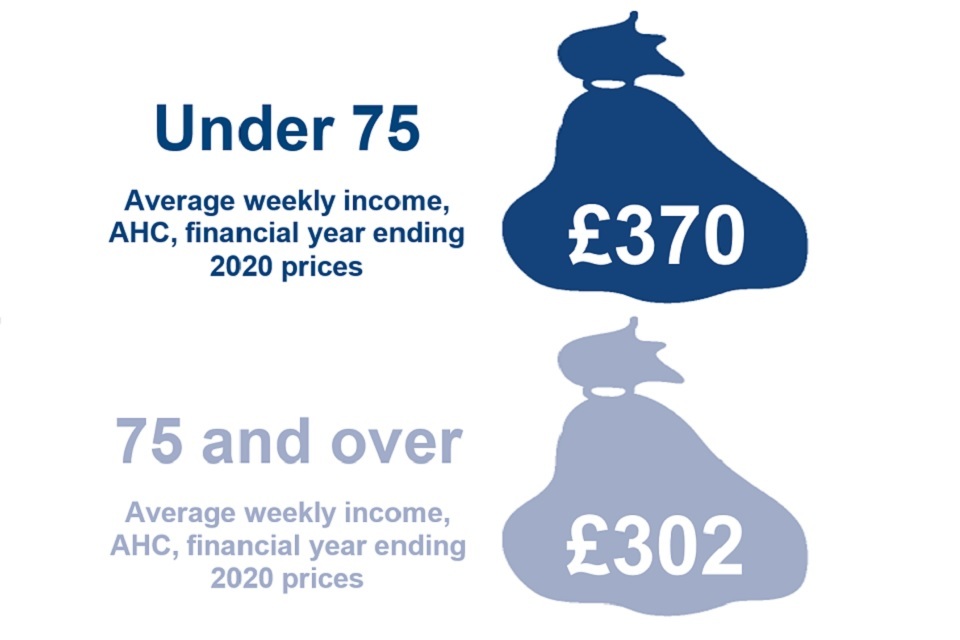
In FYE 2020, pensioners where the head was under 75 had average weekly incomes of £370. This was higher than those where the head was 75 or over, who had average weekly incomes of £302. This difference is statistically significant.
Fewer pensioners are receiving income-related benefits.
Percentage of pensioners receiving income-related benefits, financial years ending 1995, 2010 and 2020
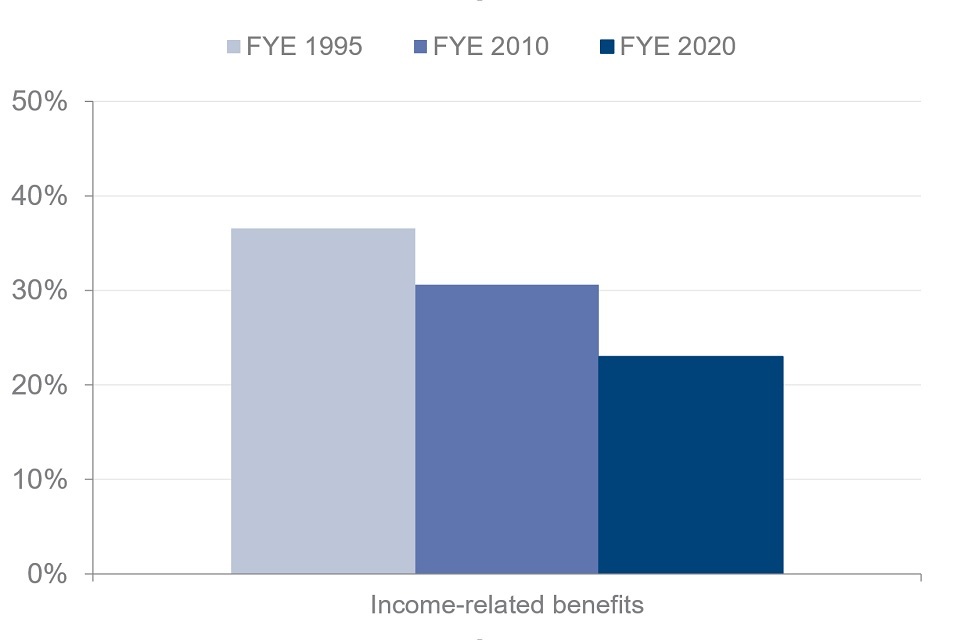
The percentage of pensioners in receipt of income-related benefits in FYE 2020 was 23%. This has been decreasing since the survey began in FYE 1995 when 37% of pensioners were in receipt of such benefits.
Thirty-one per cent of pensioners were in receipt in FYE 2010. The decrease between FYE 1995 and 2010, and the decrease between FYE 2010 to 2020 are both statistically significant.
2. What you need to know
The Pensioners’ Incomes (PI) Series contains estimates of the levels, sources and distribution of pensioners’ incomes. It also examines the position of pensioners within the income distribution of the population as a whole. The statistics are used by government departments, local authorities, academics, journalists and the voluntary sector. As of this release, there are 26 years of data in the time series.
In this report we measure income for pensioners. Pensioners consist of single pensioners and pensioner couples. A pensioner couple means at least one person in the couple is over State Pension age. Estimates do not reflect income from others in a household, but do include income from working-age partners who are part of a pensioner couple. Therefore, if a pensioner lives with their adult children, the children’s income is not included in this analysis.
The head of a pensioner unit is the member of the household with the highest income if that person is part of the pensioner unit. Otherwise, the head is the first person named in the survey who is part of the pensioner unit. Pensioners that have ‘recently reached State Pension age’ have a head within 5 years of the State Pension age (SPa) at the time of the interview.
Income measures
Except where otherwise stated, we use the unequivalised income of pensioners, estimated both before and after housing costs (BHC and AHC). Income AHC is derived by subtracting rent, water rates and charges, structural insurance premiums, mortgage interest payments and ground rent, and service charges from income BHC. Unless otherwise stated for certain income breakdowns, we use median income as our measure of average income, as the mean is often biased upwards by extremely high values. We also use AHC figures unless otherwise stated, as this is a better reflection of pensioners’ disposable incomes.
All income estimates have been adjusted for inflation. PI uses variants of the Consumer Prices Index (CPI) to adjust for inflation, to look at how incomes change over time in real terms. For example, if average incomes rose by three per cent in cash terms but inflation was higher at five per cent, we would record a fall in average incomes as the real purchasing power of incomes would have fallen.
See a full breakdown of how we measure income in the ‘About these statistics’ section of this publication.
Survey data
PI estimates are based on a sample of around 7,000 pensioners in private households in the UK, taken from the Family Resources Survey (FRS).
The FRS is conducted across the full financial year, so the data in this report is broken down into financial years. The use of survey data means that the results in this report are subject to sampling variation. This affects how changes should be interpreted, especially over short time periods. Latest estimates should be considered alongside medium and long-term patterns rather than year-on-year changes.
As shown in Table M1.2 of the Background Information & Methodology Note, comparisons over a single year are rarely statistically significant. Users are advised to draw conclusions from long-term trends rather than year-on-year changes.
Data is for the UK from FYE 2003 onwards. Data from earlier years is for Great Britain only.
Statistical significance is a technical concept that says whether a reported change is likely to have arisen only by chance due to variations in the sampling. We calculate 95% confidence intervals around estimates in PI. This sets a standard that, where any change is reported as statistically significant, there is less than a one in 20 chance that the reported difference is due to sampling variation and there is no real underlying change. Statistically significant differences are clearly stated in the text. Other differences are not significant or have not been tested.
Additional tables and data
A comprehensive set of reference tables breaking down headline results presented in this report are available. These tables are referenced throughout this report and show results for various demographic characteristics across the 26 years of the time series. Further breakdowns of the PI data can be created on Stat-Xplore.
The PI dataset is available to download via the UK Data Service.
Impact of COVID-19
The data in this report are from interviews conducted between April 2019 and March 2020. Interviews were suspended in mid-March 2020 in line with the national lockdown. At this point, nearly a full year’s worth of FRS interviews had already taken place and there is no material impact of COVID-19 upon these results.
FRS 2019 to 2020 forms a key, pre-pandemic baseline of household incomes.
3. Overall Income Trends
Average pensioner incomes were stable between FYE 2009 to 2020.
Average weekly income of pensioners (AHC) in financial year ending 2020 prices (£)
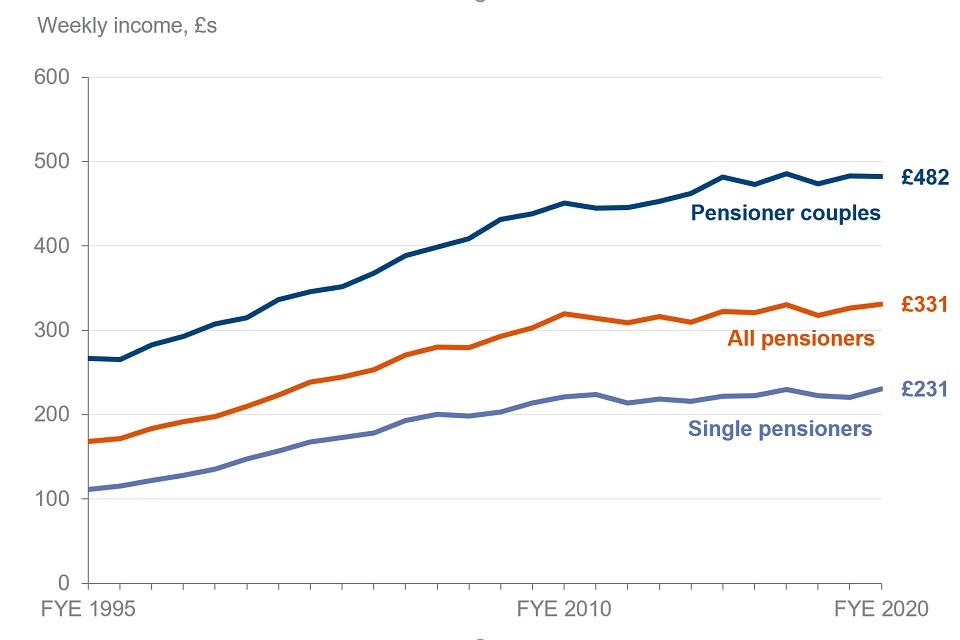
After the deduction of direct taxes, other payments such as pension contributions, and housing costs, the average income of all pensioners in FYE 2020 was £331 per week. This was similar to the average income in FYE 2010, when it was £319 per week.
There was a statistically significant increase in the average income of all pensioners from FYE 1995, when it was £168 per week, to FYE 2010. This change reflected growth in income from benefits, including the State Pension, as well as increased income from occupational pensions.
In FYE 2020, the average income for pensioner couples was £482 per week. This was more than twice that of single pensioners, who had an average income of £231 per week. This difference is statistically significant.
See Table 2.1 for full data.
Pensioner couples are less reliant on benefit income than single pensioners.
Percentage of gross mean income from different sources, financial year ending 2020
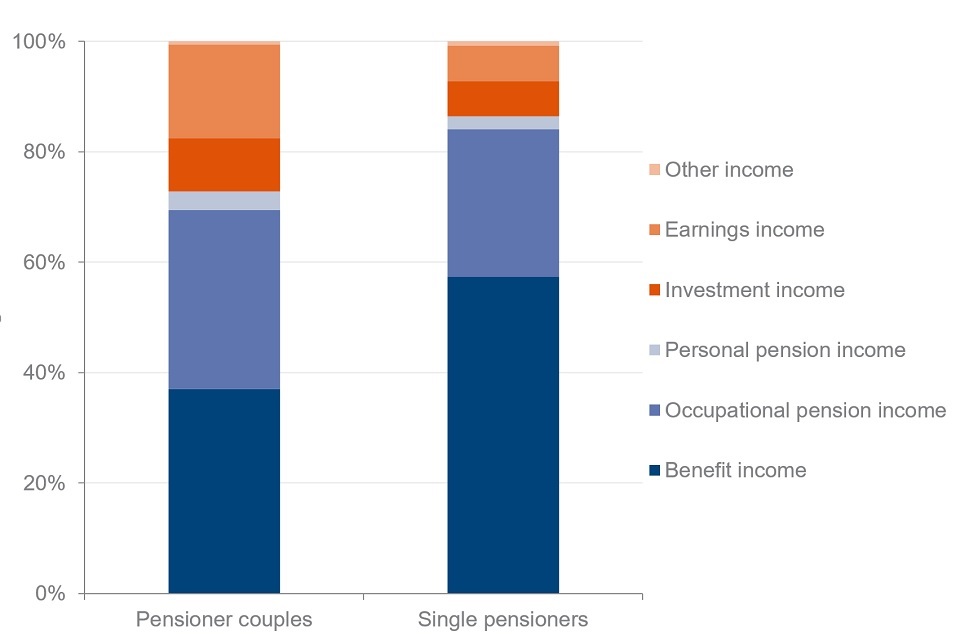
Pensioners receive income from a range of different sources. Changes in the composition of pensioners’ incomes reflect underlying economic factors.
In FYE 2020, benefit income, which includes State Pension, was the largest component of total gross income for both pensioner couples and single pensioners. This was 57% for single pensioners, while for pensioner couples it was 37%.
Income from occupational pensions was 32% of total gross income for pensioner couples and 27% for single pensioners.
Income from earnings made up six per cent of total income for single pensioners. For pensioner couples, 17% of total income was from earnings. Twenty-six per cent of pensioner couples contained one adult below State Pension Age. For some of these couples, the adult below State Pension age contributed to the earnings income.
Earnings income made up 38% of total income for pensioner couples where one partner was over State Pension age and one was under it. For couples where both partners were over State Pension age, this was only nine per cent.
See Tables 2.1, 5.1 and 5.3 for full data.
Older pensioners had lower incomes than younger pensioners on average.
Average weekly income of pensioners (AHC) in financial year ending 2020 prices (£)
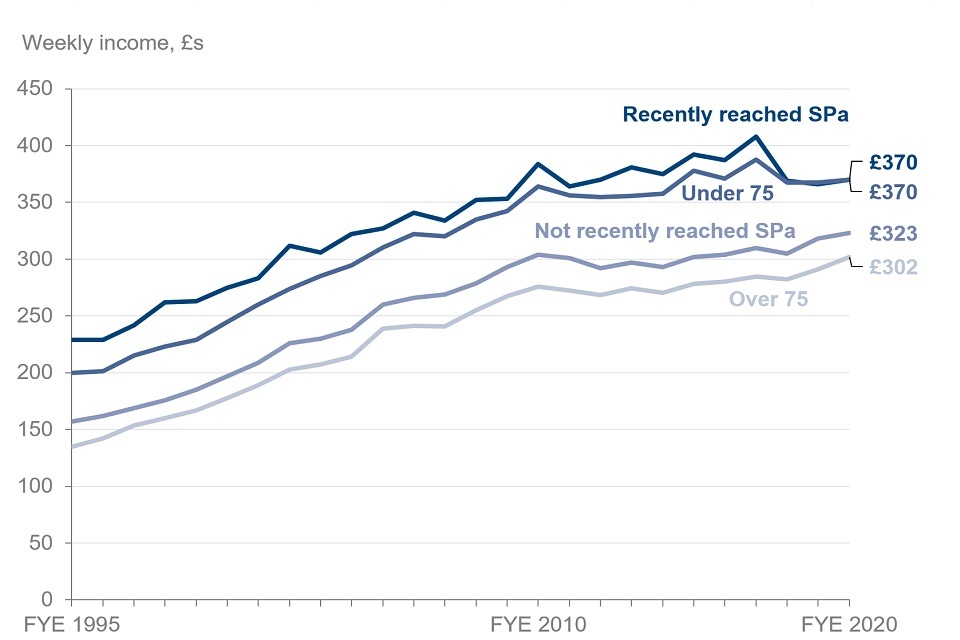
In FYE 2020, pensioners where the head was under 75 had higher average incomes than those where the head was 75 or over. Their average incomes were £370 and £302 per week, respectively. This difference is statistically significant.
Pensioners where the head was within 5 years of the State Pension age (SPa), classified as ‘recently reached State Pension age’, had higher incomes than those who had not recently reached State Pension age. The average income for pensioners who recently reached SPa was £370, compared to £323 for those who did not reach SPa recently. This difference is statistically significant. Pensioners who recently reached SPa are also included in the ‘Under 75’ age group. These two groups have had comparable incomes in the last three years.
In FYE 2020, 62% of pensioners where the head was 75 or over were single pensioners. On average, single pensioners had lower incomes. The average income for single pensioners aged under 75 was £221 per week. This was less than the average income for single pensioners aged 75 or over, which was £234 per week. More information about single pensioners’ incomes can be found further down in this section.
See Tables 1.2, 2.6, 2.7 and 2.12 for full data.
Older pensioners are more reliant on benefit income.
Percentage of gross mean income from different sources, financial year ending 2020
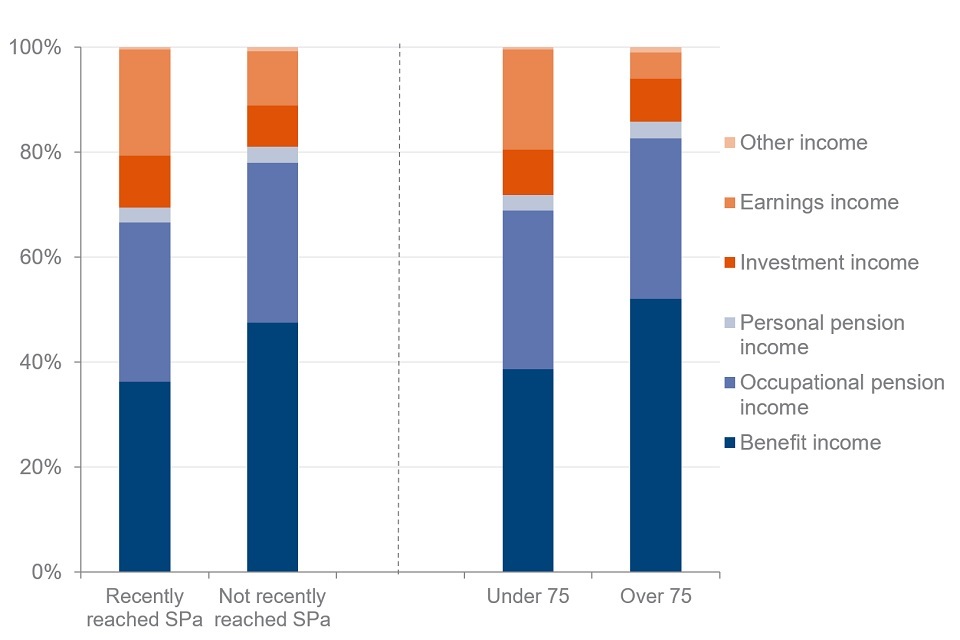
Benefit income, which includes State Pension, made up more than half (52%) of total gross income for pensioners where the head was aged 75 or over and 48% of total gross income for pensioners who have not recently reached SPa. Whereas, for pensioners who did recently reach SPa and pensioners where the head was under 75, benefit income made up 36% and 39% of gross income respectively.
The proportion of gross income that was made up of occupational pension income was very similar for all four groups of pensioners by age, at around 30%. Occupational pension income was higher for the younger age groups, however, these groups also have higher overall incomes, resulting in the percentage contribution of their occupational pension income being slightly smaller.
Earnings income accounted for 20% of total gross income for pensioners who recently reached SPa and 19% for pensioners where the head was under 75. For pensioners who haven’t retired recently, this was 10%, and where the head was aged 75 or over, it was five per cent. Because older pensioners are less likely to be in work, on average they receive a smaller amount from earnings.
Incomes from personal pensions and investments were similar percentages of total gross income for all groups.
See Tables 2.7 and 2.12 for full data.
Single men continue to have higher incomes than single women.
Average weekly income of pensioners (AHC) in financial year ending 2020 prices (£)
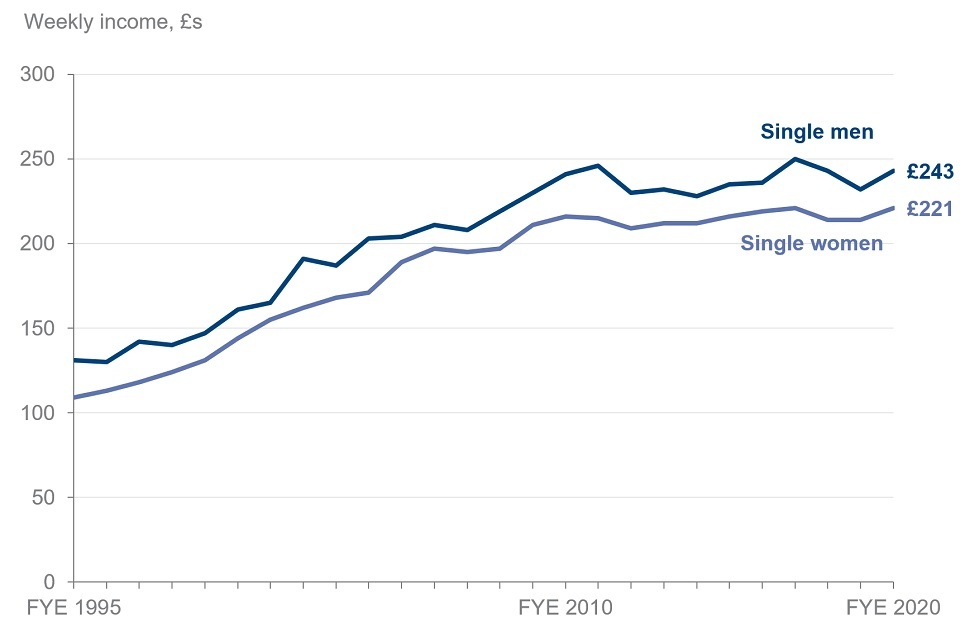
Single male pensioners had higher average incomes than single female pensioners in FYE 2020. Single men had an average weekly income of £243 and single women had an average income of £221.
The average weekly incomes of both single men and single women were similar in FYE 2020 to what they were in in FYE 2010, when they were £241 and £216 respectively.
See Table 2.8 for full data.
Nearly two thirds of the total income for single female pensioners was benefit income.
Percentage of gross mean income from different sources, financial year ending 2020
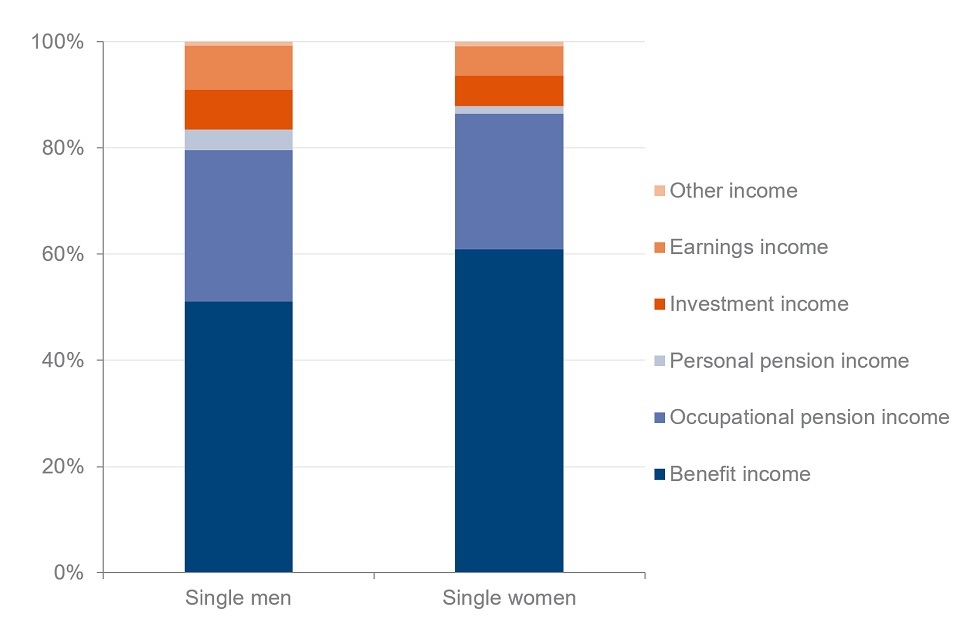
The difference in incomes between single male and single female pensioners reflects differences in the components that make up individuals’ total gross income.
In FYE 2020, benefit income, which includes State Pension, made up 61% of total gross income for single women. For single men, this value was 51%.
Twenty-nine per cent of total gross income for single men came from occupational pensions. For single women, this was 26%.
Income from earnings made up eight per cent of total gross income for single men. For single women, this was five per cent. Single female pensioners being older on average may be a contributing factor here, as they may be less likely to work.
See Table 2.8 for full data.
4. Regional Differences
Pensioner incomes differed between regions and countries.
When looking at regional incomes, we use the average weekly income (AHC) for each region over the three-year period FYE 2018 to 2020, adjusted to FYE 2020 prices.
Average weekly income (AHC) of pensioner couples by region or country, relative to the UK average, financial year ending 2018 to 2020
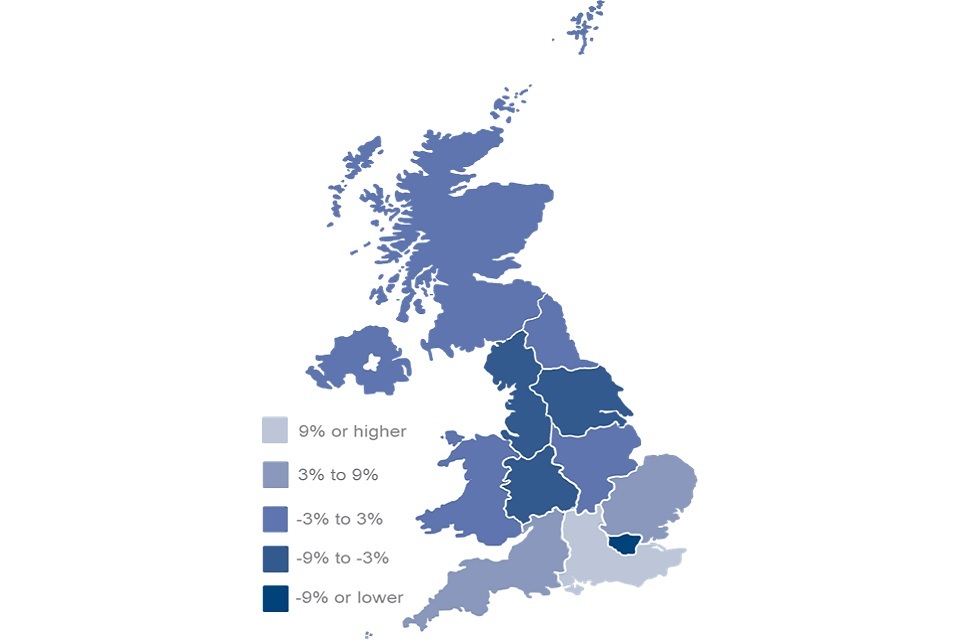
In the majority of regions in England, pensioner couples had average weekly incomes below the pensioner couples UK average.
The UK average weekly income over the period FYE 2018 to 2020 was £479 for pensioner couples.
On average, pensioner couple incomes were lowest in London, where incomes were 11% below the UK average.
Pensioner couples in the South East had the highest average incomes, 16% higher than the UK average.
Differences between regions are likely to be associated with demographic and economic variations, including housing costs.
See Table 2.4 for full data.
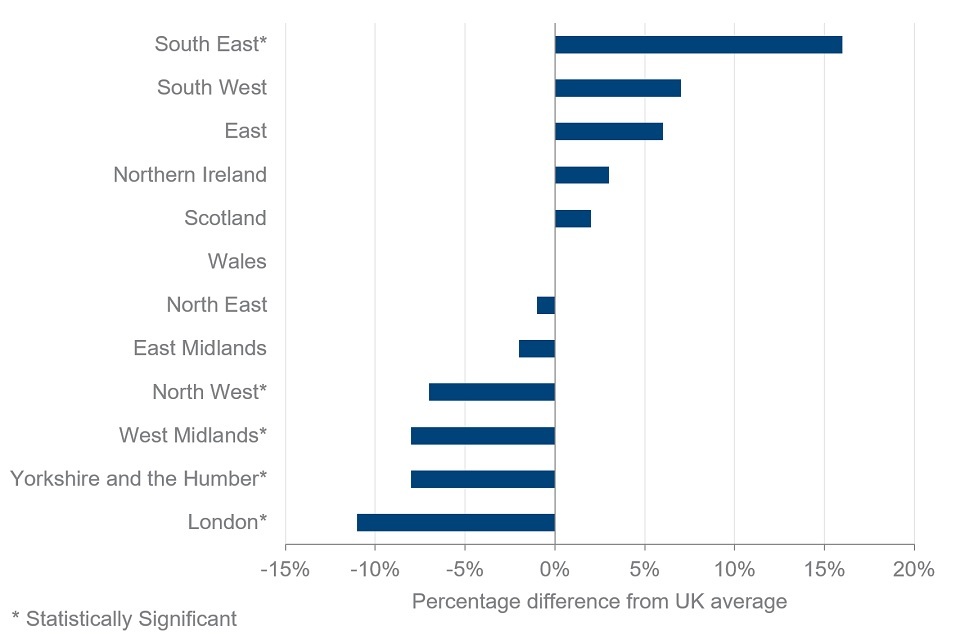
Average weekly income (AHC) of single pensioners by region or country, relative to the UK average, financial year ending 2018 to 2020
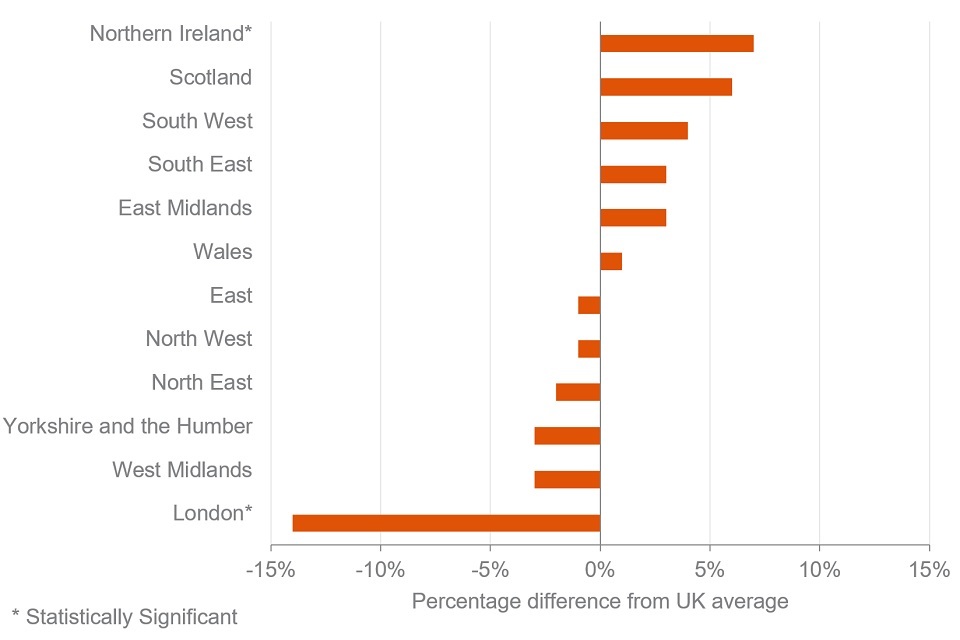
In the period FYE 2018 to 2020, single pensioners in the UK had an average income of £224 per week.
The area with the highest average income for single pensioners was Northern Ireland, where incomes were seven per cent above the UK average, followed by six per cent above the UK average for Scotland.
Single pensioners in London had the lowest average incomes by a large margin. Their incomes were 14% below the UK average.
Differences between regions are again likely to be associated with demographic and economic variations, including housing costs.
See Table 2.4 for full data.
5. Sources of pensioner incomes
Percentage of pensioners receiving income from income-related benefits decreased.
Percentage of pensioners receiving each source of income, financial years ending 1995, 2010 and 2020
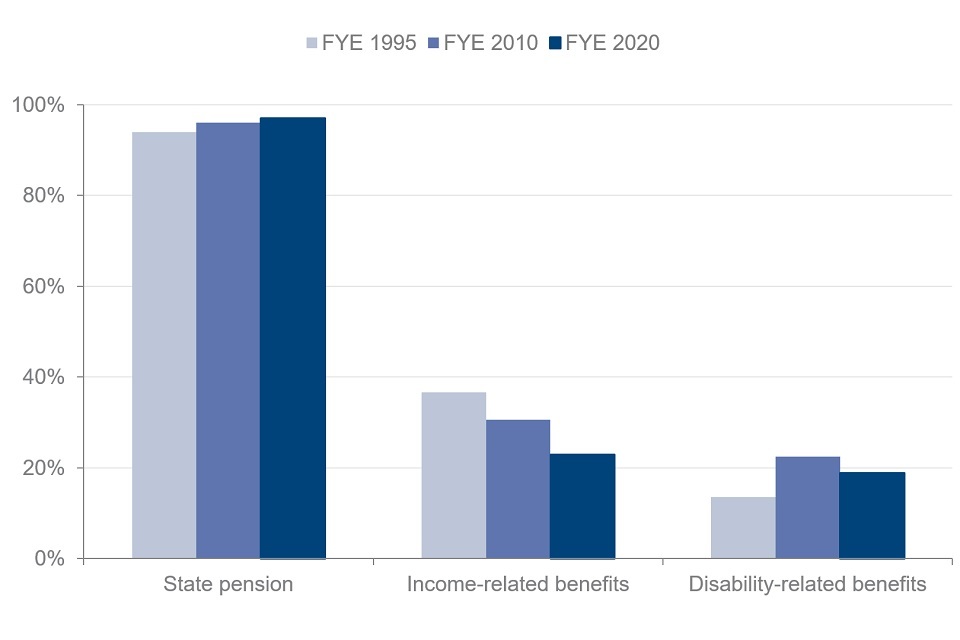
Nearly all pensioners (97%) were in receipt of the State Pension in FYE 2020. This has increased from both FYE 1995 and FYE 2010, when 94% and 96% of all pensioners were in receipt of the State Pension respectively. The increase from FYE 1995 to 2020 is statistically significant.
Income-related benefits were received by 23% of all pensioners in FYE 2020. The percentage of pensioners in receipt of income-related benefits decreased from 37% in FYE 1995, and 31% in FYE 2010. The decreases from FYE 1995 to 2010 and from FYE 2010 to 2020 are both statistically significant. This reflects the overall increase in pensioner income from the State Pension and private pensions over 26 years, because an increase in income reduces eligibility to income-related benefits.
Nineteen per cent of pensioners were in receipt of disability benefits in FYE 2020, compared to 14% in FYE 1995, though this figure was 23% in FYE 2010. The decrease from FYE 2010 to 2020 is statistically significant, though the overall increase from FYE 1995 to 2020 is also statistically significant.
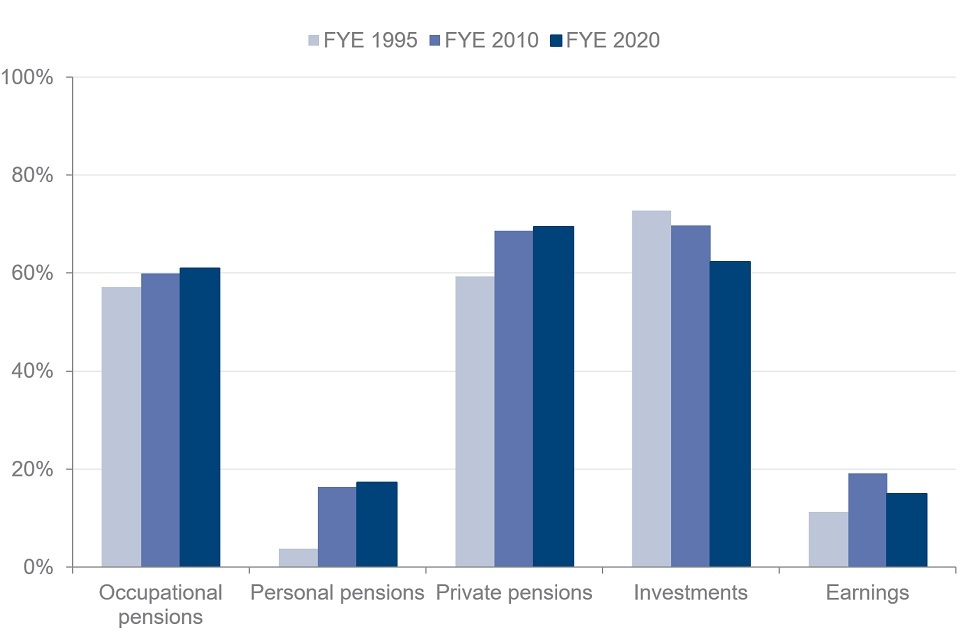
Occupational pension income was received by 61% of pensioners in FYE 2020 – more than in FYE 1995 and FYE 2010 which saw 57% and 60% respectively. The overall increase between FYE 1995 and 2020 is statistically significant.
Personal pensions provided income to a smaller group of pensioners than occupational pensions. In FYE 2020, 17% of pensioners were in receipt of income from personal pensions, compared to 16% in FYE 2010 and four per cent in FYE 1995. The increase between FYE 1995 and 2020 is statistically significant. Personal pensions in their current form were introduced in 1988.
Over the 26-year period FYE 1995 to 2020, there was an increase in pensioners receiving income from private pensions – from 59% to 69%. This increase is statistically significant. This change took place between FYE 1995 and 2010, with FYE 2010 also seeing 69% of pensioners receiving private pension income.
Investment income was received by 62% of all pensioners in FYE 2020. The percentage of pensioners in receipt of investment income has decreased from 70% in FYE 2010. This figure was 73% in FYE 1995. The decreases between FYE 1995 and 2020 and between FYE 2010 and FYE 2020 are both statistically significant.
Fifteen per cent of pensioners were in receipt of earnings in FYE 2020, compared to 11% in FYE 1995, though this figure was 19% in FYE 2010. The decrease between FYE 2010 and 2020 is statistically significant, though the overall increase between FYE 1995 and 2020 is also statistically significant. For some pensioner couples, one adult below State Pension age contributed to the earnings income.
More information about the distribution of income components for those in receipt in FYE 2020 can be found below.
See Tables 3.4 – 3.11 for full data.
Distribution of income from selected income sources for all pensioners in receipt, financial year ending 2020 (£ per week)
State Pension
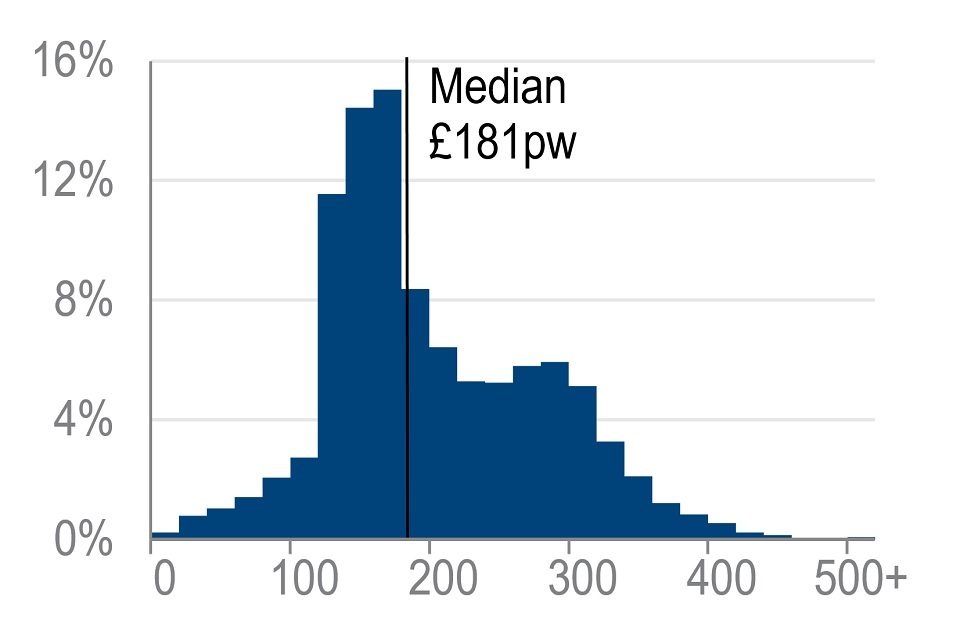
Almost all pensioners (97%) received income from State Pension, with an average amount of £181 per week. Peaks in the distribution may be explained by the basic State Pension rate, which was £129.20 per week in FYE 2020, as well as the new State Pension full rate, which was £168.60.
See Tables 3.4 and 6.1 for full data.
Income-related benefits
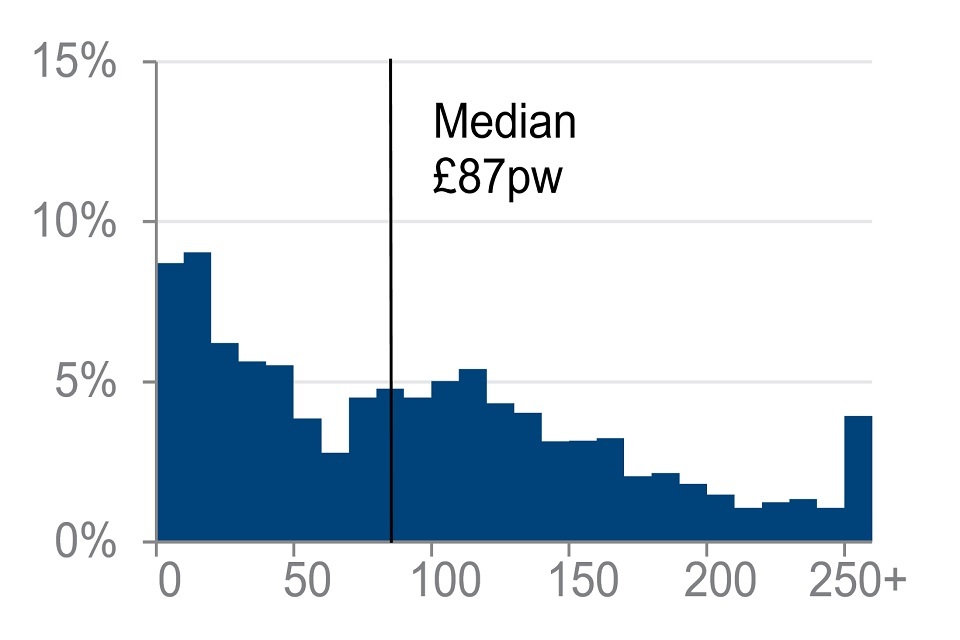
Twenty-three per cent of pensioners were in receipt of income-related benefits. For those in receipt, the average income was £87 per week. Whilst the percentage of pensioners in receipt of income-related benefits has been decreasing over the time series, the median income from this source has risen between FYE 1995 and 2010. In FYE 1995 the median amount for pensioners in receipt of income-related benefits was £50. In FYE 2010 this was £86 and in FYE 2020 this was £87.
See Tables 3.5 and 6.2 for full data.
Disability benefits
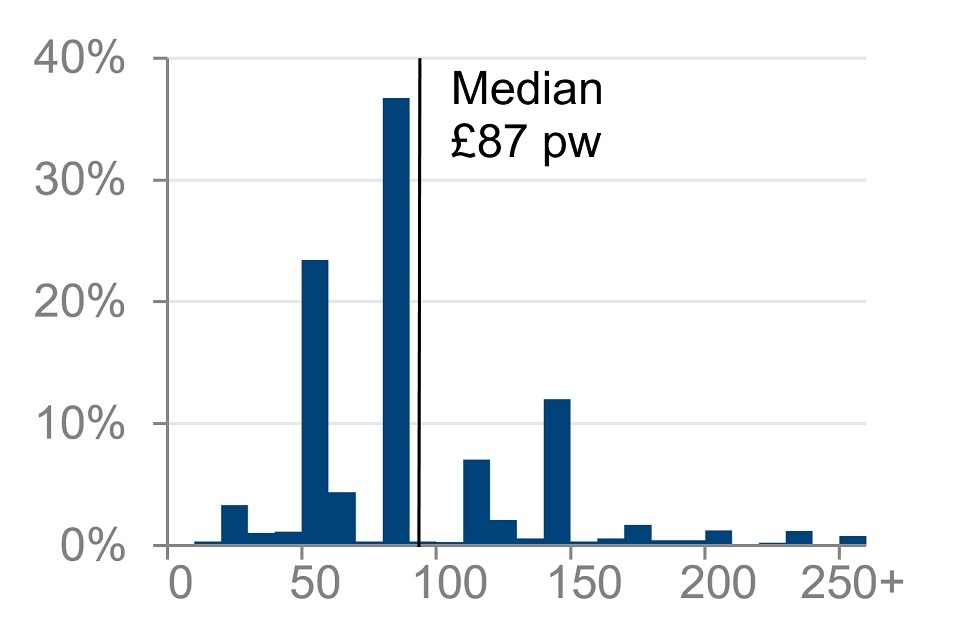
Nineteen per cent of pensioners received disability benefits. The average income for those in receipt was £87 per week. Some benefits have set rates, which may explain peaks in the distribution. For example, Attendance Allowance had a lower rate of £58.70 per week and a higher rate of £87.65 per week in FYE 2020.
See Tables 3.6 and 6.3 for full data.
Occupational pension income
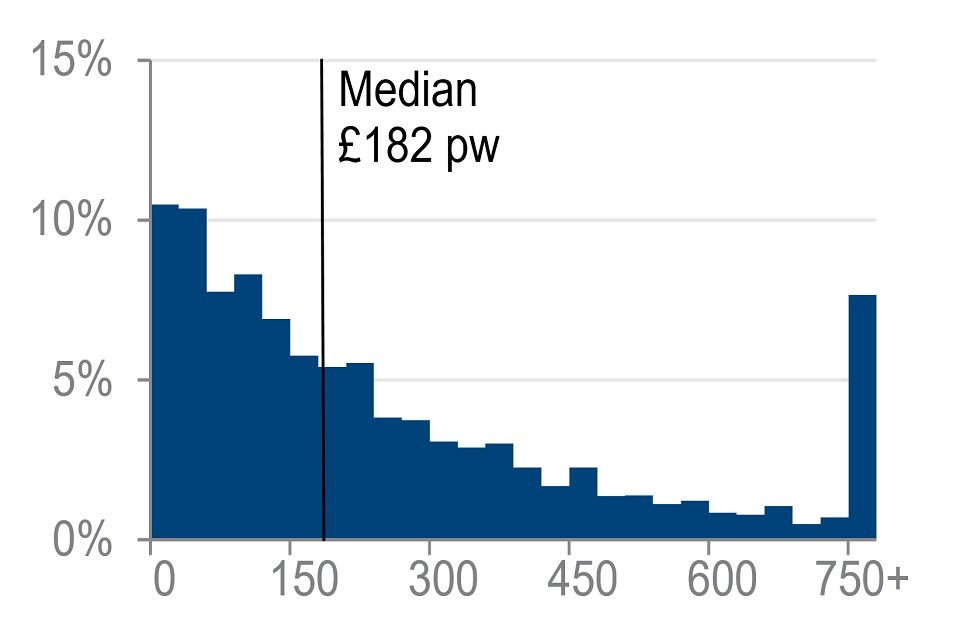
More than half of all pensioners (61%) received occupational pension income. The average amount for these pensioners was £182 per week. Eight per cent of those in receipt had occupational pension income of £750 or more per week.
See Tables 3.7 and 6.4 for full data.
Personal pension income
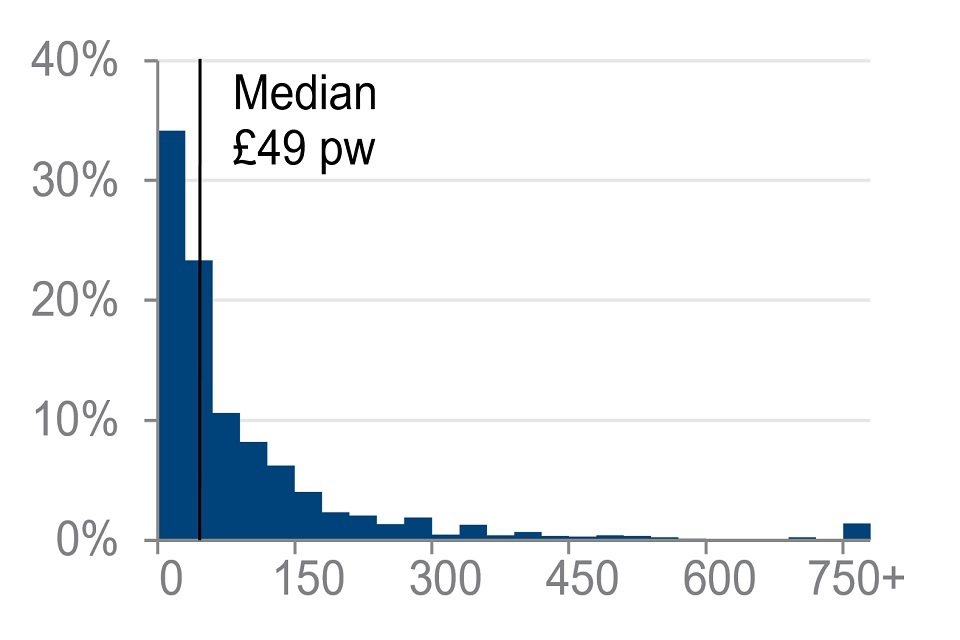
Seventeen per cent of pensioners had income from a personal pension, with an average of £49 per week for those in receipt. Thirty-four per cent of these pensioners had personal pension income of less than £30 per week.
See Tables 3.8 and 6.5 for full data.
Private pension income
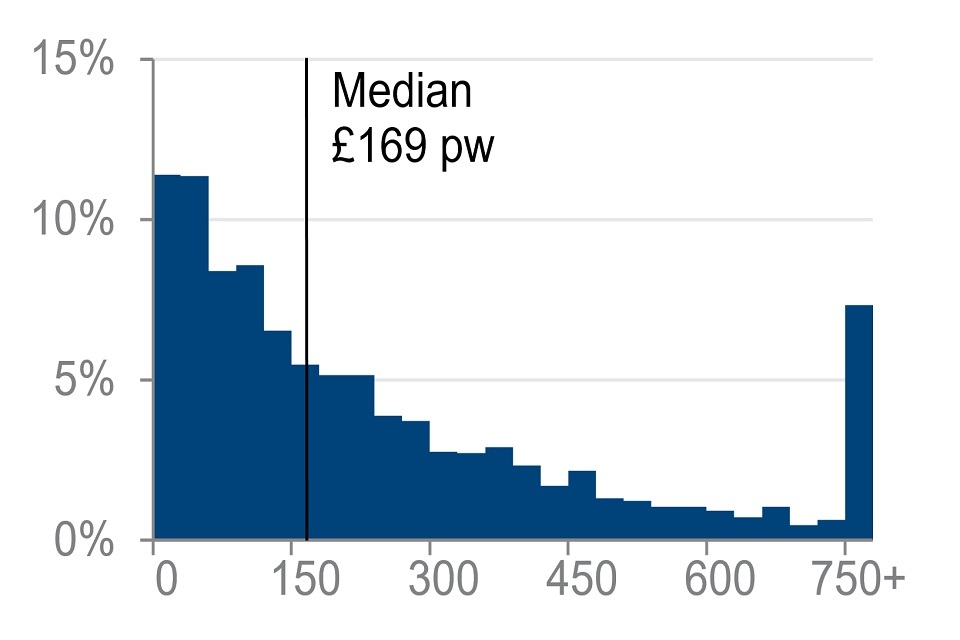
Sixty-nine per cent of pensioners received income from a private pension. The average amount for those in receipt was £169 per week. Seven per cent of those in receipt had private pension income of £750 or more per week.
See Tables 3.9 and 6.6 for full data.
Investment income
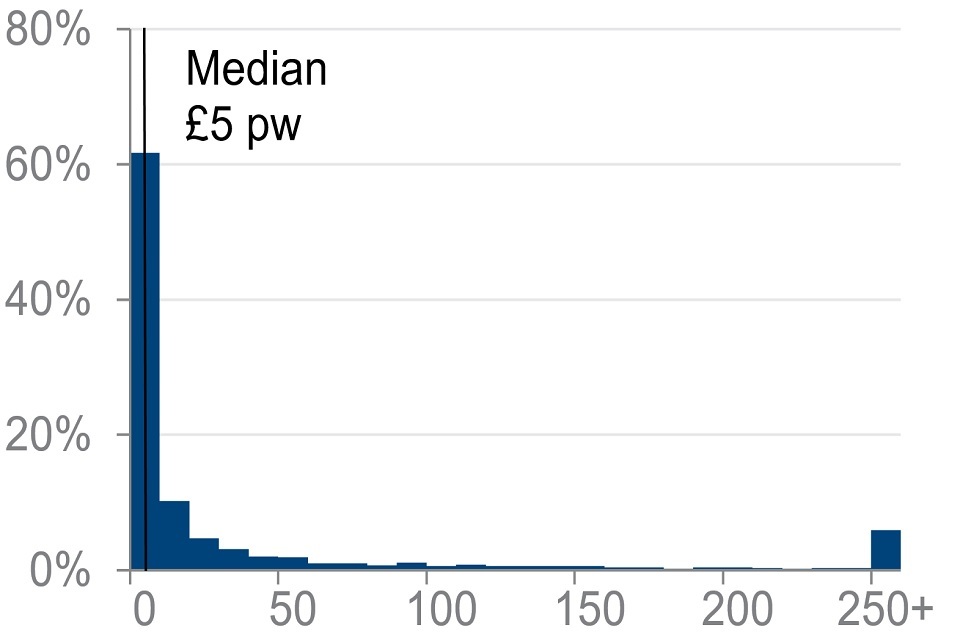
Sixty-two per cent of pensioners were in receipt of investment income, with an average income of £5 per week for those in receipt. Six per cent of these pensioners had a weekly investment income of £250 or more per week.
See Tables 3.10 and 6.7 for full data.
Earnings income
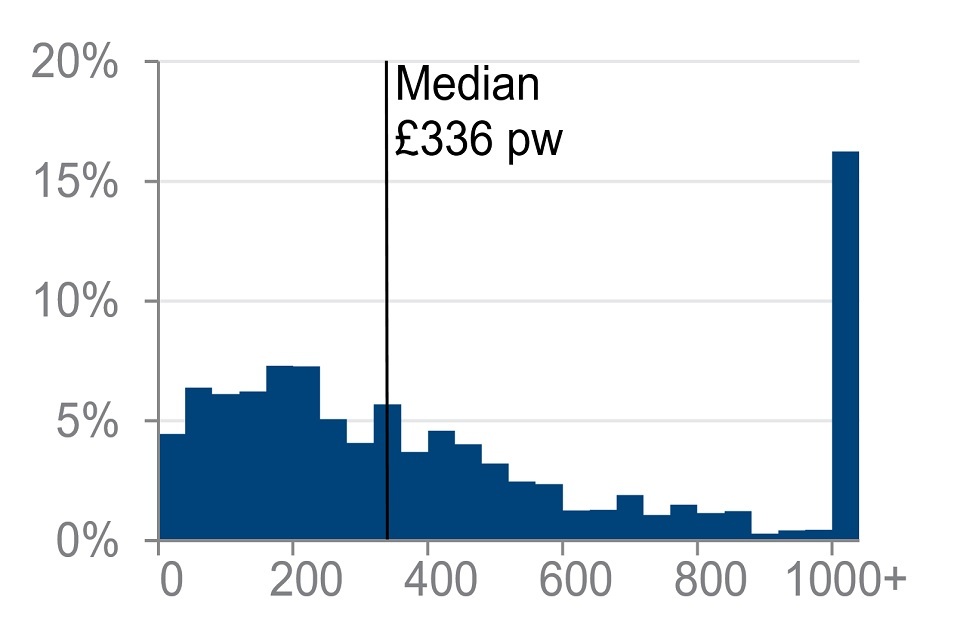
Fifteen per cent of pensioners were in receipt of earnings, with an average income for those in receipt of £336 per week. Sixteen per cent of these pensioners had earnings income of £1,000 or more per week.
See Tables 3.11 and 6.8 for full data.
6. Distribution of pensioners’ incomes
This section looks at the distribution of pensioners’ incomes and where different groups of pensioners sit within it. To do this, pensioners’ incomes are ranked in order, and then the ranked pensioner population is divided into five equal groups of 20%. The top fifth had the highest incomes and the bottom fifth had the lowest. This is calculated separately for couples and single pensioners.
Pensioners’ position within the pensioner income distribution varied by age.
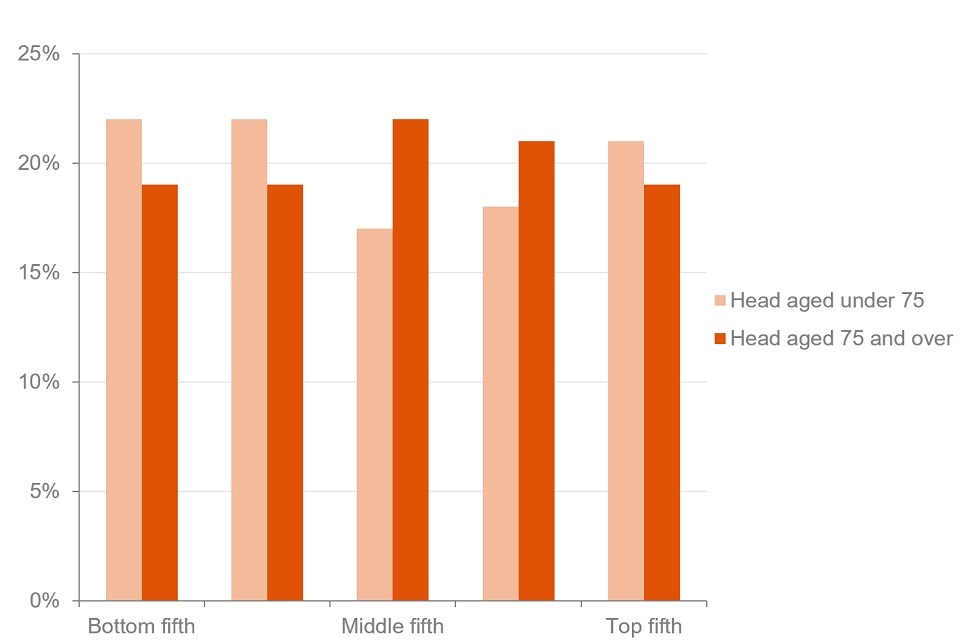
The percentage of pensioners, by age of head, in each fifth of the pensioner couples net income (AHC) distribution, financial year ending 2020
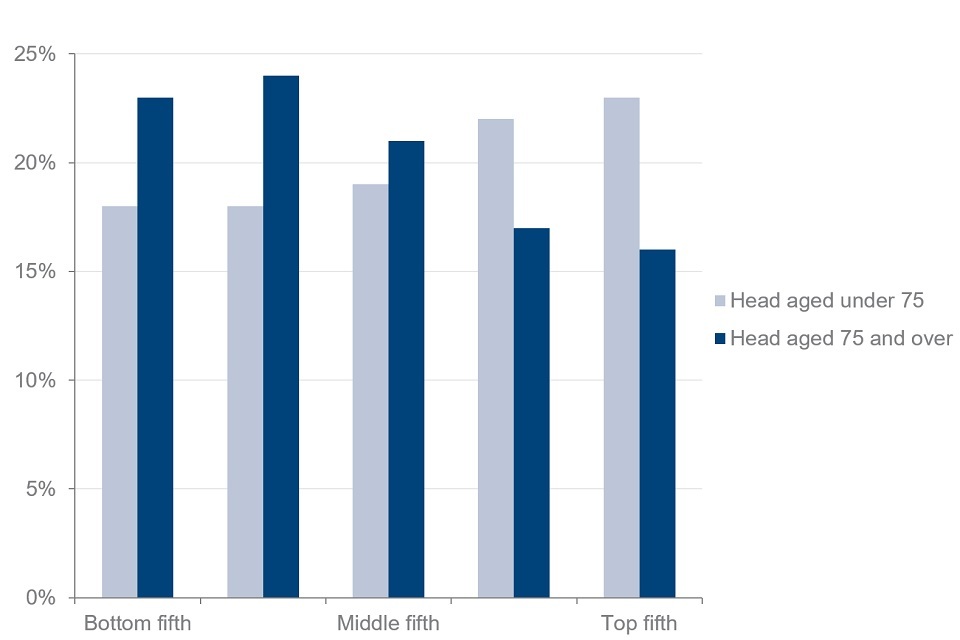
In FYE 2020, 23% of pensioner couples where the head was 75 or over were in the bottom fifth of the pensioner couples’ income distribution. Of couples where the head was under 75, 18% of couples were in the bottom fifth. The top fifth of the income distribution contained 16% of pensioner couples where the head was 75 or over. Twenty-three per cent of pensioner couples with the head under 75 were in the top fifth. This difference is statistically significant.
The percentage of pensioners, by age of head, in each fifth of the pensioner singles net income (AHC) distribution, financial year ending 2020
Twenty-two per cent of single pensioners aged under 75 were in the bottom fifth of the pensioner singles income distribution. For single pensioners aged 75 or over, this figure was 19%. The top fifth of the income distribution contained 21% of single pensioners aged under 75 and 19% of single pensioners 75 or over.
See Table 4.2 for full data.
The sources of pensioners’ incomes differed across the income distribution.
Percentage of gross mean income from different sources for couples and singles in the top and bottom fifths of the pensioner couples or singles net income (AHC) distribution, financial years ending 2018 to 2020
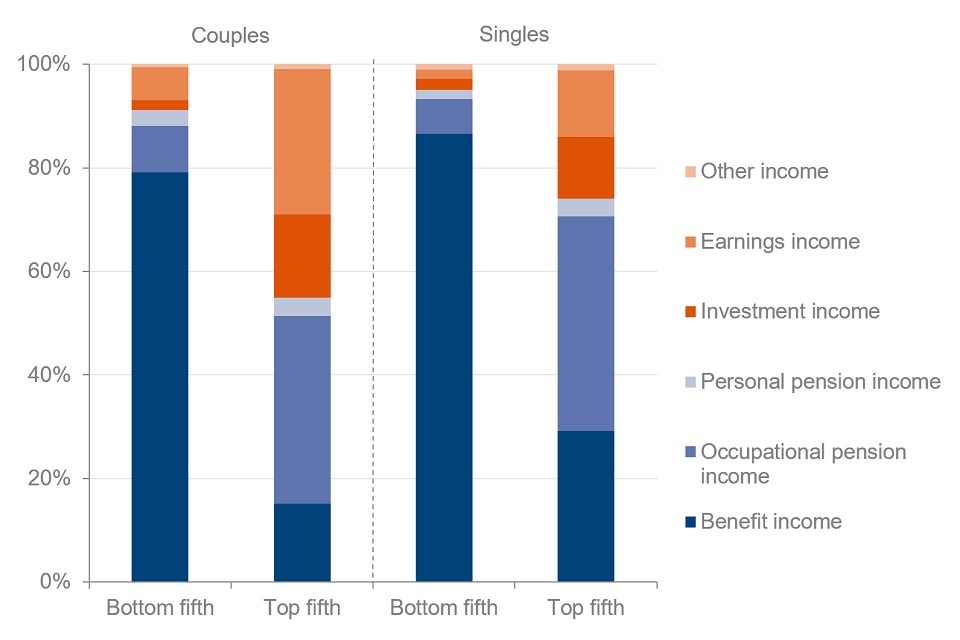
Benefit income, including State Pension income, was the largest source of income for both single pensioners and couples in the bottom fifth of the income distribution over the three-year period FYE 2018 to 2020. For pensioner couples in the bottom fifth, benefit income accounted for 79% of income, while for single pensioners this was 87%.
For the top fifth of both couples and singles, the largest source of income was occupational pension income (36% for couples and 41% for singles). For both couples and singles, the top fifth of the income distribution received a larger percentage of their income from earnings than any other quintile (28% for couples and 13% for singles).
See Table 4.4 for full data.
7. Pensioners’ incomes within the overall income distribution
When looking at the position of individuals in pensioner units within the income distribution of the overall population, we use equivalised income. This means that incomes are adjusted to take account of the size and composition of households. This is the approach used in the Households Below Average Income (HBAI) report, which analyses the overall household income distribution.
The percentage of pensioners in the top fifth of the overall population income distribution is the same as 10 years ago.
The percentage of pensioners in each fifth of the overall population income distribution (AHC), using equivalised income, financial years ending 1995, 2010 and 2020
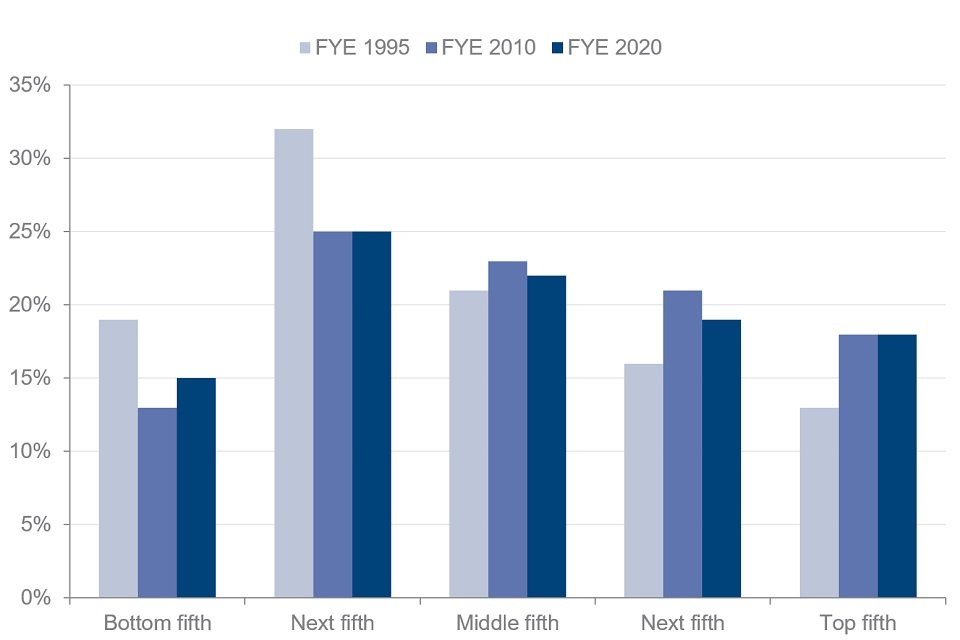
Fewer pensioners were in the bottom fifth of the overall income distribution in FYE 2020 compared to FYE 1995, and more were in the top fifth. The percentage of pensioners in the bottom fifth was 19% in FYE 1995. In FYE 2020, 15% of pensioners were in the bottom fifth. This difference is statistically significant. However, the percentage of pensioners in the bottom fifth of the overall income distribution has risen slightly from FYE 2010, when it was 13%.
Twenty-one per cent of single pensioners and 12% of pensioner couples were in the bottom fifth in FYE 2020. This difference is statistically significant.
In FYE 1995, 13% of pensioners were in the top fifth of the overall income distribution. This increased to 18% in FYE 2020. This difference is statistically significant. This rise took place before FYE 2010, when the figure was also 18%.
More than a fifth of pensioner couples (21%) were in the top fifth in FYE 2020, compared to 14% of single pensioners. This difference is statistically significant.
See Table 4.6 for full data.
The percentage of pensioners in the top half of the overall population income distribution increased since FYE 1995.
Percentage of pensioners in the top half of the overall population income distribution (AHC), using equivalised income, financial years ending 1995 to 2020
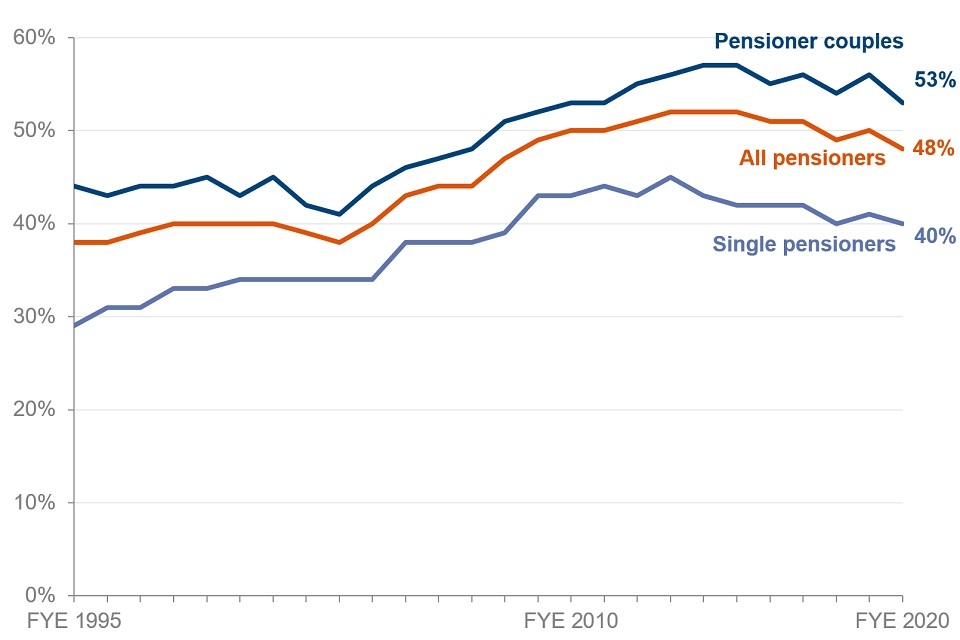
In FYE 2020, 48% of pensioners were in the top half of the overall income distribution. In FYE 1995, this percentage was 38%. This difference is statistically significant. The increase occurred between FYE 1995 and 2010, when 50% of pensioner couples were in the top half.
The percentage of pensioner couples in the top half of the income distribution was 44% in FYE 1995. In FYE 2020, this was 53%. This difference is statistically significant.
Forty per cent of single pensioners in FYE 2020 were in the top half of the income distribution. In FYE 1995, this was 29%. This difference is statistically significant.
See Table 4.7 for full data.
Please note: A minor methodological revision has been made in the FYE 2020 HBAI publication to capture all income from child maintenance in HBAI. This will result in more income from child maintenance being included, which in turn will slightly increase some household incomes and so tend to lower Pensioner Unit positions in the overall income distribution. This means that tables 4.6 and 4.7 from the publication of these statistics will be very slightly different to those published previously.
8. About these statistics
National Statistics Status
National Statistics status means that our statistics meet the highest standards of trustworthiness, quality and public value, and it is our responsibility to maintain compliance with these standards.
The statistics underwent a full assessment against the Code of Practice for Statistics in 2011 and were confirmed as National Statistics in November 2012 by the Office for Statistics Regulation.
Since the latest review by the Office for Statistics Regulation, we have continued to comply with the Code of Practice for Statistics, and have made a number of improvements since the previous publication including:
-
move to HTML: Accessibility (V2 of the Code of Practice) and Innovation and Improvement (V4 of the Code of Practice). We have continued to develop to be easily accessible to all users.
-
additional variables on Stat-Xplore: Relevance to Users (V1 of the Code of Practice), reviewed and expanded the data available. Specifically, we have added variables for ethnicity and region or country.
It is the Department for Work and Pensions’ (DWP) responsibility to maintain compliance with the standards expected of National Statistics.
If DWP becomes concerned about whether these statistics are still meeting the appropriate standards, we will discuss any concerns with the Office for Statistics Regulation. National Statistics status can be removed at any point when the highest standards are not maintained, and reinstated when standards are restored.
Read further information about National Statistics on the UK Statistics Authority website.
DWP considers that all Pensioners’ Incomes statistics in this publication are “Fully Comparable at level A*” of the UK Countries Comparability Scale across countries.
How do we measure income?
The main income measure used in PI is weekly net disposable unequivalised income, calculated for both Before Housing Costs (BHC) and After Housing Costs (AHC). Estimates should therefore only be regarded as broadly indicative of pensioners’ overall living standards. BHC income comprises total income from all sources for all members of the pensioner unit.
Income is net of:
-
Income tax payments and National Insurance contributions
-
Domestic rates or council tax
-
Contributions to pension schemes
-
All maintenance payments
-
Student loan repayments
-
Parental contributions to students living away from home
Income After Housing Costs (AHC) is derived by deducting a measure of housing costs from the overall income measure.
Housing costs include:
-
Rent (gross of housing benefit)
-
Water rates, community water charges and council water charges
-
Mortgage interest payments
-
Structural insurance premiums
-
Ground rent and service charges
When looking at individual income components, figures are calculated from gross income.
Where to find out more
Further outputs and reference tables from PI analysis, alongside our PI Background information and methodology, which gives additional detail on how we estimate the measures reported here, are available on the Pensioners’ Incomes web page for this release.
Analysis of PI Series data from previous years, as well as further guidance and information about the statistics, is also available on the Pensioners’ Incomes web page.
Details of other National and Official Statistics produced by DWP can be found on the DWP website:
Information on alternative sources of data on income and earnings are available on the ONS website.
Further information about the statistics produced on income and earnings by government departments can also be found on the ONS website.
9. Contacts
Feedback on the content, relevance, accessibility and timeliness of these statistics and any non-media enquiries should be directed to:
Statistician: Joanne Burrage
Publication lead: Jack Andrews
Email: pensioners-incomes@dwp.gov.uk
For media enquiries on these statistics, please contact the DWP press office
ISBN: 978-1-78659-307-8