Obesity Profile: short statistical commentary July 2022
Published 5 July 2022
Applies to England

© Crown copyright 2022
This publication is licensed under the terms of the Open Government Licence v3.0 except where otherwise stated. To view this licence, visit nationalarchives.gov.uk/doc/open-government-licence/version/3 or write to the Information Policy Team, The National Archives, Kew, London TW9 4DU, or email: psi@nationalarchives.gov.uk.
Where we have identified any third party copyright information you will need to obtain permission from the copyright holders concerned.
This publication is available at https://www.gov.uk/government/statistics/obesity-profile-update-july-2022/obesity-profile-short-statistical-commentary-july-2022
1. New in this update
The following new indicator has been added showing annual data for England, regions, and upper and lower tier local authorities for 2015 to 2021. This is the first time the percentage of adults (aged 18+) classified as obese indicator has been available in Fingertips.
The following indicators have been updated with England and regional data for both Reception (age 4 to 5 years) and Year 6 (age 10 to 11 years) from the 2020 to 2021 National Child Measurement Programme (NCMP). Prevalence of:
- underweight
- healthy weight
- overweight (including obesity)
- overweight
- obesity (including severe obesity)
- severe obesity
This NCMP data was previously published by NHS Digital on 16 November 2021 but is being added to the Obesity Profile for the first time.
2. Summary
This statistical commentary provides background information on the new and updated indicators in the Obesity Profile on Fingertips and presents England level data.
2.1 Percentage of adults (aged 18+) classified as obese
Obesity is a global and complex public health concern. It is associated with reduced life expectancy and is a risk factor for a range of chronic diseases, including cardiovascular disease, type 2 diabetes, at least 12 kinds of cancer, liver, and respiratory disease, and can also impact on mental health.
Preventing obesity and putting in place support for people who are overweight or living with obesity is a priority for the government. In July 2020 the Department of Health and Social Care published a strategy which outlines actions the government will take to tackle the causes of obesity and help adults and children to live healthier lives.
The best indicator of obesity prevalence for adults comes from the Health Survey for England, which uses measured heights and weights to calculate body mass index (BMI). However, the survey sample size is not sufficient to produce robust estimates at local level and the last published data is from 2019 due to the impact of coronavirus COVID-19 on the survey programme.
The obesity indicator being published here presents local authority estimates from Sport England’s Active Lives Adult Survey data to help inform local action in preventing obesity and supporting people who are overweight or living with obesity. This indicator is a sub-set of the percentage of adults (aged 18+) classified as overweight or obese indicator in the Public Health Outcomes Framework. It uses self-reported heights and weights which are adjusted to be the equivalent of measured heights and weights. The sample size is also sufficiently robust to produce estimates at local level. A detailed description of the methods used to produce this indicator can be found in the definitions data view of the Obesity Profile.
Data from the Active Lives Adult Survey estimates that 25.3% of adults aged 18 and over were living with obesity in November 2020 to November 2021, which is an increase from 24.4% in 2019 to 2020 and 22.7% in 2015 to 2016 (Figure 1). There is large variation in the prevalence of adult obesity across upper tier local authorities in England, ranging from 10.5% to 40.3%.
Figure 1: Trend in the percentage of adults (aged 18+) classified as obese, England, 2015 to 2016 to 2020 to 2021

The Obesity Profile also includes England level data on inequalities for this indicator, displaying data by index of multiple deprivation decile, ethnic group, working status, disability, level of education, socioeconomic class, age and sex.
Figure 2 shows how obesity prevalence varies by age in England, with adults aged between 45 and 84 years having a higher prevalence compared with the England value.
Figure 2: Percentage of adults (aged 18+) classified as obese by age group, England, 2020 to 2021
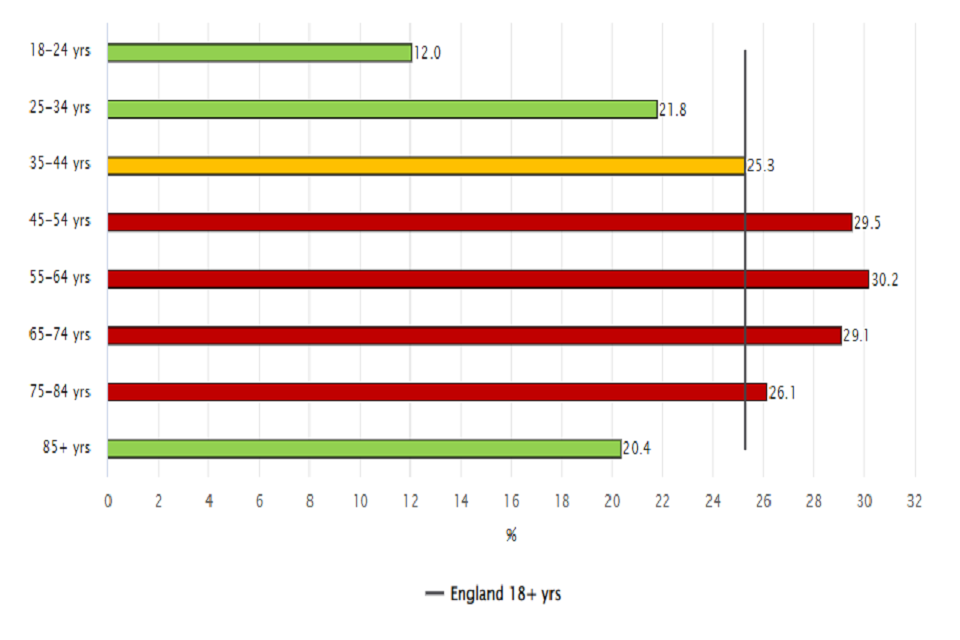
Figure 3 shows the prevalence of obesity in adults aged 18 and over by lower super output area 2011 index of multiple deprivation decile in England. There are clear disparities in the prevalence of obesity with higher prevalence in areas of greater deprivation.
Figure 3: Percentage of adults (aged 18+) classified as obese by deprivation decile, England, 2020 to 2021

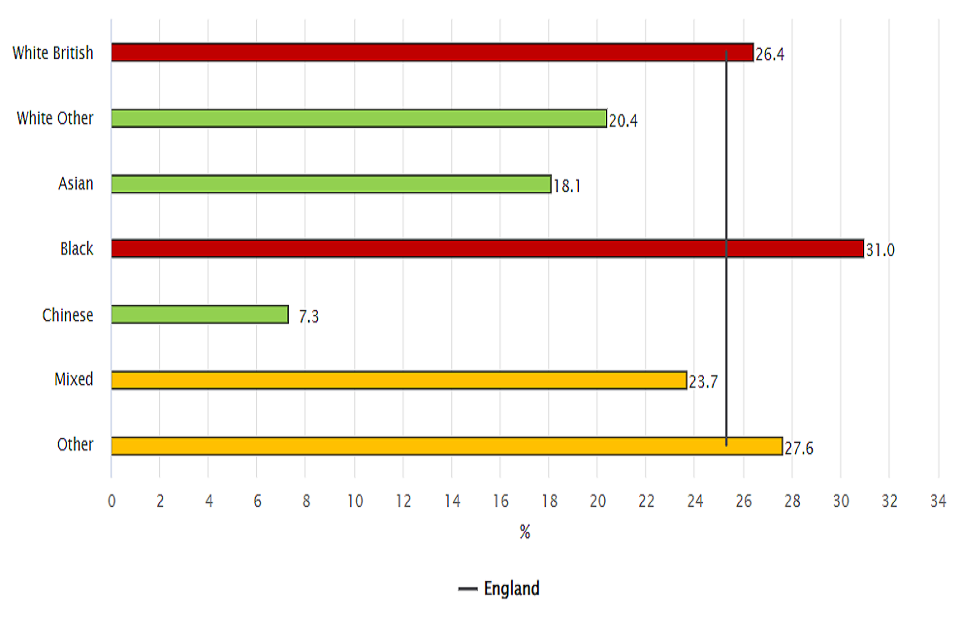
There are also disparities in obesity prevalence by ethnic group. Figure 4 shows that adults from black and white British ethnic groups have a higher prevalence compared with the England value. The prevalence of obesity among people from the Asian ethnic groups is lower than the overall England value, however guidance from the National Institute for Health and Care Excellence (NICE) states that lower BMI thresholds should be used in adults from some black, Asian and other minority ethnic groups to trigger actions to prevent conditions such as type 2 diabetes. The data presented in the Obesity Profile uses the same BMI thresholds for all adults.
Figure 4: Percentage of adults (aged 18+) classified as obese by ethnic group, England, 2020 to 2021
2.2 Update to National Child Measurement Programme indicators
The NCMP is an annual programme that in a normal year measures the height and weight of over 1 million children per year in Reception (aged 4 to 5 years) and Year 6 (aged 10 to 11 years) in mainstream state-funded schools in England. Although the NCMP only covers certain age groups, it normally includes most children in those year groups (usually around 95% of eligible children).
The start of the 2020 to 2021 NCMP was delayed due to the COVID-19 pandemic response. In March 2021 local authorities were asked to collect a representative 10% sample of data because it was not feasible to expect a full NCMP collection so late into the academic year. This sample has enabled national and regional estimates of children’s weight status (including obesity prevalence) for 2020 to 2021 and contributes towards assessing the impact of the COVID-19 pandemic on children’s physical health. As the final sample was not fully representative of the child population, weighting was applied to the analysis to make it comparable to previous years of NCMP data.
The 2020 to 2021 NCMP collection achieved much more than the requested 10% sample; around 300,000 children (25% of previous full measurement years) had their height and weight measured. A small number of local authorities were able to collect more than the requested 10% sample, and local authority data has been published separately for the 25 out of the 152 upper-tier local authorities in England where 75% or more child measurements were submitted compared to previous full measurement years.
In this update to the Obesity Profile the England and regional level data from the 2020 to 2021 NCMP has been added for the Reception and Year 6 indicators for prevalence of underweight, healthy weight, overweight (including obesity), overweight, obesity (including severe obesity) and severe obesity. This data, along with a descriptive commentary, was published by NHS Digital in November 2021. In the NHS Digital report, the region was based on the school location whereas the data in the Obesity Profile on Fingertips is based on child residence; this makes only very small differences to the prevalence data.
The data can be viewed in the NCMP prevalence data ‘Topic’ when ‘England’ or ‘Region’ is selected in the area type dropdown menu when selecting ‘Geography’.
A detailed description of the methods used to produce these indicators can be found in the definitions data view of the Obesity Profile.
3. Further information
A full update to the NCMP prevalence data indicators showing the 2021 to 2022 data is expected in December 2022, following the publication of the annual report and data tables by NHS Digital in November 2022. At this point data for the small number of local authorities with 2020 to 2021 prevalence estimates will also be added.
On 19 July 2022 NHS Digital will publish a short report on provisional data from the 2021 to 2022 NCMP for data submitted between September 2021 and May 2022.
Annual updates of the adult overweight (including obesity) and obesity prevalence indicators are expected to be published in May each year in conjunction with updates to the Public Health Outcomes Framework.
Responsible statisticians: Caroline Hancock, Craig Timpson
For queries relating to this document and the Obesity Profile please contact: PHA-OHID@dhsc.gov.uk