Non-domestic Rating: Business Floorspace Statistical Commentary
Published 15 October 2026
Applies to England and Wales

© Crown copyright 2026
This publication is licensed under the terms of the Open Government Licence v3.0 except where otherwise stated. To view this licence, visit nationalarchives.gov.uk/doc/open-government-licence/version/3 or write to the Information Policy Team, The National Archives, Kew, London TW9 4DU, or email: psi@nationalarchives.gov.uk.
Where we have identified any third party copyright information you will need to obtain permission from the copyright holders concerned.
This publication is available at https://www.gov.uk/government/statistics/non-domestic-rating-business-floorspace-march-2026/non-domestic-rating-business-floorspace-statistical-commentary
This release contains statistics relating to business floorspace for England and Wales as at 31 March 2026. Floorspace statistics were previously published as part of the stock of properties release. In 2024 we published a quality assurance of administrative data report alongside a public consultation into the use of floorspace statistics. In 2025, these statistics were updated to reflect feedback received from the consultation.
The data contained in this report are a subset of the total stock of rateable properties. Further details of properties included and excluded from the statistics, can be found in the background information note. This also includes details of other methodological differences to floorspace statistics prior to 2025, including the use of a different variable to measure total floorspace.
The statistics provide information on floorspace and rateable value per metre squared, broken down by sector and geographic location.
Responsible Statistician
Anna McReady
Statistical enquiries
Date of next publication
Summer 2027
1. Headline figures
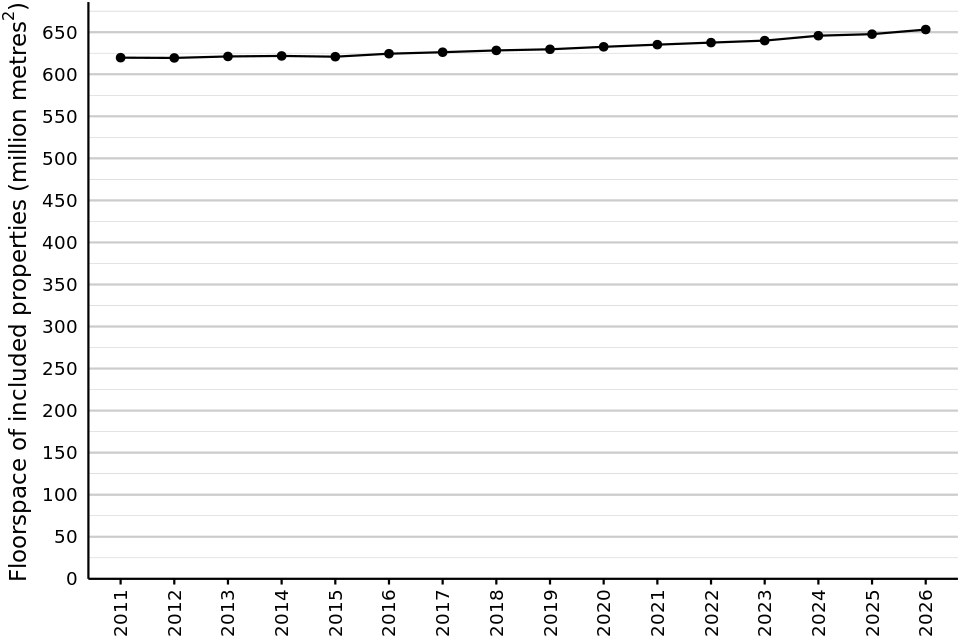
A total of 77% of properties on the NDR rating list are included in these statistics. The total floorspace of these properties at 31 March 2026 was 653.2 million metres squared, up from 647.7 million metres squared at 31 March 2025.
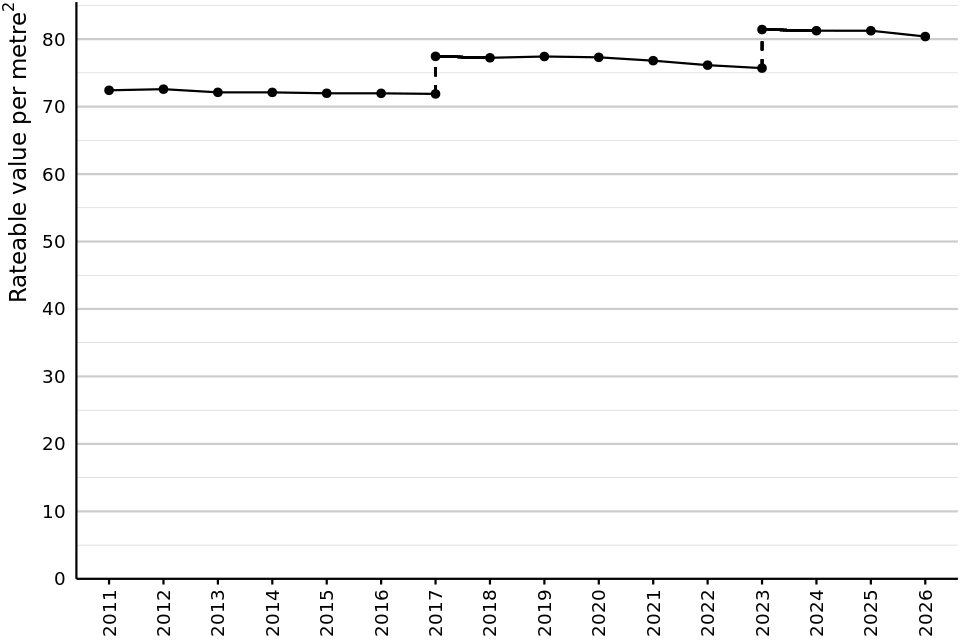
The mean rateable value (RV) per metre squared of the properties at 31 March 2026 was £80, down from £81 at 31 March 2025.
2. Properties included and excluded from floorspace statistics
Floorspace is defined as the internal area in metres squared used to calculate a property’s rateable value. In most instances, this will not include communal areas such as kitchens and facilities such as toilets. The Valuation Office (VO) does not hold floorspace data for all non-domestic properties. Not all rateable values are based upon floor area and therefore floorspace is not recorded for all properties. Only properties valued using their internal floor area are included in floorspace statistics. More information on which special categories are excluded from floorspace statistics can be found in the background information and tables.
In England and Wales at 31 March 2026:
-
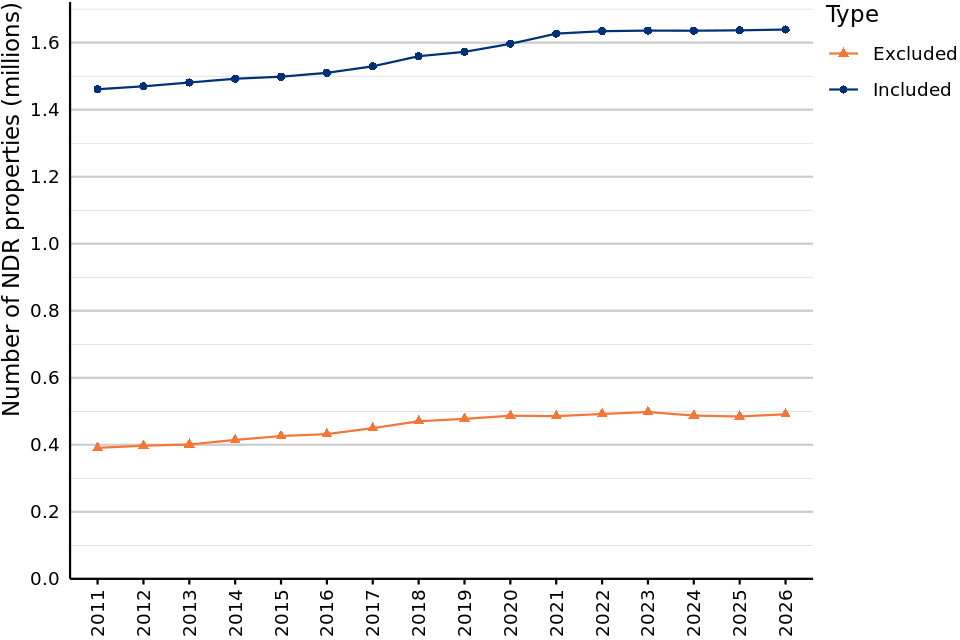
a total of 1.6 million properties, across 117 SCat codes, were included
-
this includes 99% of all Retail sector properties, 99% of all Office sector properties, 99% of all industry sector properties and 24% of all Other sector properties
-
the included properties account for 96% of all recorded floorspace
-
excluded properties make up 23% of the total stock of properties. 97% of all excluded properties are from the Other sector
Figure 1: Total number of rateable properties included and excluded in floorspace statistics in England and Wales
Source: NDR Business Floorspace, 2026 (Table 6.1, FS_SCAT1.1)
Figure 1 illustrates the total number of non-domestic properties included and excluded in floorspace statistics, from 2011 to 2026. For 2026, 1.6m (77%) of the total stock of properties are included and 0.5m (23%) are excluded.
3. Time series of business floorspace in England and Wales
The following section shows the changes to business floorspace and RV per metre squared over time. Each time series covers 3 distinct Rating Lists (2010,2017 and 2023) and shows data at 31 March for each year.
Figure 2: Total floorspace of included properties in England and Wales
Source: NDR Business Floorspace, 2026 (Table 1.1)
Figure 2 shows the total floorspace of included properties in England and Wales at 31 March of each year from 2011 to 2026. Between 2011 to 2015, total floorspace increased only marginally from 619.7 million to 620.9 million square metres. Between 2015 and 2025 total floorspace increased by 26.8 million (4%) and was 653.2 million metres squared at 31 March 2026. The overall floorspace totals are slightly higher than those reported in the 2023 release due to the changes in methodology reported in the background information.
Figure 3: Rateable value per metre squared of included properties in England and Wales
Source: NDR Business Floorspace, 2026 (Table 1.2)
Figure 3 shows the RV per metre squared of included properties in England and Wales at 31 March of each year from 2011 to 2026. Each sharp increase coincides with the end of a revaluation cycle and the introduction of a new Rating List. Since 31 March 2023 (the end of the 2017 Rating List), total RV per metre squared has increased from £76 to £80. The decrease in RV per metre squared between 2019 and 2023 can be partly explained by the expansion of the Industry sector (figure 4). While this sector has experienced the most substantial growth in floorspace, it also holds the lowest RV per metre squared (figure 5), resulting in the mean average of RV per metre squared decreasing.
4. Distribution by sector
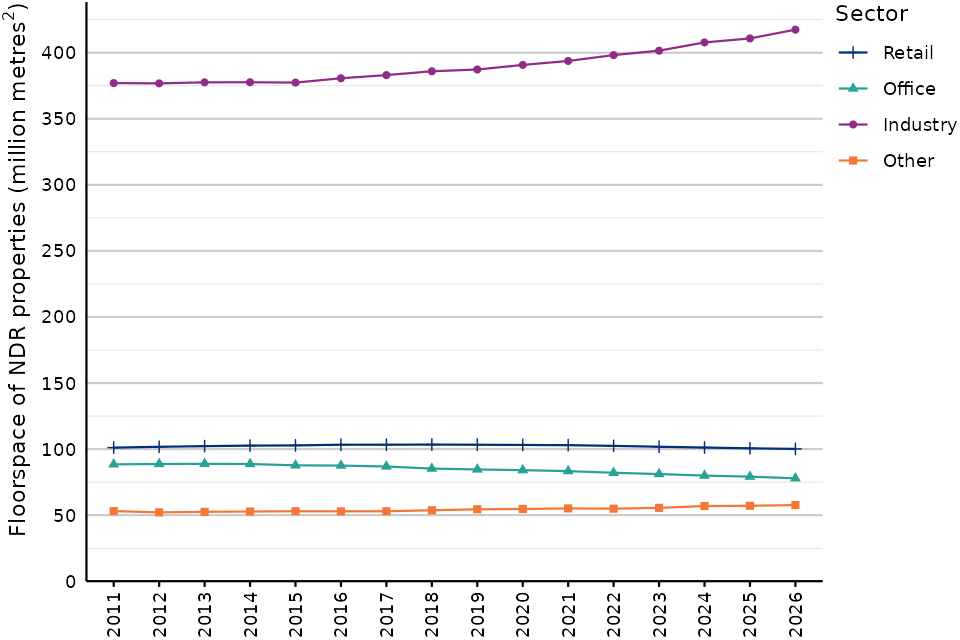
Figure 4: Total floorspace of included properties by sector in England and Wales
Source: NDR Business Floorspace, 2026 (Tables 2.1, 3.1, 4.1 & 5.1)
Figure 4 shows the total floorspace of included properties within each sector in England and Wales at 31 March of each year from 2011 to 2026.
The increase in floorspace from 2023 to 2026 (figure 4) is reflected almost exclusively in the Industry sector; all other sectors show much less fluctuation over time. Since 31 March 2023:
-
the total floorspace of the Retail sector has decreased by 2%, from 101.8 to 100.2 million metres squared
-
the Office sector has decreased by 4%, from 81.1 to 77.9 million metres squared
-
the Industry sector has increased by 4%, from 401.6 to 417.5 million metres squared
-
the Other sector has increased by 4%, from 55.5 to 57.6 million metres squared
Between 31 March 2025 and 31 March 2026:
-
the total floorspace of the Retail sector decreased from 100.6 to 100.2 million metres squared
-
the Office sector decreased from 79.1 to 77.9 million metres squared
-
the Industry sector increased from 410.9 to 417.5 million metres squared
-
the Other sector increased from 57.1 to 57.6 million metres squared
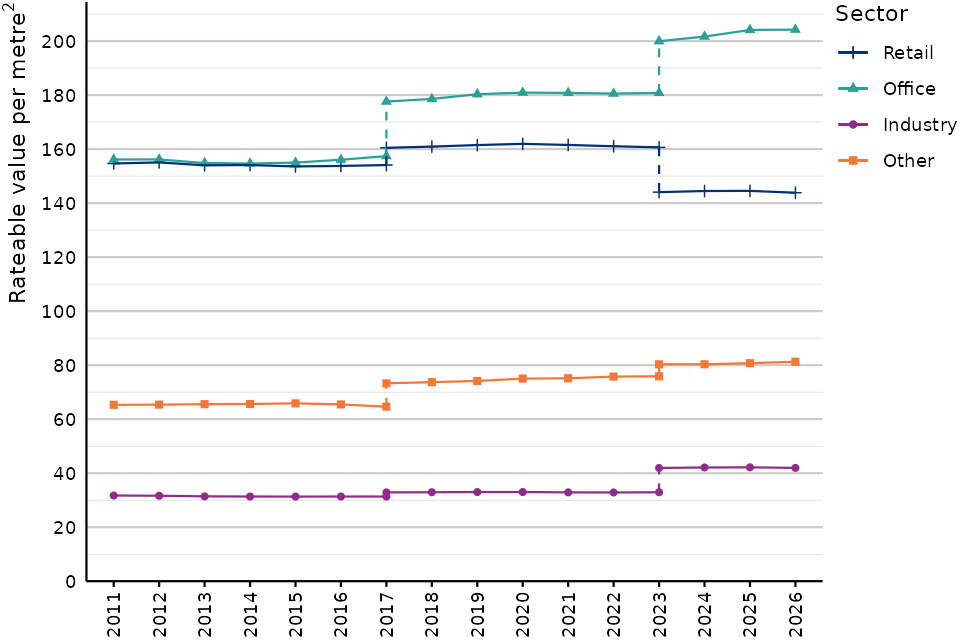
Figure 5: Rateable value per metre squared by sector of included properties in England and Wales
Source: NDR Business Floorspace, 2026 (Tables 2.2, 3.2, 4.2 & 5.2)
Figure 5 shows the RV per metre squared of included properties within each sector in England and Wales at 31 March of each year from 2011 to 2026. Each sharp increase coincides with the end of a revaluation cycle and the introduction of a new Rating List. Since 31 March 2023 (the last year of the 2017 Rating List):
-
the RV per metre squared of the Retail sector has decreased by 10%, from £161 to £144
-
the Office sector has increased by 13%, from £181 to £204
-
the Industry sector has increased by 27%, from £33 to £42
-
the Other sector has increased by 7%, from £76 to £81
Between 31 March 2025 and 31 March 2026:
-
the RV per metre squared of the Retail sector decreased from £145 to £144
-
the Office sector did not change from £204
-
the Industry sector did not change from £42
-
the Other sector did not change from £81
5. Further Information
More information about this release can be found in the Background Information document
Further information on the area codes used in this can be found on the ONS website
More information on statistics at the VO can be found on the VO statistics website:
Timings of future releases are regularly placed on the HMRC research and statistics calendar
We will keep the format of this document under review to continue improving the presentation of our statistics, and welcome feedback from users on the value of the information provided in this commentary — please forward any comments to the statisticsvo@hmrc.gov.uk