NCMP and Child Obesity Profile: short statistical commentary, January 2019
Updated 8 May 2019

© Crown copyright 2019
This publication is licensed under the terms of the Open Government Licence v3.0 except where otherwise stated. To view this licence, visit nationalarchives.gov.uk/doc/open-government-licence/version/3 or write to the Information Policy Team, The National Archives, Kew, London TW9 4DU, or email: psi@nationalarchives.gov.uk.
Where we have identified any third party copyright information you will need to obtain permission from the copyright holders concerned.
This publication is available at https://www.gov.uk/government/statistics/ncmp-and-child-obesity-profile-academic-year-2017-to-2018-update/ncmp-and-child-obesity-profile-short-statistical-commentary-january-2019
Main findings
This update shows:
- since 2006 to 2007 prevalence of severe obesity among children in Reception has remained stable at around 2.3% to 2.4%
- prevalence of severe obesity among children in Year 6 has shown an increase from 3.2% in 2006 to 2007 to 4.2% in 2017 to 2018
- inequalities in child obesity in England are widening among children in Reception and in Year 6
Summary
The January 2019 update of the National Child Measurement Programme (NCMP) and Child Obesity Profile presents the 2017 to 2018 academic year NCMP data for all current indicators and includes the addition of historic data for the severe obesity prevalence indicators for England, regions, and local authorities.
New indicators, for data not previously in the public domain, have been included showing the child obesity Slope Index of Inequality (SII) for England for 2006 to 2007 up to 2017 to 2018. Local authority and regional level data will be added in March 2019.
Trends in severe obesity in England
Children are classed as severely obese if their body mass index (BMI) is on or above the 99.6th centile of the British 1990 (UK90) growth reference.
This update shows:
- in 2017 to 2018 2.4% of children in Reception (aged 4 to 5 years) and 4.2% of children in Year 6 (aged 10 to 11 years) were severely obese
- since 2006 to 2007 prevalence of severe obesity among children in Reception has remained stable at around 2.3%. Prevalence of severe obesity among children in Year 6 has shown an increase from 3.2% in 2006 to 2007 up to 4.2% in 2017 to 2018
- prevalence of severe obesity varies considerably across England - in 2017 to 2018 prevalence among Reception children in local authority districts and unitary authorities ranged from 0.7% to 4.7%
- prevalence of severe obesity among Year 6 children in local authority districts and unitary authorities ranged from 0.9% to 7.5%; trend data from 2006 to 2007 for local authorities can be examined in the NCMP and Child Obesity Profile
Slope Index of Inequality (SII) for child obesity
The SII is a measure of the social gradient in an indicator and shows how much the indicator varies with deprivation (by deprivation decile). It takes account of inequalities across the whole range of deprivation within England and summarises this into a single number. The higher the value of the SII, the greater the inequality within an area.
A more detailed description of the method used to calculate the SII can be found in the PHOF overarching indicators technical user guide.
This update shows:
- inequalities in child obesity in England are widening among children in Reception and in Year 6
- the SII for child obesity among children in Reception in England in 2017 to 2018 was 7.8, greater than 2006 to 2007 (5.8)
- for children in Year 6, the SII for child obesity was 17.2 in 2017 to 2018, greater than 2006 to 2007 (10.7)
Figure 1. Trend in slope index of inequality: obesity prevalence with 95% confidence intervals. National Child Measurement Programme 2006 to 2007 to 2017 to 2018
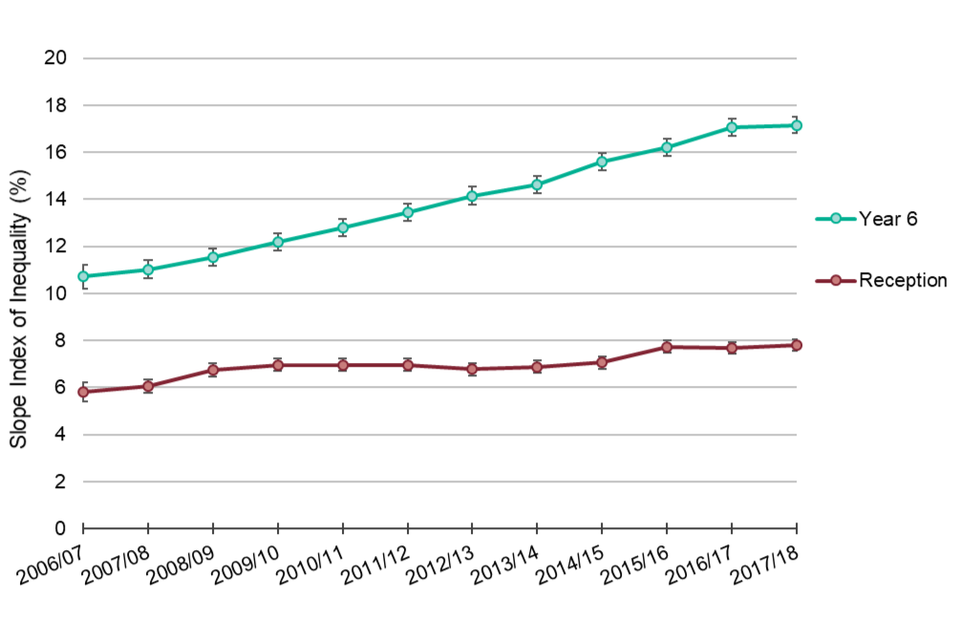
Trend in slope index of inequality for Year 6 and Reception
Background
National Child Measurement Programme (NCMP)
The NCMP annually measures the height and weight of over 1 million children in Reception (aged 4 to 5 years) and Year 6 (aged 10 to 11 years) in primary schools across England. The NCMP provides robust data on rates of child underweight through to severely obese.
The NCMP and Child Obesity Profile holds data from 2006 to 2007 and allows users to compare local authority data by region or between ‘CIPFA nearest neighbours’ (local authorities with similar characteristics).
NHS Digital published commentary on the 2017 to 2018 NCMP data when it was first released in October 2018. It provides high-level analysis of the prevalence of ‘underweight’, ‘healthy weight’, ‘overweight’, ‘obese’, ‘severely obese’ and ‘overweight and obese combined’ children, in Reception (aged 4 to 5 years) and Year 6 (aged 10 to 11 years), measured in state schools in England in the school year 2017 to 2018.
The NCMP and Child Obesity Profile tool
NCMP data from 2006 to 2007 to 2017 to 2018 is now available in this online data tool.
Prevalence of underweight, healthy weight, overweight, obesity and severe obesity for children in Reception (aged 4 to 5 years) and Year 6 (aged 10 to 11 years) can be examined at local authority level. Data quality indicators are also available in this tool, for example, rate of participation in the NCMP.
Five years’ worth of data combined for obesity prevalence provides inequalities data for sex, deprivation and ethnic group by local authority. Contextual indicators provide local authority level estimates for several topic areas that are determinants of or related to child obesity. For each topic area, where possible, the information is shown by gender, ethnicity, sexuality, region and local authority.
The data indicators in this tool enable monitoring of the national ambition to ‘halve childhood obesity and to significantly reduce the gap in obesity between children from the most and least deprived areas by 2030’, as set out in the government’s 2018 publication Childhood obesity: a plan for action, chapter 2.
Responsible statistician, product lead: Caroline Hancock
For queries relating to this document, please contact: ncmp@phe.gov.uk