NTS 2025: Travel to and from school
Updated 11 September 2026
Applies to England

© Crown copyright 2026
This publication is licensed under the terms of the Open Government Licence v3.0 except where otherwise stated. To view this licence, visit nationalarchives.gov.uk/doc/open-government-licence/version/3 or write to the Information Policy Team, The National Archives, Kew, London TW9 4DU, or email: psi@nationalarchives.gov.uk.
Where we have identified any third party copyright information you will need to obtain permission from the copyright holders concerned.
This publication is available at https://www.gov.uk/government/statistics/national-travel-survey-2025/nts-2025-travel-to-and-from-school
The introduction of the digital travel diary in 2025 is associated with lower recorded rates for some types of trips. The largest impacts are observed in walks of less than a mile and car trips, both of which are common modes of travel to school. As a result, statistics in this chapter that are based on trip diary data, including analysis of trips to and from school by main mode and by main mode and trip length, may be affected. However, trip rates for education and escort education purposes remained broadly similar to previous years. Results on reasons for not walking to school more and factors that would encourage greater levels of walking are collected through the interview and are therefore not affected by the introduction of the digital diary.
Users should bear these changes in mind when interpreting the results presented in this chapter.
Further details can be found in quality report and technical report for 2025.
Main findings
-
In 2025, walking was the most common mode of travel to and from school for children aged 5 to 16 (42%).
-
For children aged 5 to 10, 47% of trips to and from school were made by walking in 2025, 45% were by car and 3% by local bus.
-
Among children aged 5 to 10, most trips to and from school of less than a mile were made by walking (79%).
-
For children aged 5 to 10, the car was the most common mode for longer journeys to school, accounting for 64% of trips of 1 to under 2 miles, 82% of trips of 2 to under 5 miles, and 77% of trips of 5 miles and over.
-
For children aged 11 to 16, 38% of trips to and from school were made by walking, 27% by car and 19% by local bus.
-
Among children aged 11 to 16, the bus was the most commonly used mode for longer journeys to school, accounting for 39% of trips of 2 to under 5 miles and 59% of trips of 5 miles and over.
-
The 3 most common reasons for not walking to school more among males and females[footnote 1] were its too far, it takes too long, and children are too young.
-
In 2025, when asked which factors would encourage respondents[footnote 1] to walk to and from school more, the most common response was ‘none’.
-
The 3 most common things that would encourage to walk to school more often among males and females[footnote 1] were safer roads, more safer crossing paths and well-maintained pavements.
Trips to and from school by main mode
Chart 7.1: Percentage of trips to and from school by main mode and age: England, 2002 to 2025 (NTS0613)
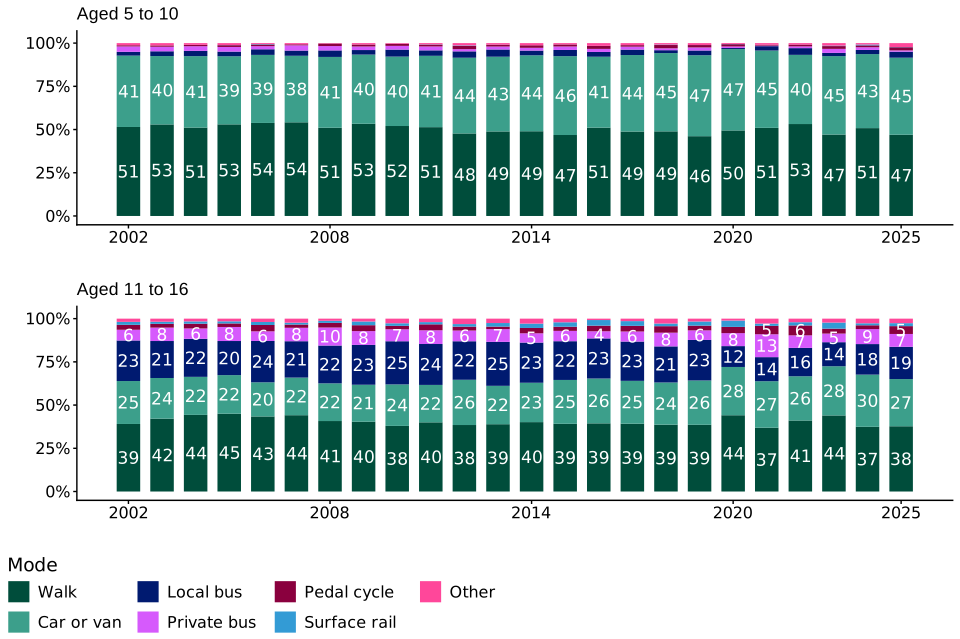
For children aged 5 to 10:
-
47% of trips to and from school were made by walking in 2025, similar to pre-pandemic levels (2019), when it was at an all-time low of 46%
-
45% of trips to and from school were made by car in 2025, remaining below the pre-pandemic level of 47% in 2019
-
around 3% travelled to and from school by local bus and 2% cycled in 2025
For children aged 11 to 16:
-
the majority of trips to and from school were made by walking (38%), and 27% by car in 2025
-
around 19% of trips to and from school were made by local bus in 2025, below the pre-pandemic level of 23% recorded in 2019
-
around 5% cycled to and from school in 2025, slightly more than younger children
Trips to and from school by main mode and trip length
Chart 7.2: Percentage of trips to and from school by main mode, trip length and age: England, 2002 to 2025 (NTS0614)[footnote 2]


For children aged 5 to 10:
-
most trips of less than a mile to and from school were made by walking, with 79% walked in 2025
-
the car was the most common mode for longer trips to and from school, accounting for 64% of trips of 1 to under 2 miles, 82% of trips of 2 to under 5 miles and 77% of trips of 5 miles and over in 2025
-
14% of trips of 2 to under 5 miles and 12% of trips of 5 miles and over were made by bus in 2025
For children aged 11 to 16:
-
the highest proportion of trips to and from school made by walking were for trips of under 1 mile (86%) and trips of 1 to under 2 miles (58%) in 2025
-
motorised transport was used more often for longer school trips, with 43% of trips of 2 to under 5 miles made by car and 39% by bus, and 29% of trips of 5 miles or more made by car and 59% by bus in 2025
-
around 4% of trips to and from school were made by cycling for trip length under 1 mile and 6% for trip lengths 1 to under 2 miles and 2 to under 5 miles
Barriers and encouragements to walking to school
Parents of children who did not usually walk to school in 2025 were asked about the reasons preventing their child from walking to school more often and what would encourage them to do so, either independently or accompanied[footnote 1]. Respondents could select all reasons and encouragements that applied. Those who selected more than one reason or encouragement were also asked to identify the main one[footnote 3].
Chart 7.3: All reasons for not walking to school more often by sex: England, 2025 (NTS0812)

For children who did not usually walk to and from school in 2025:
-
top 3 most common reasons for not walking to school more among males and females were it’s too far (56% and 55% respectively), it takes too long (27% and 30% respectively), and children are too young (17% and 19% respectively)
-
road safety concerns was the fourth most common reason among males (14%), while the weather ranked fourth among females (15%)
-
the main reason for not walking to school more was it’s too far (44% for males and 43% for females)
Chart 7.4: All encouragements for walking to school more often by sex: England, 2025 (NTS0812)
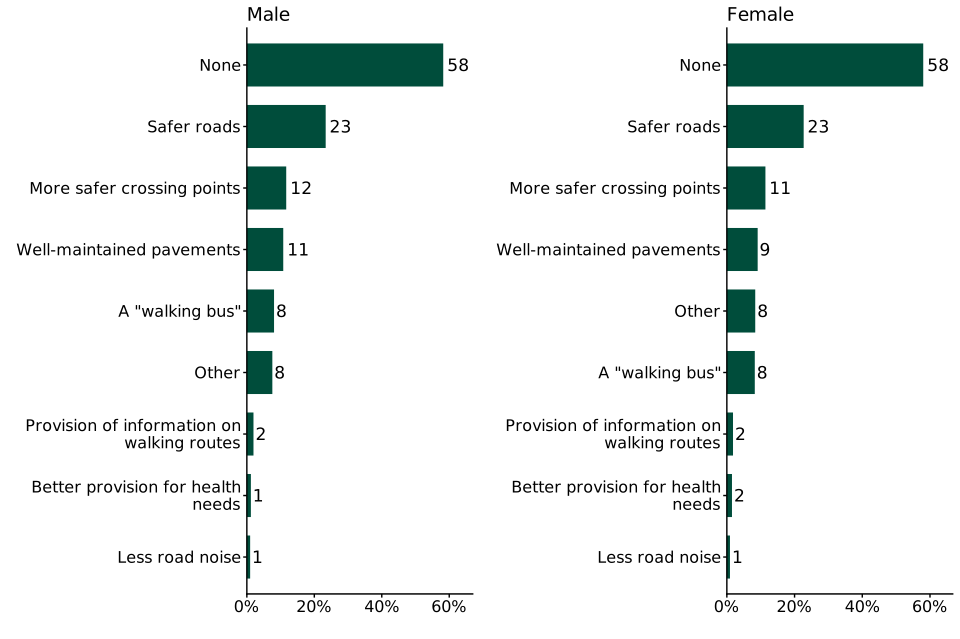
In 2025:
-
when asked which factors would encourage children to walk to and from school more, the most common response was ‘none’ (58% for both males and females)
-
the top 3 factors that would encourage children to walk to school more often were safer roads[footnote 4] (23% for both males and females), more safer crossing paths (12% for males and 11% for females) and well-maintained pavements[footnote 5] (11% for males and 9% for females)
-
the main encouragement was safer roads[footnote 4], selected by 19% of both males and females
NTS modernisation – we want your feedback
From autumn 2026, the NTS is launching a modernisation programme, which aims to review the survey’s methodology, data collection and outputs. The intention is to make the survey more flexible and scalable, reduce burden on respondents, and utilise modern technologies where appropriate.
The first stages involve capturing the views of our users and stakeholders on their use of, and need for, NTS data and statistics. We are contacting a number of known stakeholders directly, however we are keen to gather views from as wide a range of users as possible.
We want to ensure that the survey meets the needs of users, and any feedback provided will help inform the future design and development of the survey. If you have any feedback or wish to discuss this with the team, please email National Travel Survey statistics.
Background information
The 2025 National Travel Survey (NTS) is the latest in a series of household surveys of personal travel by residents of England travelling within Great Britain, from data collected via interviews and a 7-day travel diary. The NTS is part of a continuous survey that began in 1988, following ad-hoc surveys from the 1960s, which enables analysis of patterns and trends.
Some key uses of the data include describing patterns, for example how different groups of people travel, monitoring trends in travel, including sustainable modes; assessing the potential equality impacts of different groups; and contributing to the evaluation of policies.
These official statistics were independently reviewed by the Office for Statistics Regulation in September 2018. They comply with the standards of trustworthiness, quality and value in the Code of Practice for Statistics and are labelled ‘Accredited Official Statistics’.
Further information is available, including:
Instructions for printing and saving
Depending on which browser you use and the type of device you use (such as a mobile or laptop) these instructions may vary.
You will find your print and save options in your browser’s menu. You may also have other options available on your device. Tablets and mobile device instructions will be specific to the make and model of the device.
How to search
Select Ctrl and F on a Windows laptop or Command and F on a Mac.
This will open a search box in the top right-hand corner of the page. Type the word you are looking for in the search bar and press enter.
Your browser will highlight the word, usually in yellow, wherever it appears on the page. Press enter to move to the next place it appears.
Contact details
National Travel Survey statistics
To hear more about DfT statistical publications as they are released, follow us on X at DfTstats.
-
These questions are asked for each child aged 5 to 16 who does not currently walk to school and are answered by household reference person or another respondent aged 16 and over. ↩ ↩2 ↩3 ↩4
-
The relatively small number of trips to and from school by main mode, trip length and age in the sample may explain some of the variation observed over time, and therefore care should be taken when interpreting this data and comparing to other years. ↩
-
These questions are asked in the NTS every odd year. ↩
-
For example, with slower speeds, less traffic, more considerate driving. ↩ ↩2
-
For example, even, clean, uncluttered, well-lit. ↩