NTS 2025: Disability
Updated 11 September 2026
Applies to England

© Crown copyright 2026
This publication is licensed under the terms of the Open Government Licence v3.0 except where otherwise stated. To view this licence, visit nationalarchives.gov.uk/doc/open-government-licence/version/3 or write to the Information Policy Team, The National Archives, Kew, London TW9 4DU, or email: psi@nationalarchives.gov.uk.
Where we have identified any third party copyright information you will need to obtain permission from the copyright holders concerned.
This publication is available at https://www.gov.uk/government/statistics/national-travel-survey-2025/nts-2025-disability
About this release
The National Travel Survey (NTS) is a household survey of personal travel by residents of England travelling within Great Britain, from data collected via interviews and a 7-day travel diary, which enables analysis of patterns and trends. Please see our latest technical report for more details. This release covers travel trends for disabled people and people with mobility difficulties.
These are accredited official statistics and were independently reviewed by the Office for Statistics Regulation in September 2018. For more information, see Background information.
This publication includes Accredited Official Statistics. Accredited Official Statistics are called National Statistics in the Statistics and Registration Service Act 2007. For more details, see the Accredited Official Statistics Policy.
For more details about these statistics, see About these statistics.
The introduction of the digital travel diary in 2025 appears to be associated with a lower rate of recording for certain types of trips. The average trip rate has fallen by 9% overall, however this decrease is only observed among those categorised as not disabled under the Equality Act 2010 definition. Overall trip rates for disabled people are stable, with a smaller drop of 4% in recorded walking (or wheeling) trips, an increase of 4% in car driver drips and notable increases in most public transport modes. Users are advised to interpret changes in trip rates between 2024 and 2025 with this in mind.
Further details of work to understand the impact of the digital diary can be found in the quality report and technical report for 2025.
National Travel Survey definitions
Disability: from 2018, a person is considered to have a disability in the NTS if they report any physical or mental health condition or illness that lasts or is expected to last 12 months or more, and which limits their ability to carry out day-to-day activities. This is consistent with the core definition of disability under the Equality Act 2010, and complies with harmonised standards for social surveys published in August 2011. Some people classified as disabled and having rights under the Equality Act 2010 are not captured by this definition. This includes people with a long-standing illness or disability which is not currently affecting their day-to-day activities.
People living in care homes and other places such as community living environments are not captured through the survey and therefore the survey may underestimate disability prevalence and the prevalence of different impairments. This is particularly true for older age groups.
This section refers only to adults (16 and over) with a disability.
Travel trends by disabled people
Number of trips made in 2025 by age and disability status (DIS0401)
Chart 8.1: Number of trips per person by disability status and age: England, 2025 - DIS0401

Chart 8.1 is a grouped bar chart which shows that in 2025:
- disabled adults (aged 16 years and over) in England made 21% fewer trips than non-disabled adults (713 trips per person compared to 901)
- for those aged 60 and over, disabled adults made 31% fewer trips than non-disabled adults of the same age (648 trips per person compared to 945)
- disabled adults aged 16 to 59 made 13% fewer trips than non-disabled adults of the same age (773 trips per person compared to 885)
Trends in number of trips taken over time
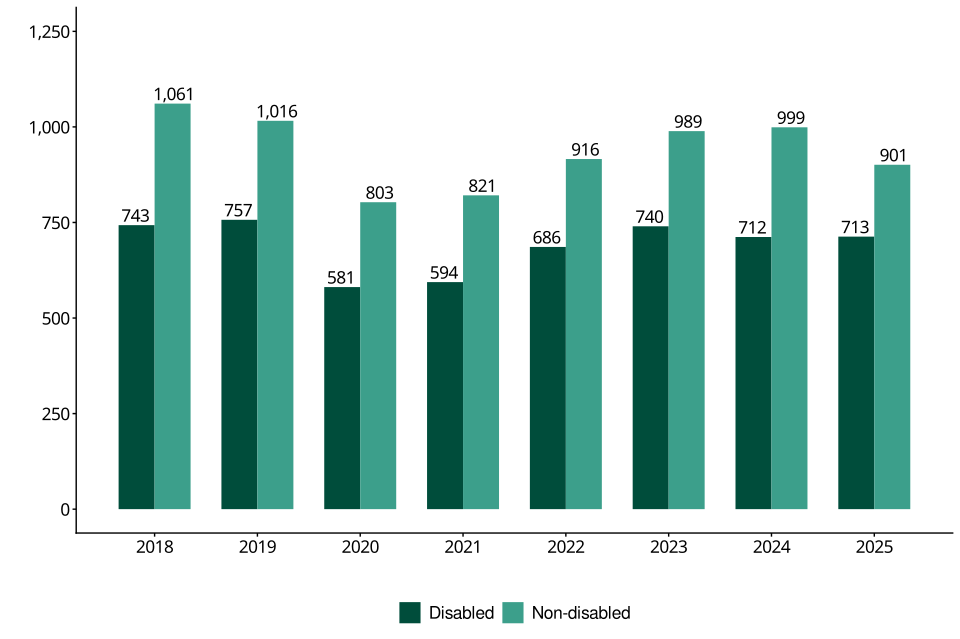
Chart 8.2: Number of trips per person per year by disability status: England, 2018 to 2025 - DIS0401
Care should be taken when interpreting long-term trends, due to changes in the methodology of data collection, changes in travel behaviour and a reduction of data collected during 2020 to 2022, as a result of the COVID-19 pandemic. The impact of the introduction of the digital diary, detailed in About this release, should also be considered for 2025.
Chart 8.2 is a grouped bar chart which shows that the average number of trips taken per person in 2025 compared to 2024:
- was unchanged for disabled adults
- was 10% lower for non-disabled adults
Despite the reduction in the average number of trips made since before the pandemic, the difference between disabled and non-disabled adults has remained similar over the last few years. Before COVID-19, disabled adults made around 25 to 30% fewer trips on average than non-disabled adults. This remained largely unchanged since the pandemic.
Mode of travel (DIS0402)
Chart 8.3: All trips by main mode and disability status, aged 16 and over: England (percentage), 2025 - DIS0402
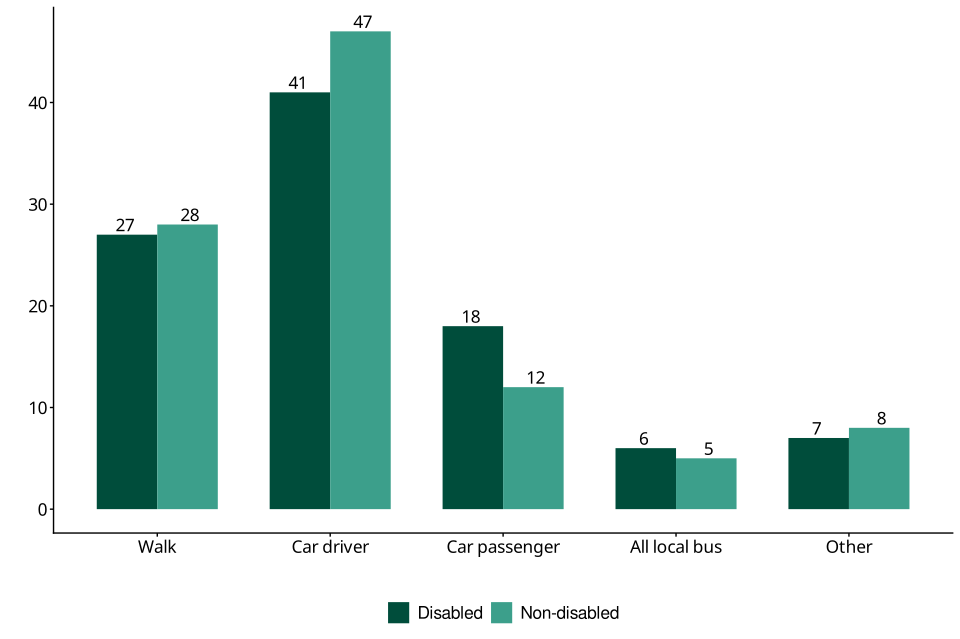
Chart 8.3 is a grouped bar chart which shows that compared with non-disabled adults, disabled adults made:
- a similar proportion of their trips by walking (27% compared with 28%)
- a higher proportion of their total trips (18% compared with 12%) as car passengers, while taking fewer trips as car drivers (41% compared with 47%)
- 59% of all trips by car in 2025, which is the same
- a similar proportion of their trips by bus (6% compared with 5%)
These figures are all similar to the previous year.
‘Other’ refers to all other forms of private and public transport. See Table DIS0402 for more information.
Purpose of travel (DIS0403)
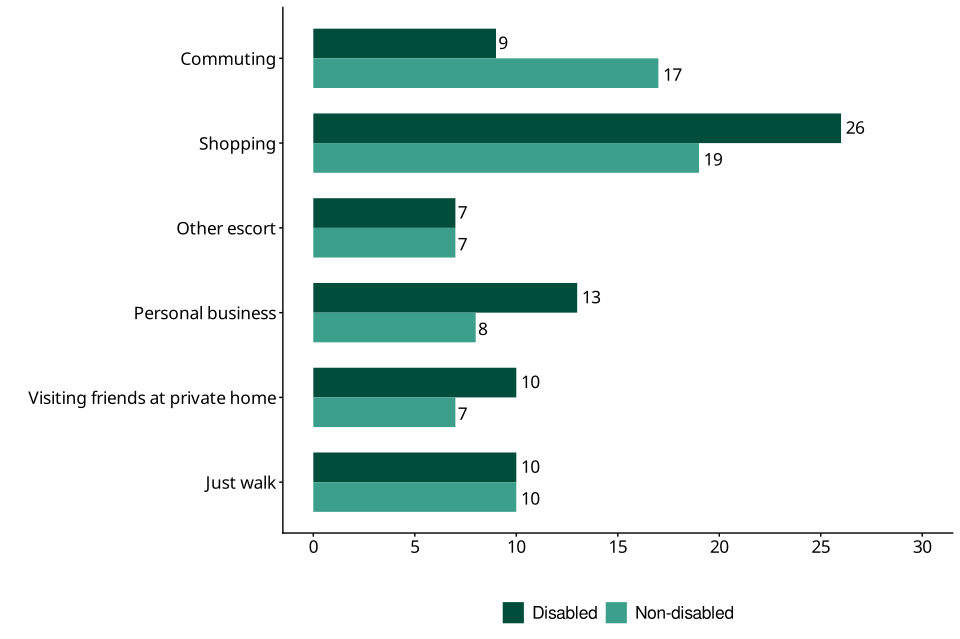
Chart 8.4: All trips by trip purpose and disability status, aged 16 and over: England, 2025 (top 6 purposes, percentage) - DIS0403
More trip purposes can be seen in DIS0403
Chart 8.4 is a grouped bar chart, showing that in 2025:
- the three most common trip reasons for disabled adults, in descending order, were shopping (26%), personal business (13%) and visiting friends at private home (10%)
- for non-disabled adults, the three most common trip reasons were shopping (19%), commuting (17%) and just walk (10%).
- the largest difference between disabled and non-disabled adults, within the top 6 trip purposes, was in trips for commuting (9% vs 17%)
Work status (DIS0406)
The difference between the average number of trips made per year varied considerably depending on the individual’s work status. In 2025:
- the average number of trips made by disabled adults (909) in full time work was similar to that of non-disabled adults in full time work (893)
- for adults in part-time work, the average number of trips made by disabled adults was 5% lower than non-disabled adults (979 and 1,033 respectively)
- the average number of trips made by disabled adults who were retired or permanently sick was 37% lower than non-disabled adults (600 and 954 respectively)
Car access (DIS0405)
In 2025, 32% of disabled adults lived in households without access to a car (up 2 percentage points from 2024), compared with 16% of non-disabled adults (up 2 percentage points from 2024).
In 2025, the number of trips made per person varied based on car access and driving status.
For disabled adults:
- those with access to a car, and who were the main driver, made the most trips (944 trips per person)
- those living in a household without a car made the fewest trips (507 trips per person)
- those with access to a car but as non-drivers made 557 trips per person
For non-disabled adults:
- those with access to a car, and who were the main driver, made the most trips (1,027 trips per person)
- those with access to a car but as non-drivers made the fewest trips (654 trips per person)
-
those without access to a car made trips than non-drivers in households with access to a car (678 trips per person compared to 654)
- those without access to a car made a similar average number of trips than non-drivers in households with access to a car (678 trips per person compared to 654)
Driving licence holding (DIS0407)
Chart 8.5: Adults holding a driving licence, by age and disability status: England, 2025 (percentage) - DIS0407
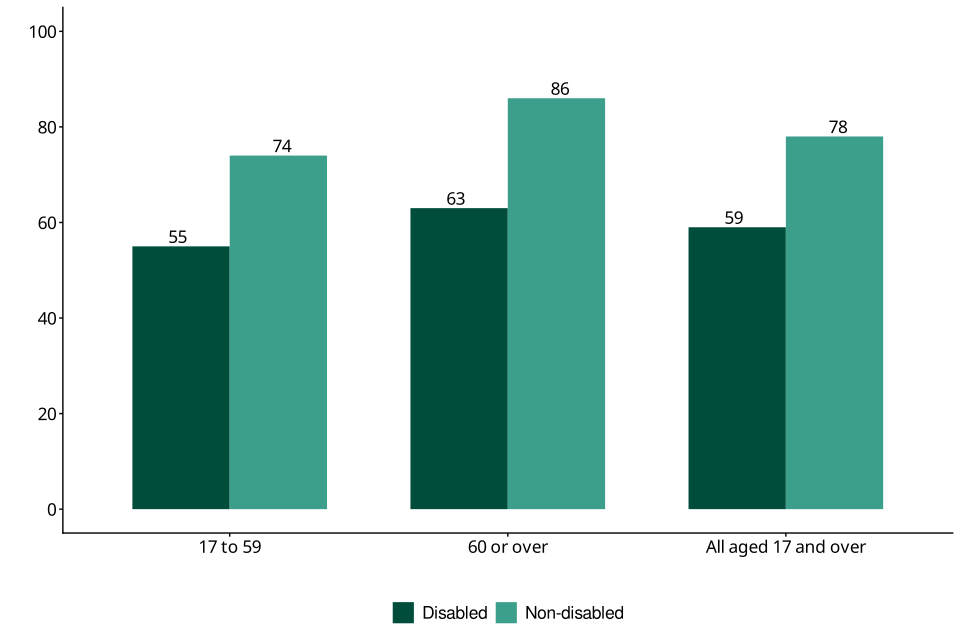
Chart 8.5 is a grouped bar chart which shows that:
- for disabled adults, the proportion that held a driving licence ranged from 55% to 63% across age groups, while for non-disabled adults it was higher, ranging from 74% to 86%
- 59% of disabled adults aged 17 or over held a full driving licence, compared with 78% of non-disabled adults in the same age group
- amongst both disabled and non-disabled adults, those with a full driving licence made more trips (847 and 975 trips per person per year, respectively) on average than those without one (520 and 660 trips per person per year, respectively)
Type of impairment (NTS0712)
Chart 8.6: Average miles travelled and trips made by impairment, aged 16 and over: England, 2025 - NTS0712
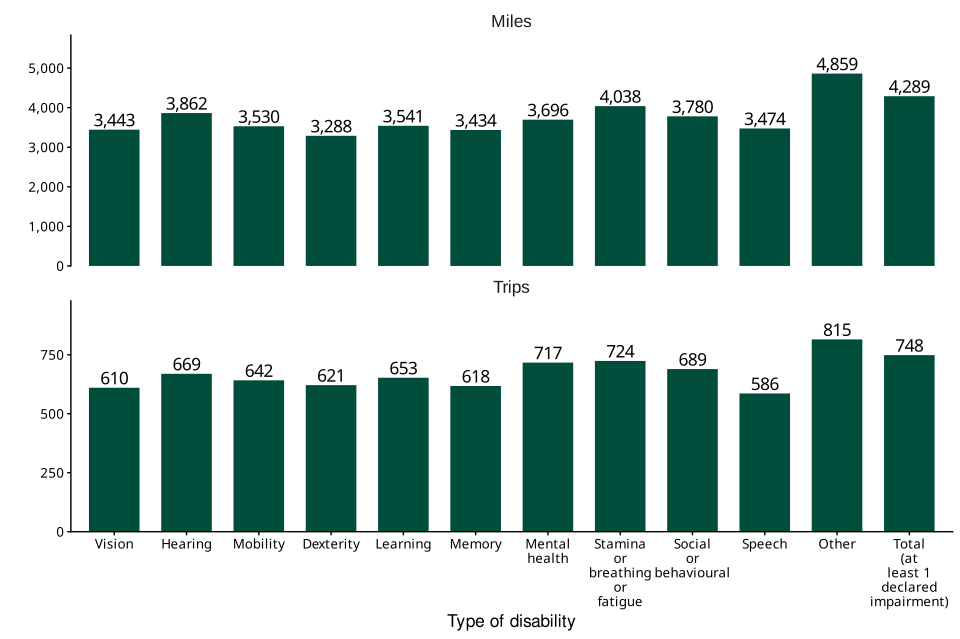
Those who reported more than one impairment are present in multiple categories. The total value counts all individuals with at least one reported impairment.
Chart 8.6 is a multiple bar chart which shows that, in 2025, of those who declared one or more impairments:
- the fewest miles on average were travelled by those who declared an impairment of dexterity (3,288) and memory (3,434)
- the fewest trips on average were made by those who declared an impairment of speech (586) and vision (610)
Sex (DIS0408)
In 2025, disabled adult females made an average of 708 trips per person, compared with disabled adult males who made an average of 716 trips per person.
There has been little difference in average trip numbers by sex for disabled adults since 2018.
Income (DIS0409)
Chart 8.7: Number of trips per person by disability status and income quintile: England, 2025 - DIS0409
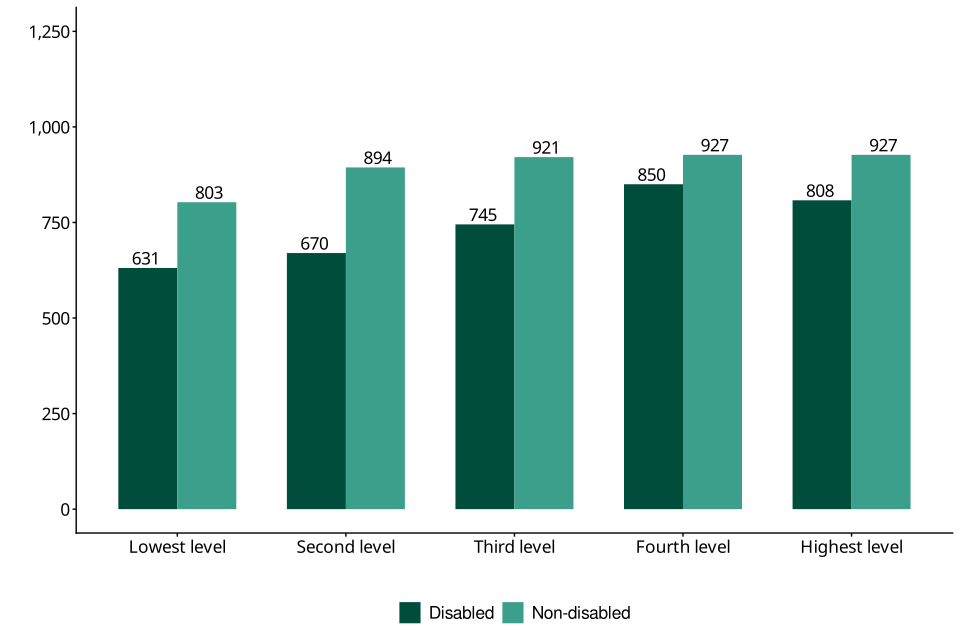
Chart 8.7 is a grouped bar chart showing that, in 2025, the difference in travel patterns between disabled and non-disabled adults varied by income quintile.
Disabled adults in the:
- lowest level income quintile made an average of 631 trips per person (compared with non-disabled adults who made an average of 803 trips per person)
- highest level income quintile made an average of 808 trips per person (compared with non-disabled adults who made an average of 927 trips per person)
- highest three income quintiles made between 8% and 19% fewer trips than non-disabled adults in the same income groups
- lowest two income quintiles made 21% and 25% less trips than the average number of trips made by non-disabled adults in the same income quintiles
When compared to 2024:
- the average number of trips made in 2025 remained similar for disabled adults across all income quintiles
- the average number of trips made in 2025 decreased for non-disabled adults in all income quintiles by between 9% and 11%
About these statistics
NTS modernisation – we want your feedback
From Autumn 2026, the NTS is launching a modernisation programme, which aims to review the survey’s methodology, data collection and outputs. The intention is to make the survey more flexible and scalable, reduce burden on respondents, and utilise modern technologies where appropriate.
The first stages involve capturing the views of our users and stakeholders on their use of, and need for, NTS data and statistics. We are contacting a number of known stakeholders directly, however we are keen to gather views from as wide a range of users as possible.
We want to ensure that the survey meets the needs of users, and any feedback provided will help inform the future design and development of the survey. If you have any feedback or wish to discuss this with the team, please email National Travel Survey statistics.
Background information
The 2025 NTS is the latest in a series of household surveys of personal travel by residents of England travelling within Great Britain, from data collected via interviews and a 7-day travel diary. The NTS is part of a continuous survey that began in 1988, following ad-hoc surveys from the 1960s, which enables analysis of patterns and trends. Some key uses of the data include describing patterns, for example, how different groups of people travel, monitoring trends in travel, including sustainable modes; assessing the potential equality impacts of different groups, and contributing to the evaluation of policies.
These statistics on disability and people with mobility difficulties were previously published within the Disability, Accessiblity and Blue Badge statistical collection. Statistics on Blue Badges will continue to be published separately.
We always welcome feedback to help ensure that the survey meets the needs of users, and any feedback provided will help inform the future design and development of the survey. If you have any feedback, please email national.travelsurvey@dft.gov.uk or localtransport.statistics@dft.gov.uk
These official statistics were independently reviewed by the Office for Statistics Regulation in September 2018. They comply with the standards of trustworthiness, quality and value in the Code of Practice for Statistics and are labelled ‘accredited official statistics’.
Further information is available, including:
- NTS data tables
- disability statistics data tables
- notes and definitions
- guidance and quality information
- future developments
Instructions for printing and saving
Depending on which browser you use and the type of device you use (such as a mobile or laptop) these instructions may vary.
You will find your print and save options in your browser’s menu. You may also have other options available on your device. Tablets and mobile device instructions will be specific to the make and model of the device.
How to search
Select Ctrl and F on a Windows laptop or Command and F on a Mac
This will open a search box in the top right-hand corner of the page. Type the word you are looking for in the search bar and press enter.
Your browser will highlight the word, usually in yellow, wherever it appears on the page. Press enter to move to the next place it appears.
To hear more about DfT statistical publications as they are released, follow us on X at DfTstats.
Contact details
Transport: disability, accessibility and blue badge statistics
Email localtransport.statistics@dft.gov.uk
Media enquiries 0300 7777 878