National curriculum assessments at key stage 2 in England, 2018 (provisional)
Updated 20 December 2018
Applies to England

© Crown copyright 2018
This publication is licensed under the terms of the Open Government Licence v3.0 except where otherwise stated. To view this licence, visit nationalarchives.gov.uk/doc/open-government-licence/version/3 or write to the Information Policy Team, The National Archives, Kew, London TW9 4DU, or email: psi@nationalarchives.gov.uk.
Where we have identified any third party copyright information you will need to obtain permission from the copyright holders concerned.
This publication is available at https://www.gov.uk/government/statistics/national-curriculum-assessments-key-stage-2-2018-provisional/national-curriculum-assessments-at-key-stage-2-in-england-2018-provisional--2
1. Introduction
1.1 4 September 2018
This publication provides provisional attainment statistics for key stage 2 (KS2) national curriculum assessments.
The data includes results for pupils in schools in England, at national, regional and local authority level and extends the results of the interim publication published on 10 July 2018.
Pupils take national curriculum assessments in year 6 at the end of KS2, when most pupils will reach age 11 by the end of the school year. Pupils take tests (commonly referred to as SATs) in reading, maths and grammar, punctuation and spelling (GPS) and receive a teacher assessment (TA) in reading, writing, maths and science.
Attainment in 2018 is compared to 2017 and 2016 where appropriate. The KS2 assessment and reporting arrangements provide a summary of the key changes introduced in 2016, the first year of assessments based on the new curriculum.
The following tables are included in the statistical publication:
- KS2 national and local authority tables (Excel .xls)
- Underlying data (open format .csv and metadata .txt)
The accompanying methodology document provides information on the data sources, their coverage and quality and explains the methodology used in producing the data.
All percentage point differences are calculated using unrounded figures.
2. Attainment in reading, writing and maths combined
In 2018, 64% of pupils reached the expected standard in all of reading, writing and maths, while 10% of pupils reached the higher standard.
Attainment in all of reading, writing and maths is not directly comparable to previous years because of changes to writing teacher assessment (TA) frameworks. In 2017, 61% of pupils reached the expected standard compared to 53% in 2016. In 2017, 9% reached a higher standard in reading, writing and maths compared to 5% in 2016.
The combined reading, writing, and maths measure uses the reading and maths test results along with the outcome of the writing TA. Together, these subjects give a broad measure of pupil attainment.
To reach the expected standard in all of reading, writing and maths, a pupil must achieve a scaled score of 100 or more in reading and maths tests and an outcome of ‘working at the expected standard’ or ‘working at greater depth’ in writing TA. To reach the higher standard, a pupil must achieve a scaled score of 110 or more in reading and maths tests and an outcome of ‘working at greater depth’ in writing TA.
3. Attainment in reading, maths and GPS tests
Attainment increased in each of the test subjects compared to 2017.
In reading, 75% of pupils reached the expected standard in 2018, up by 4 percentage points from 2017.
In maths, 76% of pupils reached the expected standard, up by 1 percentage point.
In grammar, punctuation and spelling (GPS), 78% of pupils reached the expected standard, up by 1 percentage point.
3.1 Figure 1: Percentage reaching the expected standard in KS2 tests
| Percentage reaching the expected standard: England, 2016-2018 (all schools) | 2016 | 2017 | 2018 |
|---|---|---|---|
| Reading test | 66% | 72% | 75% |
| Maths test | 70% | 75% | 76% |
| GPS test | 73% | 77% | 78% |
Source: Provisional KS2 data (2018) and Final KS2 data (2017 and 2016)
Attainment at the expected standard remained highest in the grammar, punctuation and spelling (GPS) test and lowest in the reading test.
Table 1 summarises attainment at the expected standard and the high score in the key stage 2 tests. The increases in attainment were smaller than in previous years.
To reach the expected standard in each test subject, a pupil must achieve a scaled score of 100 or more. The threshold for the higher standard is a scaled score of 110.
3.2 Table 1: Attainment and percentage point change from 2017 in KS2 tests
| Attainment and percentange point change from 2017: England, 2018 (all schools) | Reaching the expected standard | Achieving the higher standard |
|---|---|---|
| Reading test | 75% (+4pp) | 28% (+3pp) |
| Maths test | 76% (+1pp) | 24% (+1pp) |
| GPS test | 78% (+1pp) | 34% (+3pp) |
Source: Provisional KS2 data (2018)
4. Attainment in writing, science, reading and maths teacher assessment
Teacher assessment provides a judgement that is based on knowledge of how the pupil has performed over time and in a variety of contexts.
In writing TA, the proportion of pupils who reached the expected standard in 2018 was 78%, while 20% of pupils were working at greater depth.
Changes made within the 2017/18 writing TA frameworks mean that judgements in 2018 are not directly comparable to those made using the previous interim frameworks in 2016 and 2017. In 2017, 76% of pupils reached the expected standard compared to 74% in 2016. In 2017, 18% reached a higher standard in writing TA compared to 15% in 2016.
Figure 2 shows how attainment in teacher assessments has changed since 2016. Teacher assessments in reading and maths and science showed increased attainment in 2018. Attainment at the expected standard in reading TA increased by 1 percentage point to 80%, while maths TA increased by 2 percentage points to 79% and science TA increased by 1 percentage point to 82%.
4.1 Figure 2: Percentage reaching the expected standard in KS2 teacher assessments
| Percentage reaching the expected standard: England, 2016-2018 (all schools) | 2016 | 2017 | 2018 |
|---|---|---|---|
| Science TA | 81% | 82% | 82% |
| Reading TA | 80% | 79% | 80% |
| Maths TA | 78% | 77% | 79% |
Source: Provisional KS2 data (2018) and Final KS2 data (2017 and 2016)
The ‘working at greater depth’ standard is not used for reading, maths or science TA.
5. Average scaled scores in reading, maths and GPS tests
We use scaled scores to report the results of tests so we can make accurate comparisons of performance over time. The average scaled score is calculated as the mean scaled score of all pupils awarded a scaled score. Pupils who did not take the test are excluded from the calculation.
Average scaled scores remained largely stable compared to 2017. The reading scaled score increased by 1 score to 105. The average scaled score remained the same in maths and GPS, at 104 and 106 respectively.
5.1 Figure 3: Average scaled score in KS2 tests
| Average scaled score: England, 2016-2018 (all schools) | 2016 | 2017 | 2018 |
|---|---|---|---|
| Reading test | 103 | 104 | 105 |
| Maths test | 103 | 104 | 104 |
| GPS test | 104 | 106 | 106 |
Source: Provisional KS2 data (2018) and Final KS2 data (2017 and 2016)
6. Gender gaps
Attainment increased across all subjects for both genders and girls continue to outperform boys.
In 2018, the gender gap at the expected standard in reading, writing and maths was 8 percentage points: 68% of girls reached the expected standard compared to 60% of boys. The gender gap remained the same as 2017 as attainment increased by 3 percentage points for both girls and boys from 65% and 57% respectively.
At individual subject level, more girls reached the expected standard in all subjects (Table 2).
As in 2017, the biggest attainment gap between boys and girls was in writing TA at 12 percentage points. The gender gap at the expected standard in maths was only 1 percentage point, which was notably smaller than in other subjects.
6.1 Table 2: Percentage reaching the expected standard by gender
| Percentage reaching the expected standard by gender: England, 2018 (all schools) | Boys | Girls | Difference |
|---|---|---|---|
| Reading, writing and maths | 60% | 68% | +8pp |
| Reading test | 71% | 79% | +8pp |
| Maths test | 75% | 76% | +1pp |
| GPS test | 73% | 82% | +9pp |
| Writing TA | 72% | 84% | +12pp |
Source: Provisional KS2 data (2018)
At the higher standard, 12% of girls achieved the standard in all of reading, writing and maths compared to 8% of boys – a gap of 3 percentage points. This gap remained unchanged from 2017.
At the higher standard, Girls outperformed boys in all subjects except in maths where boys outperformed girls by 4 percentage points. This pattern is consistent with previous years, where boys performed better than girls only in maths.
6.2 Table 3: Percentage achieving the higher standard by gender
| Percentage achieving the higher standard by gender: England, 2018 (all schools) | Boys | Girls | Difference |
|---|---|---|---|
| Reading, writing and maths | 8% | 12% | +3pp |
| Reading test | 24% | 32% | +9pp |
| Maths test | 25% | 22% | -4pp |
| GPS test | 30% | 39% | +9pp |
| Writing TA | 15% | 25% | +11pp |
Source: Provisional KS2 data (2018)
6.3 Scaled scores by gender
Average scaled scores for girls in reading and GPS tests were 2 scores higher than for boys (Table 4).
In the maths test, although a lower proportion of boys than girls met the expected standard (75% vs 76% respectively), the average scaled score of boys (105) is 1 score higher than that of girls (104). This reflects the higher proportion of boys achieving the higher score in maths.
6.4 Table 4: Average scaled score in KS2 tests by gender
| Average scaled score: England, 2018 (all schools) | Boys | Girls | Difference |
|---|---|---|---|
| Reading test | 104 | 106 | +2 |
| GPS test | 105 | 107 | +2 |
| Maths test | 105 | 104 | -1 |
Source: Provisional KS2 data (2018)
7. Attainment by school type
There were 15,055 state-funded mainstream primary schools with key stage 2 results in 2018.
Since 2016, there have been substantial changes to the makeup of school types in England (Table 5). The proportion of LA maintained schools decreased from 82% in 2016 to 73% in 2018. There have been corresponding increases in the proportion of sponsored and converter academies to 8% and 18% respectively. It should be noted that the conversion of schools from one type to another means that the headline figures capture not only change in performance but also change in school type. While the number of free schools has increased to 57, free schools make up a very small proportion of schools.
See the accompanying methodology document for details about different types of school.
7.1 Table 5: Number and percentage of schools by school type
| Number and percentage of schools by school type: England, 2016-2018 (state-funded mainstream schools) | 2016 | 2017 | 2018 | |||||
|---|---|---|---|---|---|---|---|---|
| LA maintained schools | 12,292 | 82% | 11,784 | 79% | 11,044 | 73% | ||
| Sponsored academies | 866 | 6% | 983 | 7% | 1,186 | 8% | ||
| Converter academies | 1,744 | 12% | 2,174 | 15% | 2,768 | 18% | ||
| Free schools | 28 | 0% | 36 | 0% | 57 | 0% | ||
| All state-funded mainstream schools | 14,930 | 14,977 | 15,055 |
Source: Provisional KS2 data (2018) and Final KS2 data (2017 and 2016)
Attainment for different school types is summarised in Tables 6 and 7. As in 2017, attainment in individual subjects is highest in converter academies and lowest in sponsored academies.
Attainment levels in mainstream academies and free schools as a group were broadly similar to those in local authority maintained mainstream schools. However, within the academies group, converter academies had a higher proportion of pupils achieving the expected standard than the average for all state-funded mainstream schools. This difference may be explained by the fact that schools that choose to convert to academies are typically high performing schools. On the other hand sponsored academies which as a group are below the average for state-funded mainstream schools, are typically low performing before their conversion to academy status.
7.2 Table 6: Attainment in reading, writing and maths by school type
| Attainment in reading, writing and maths by school type: England, 2018 (all schools) | Expected standard | Higher standard |
|---|---|---|
| LA maintained schools | 65% | 10% |
| Academies and free schools | 64% | 10% |
| Of which: | ||
| Sponsored academies | 57% | 7% |
| Converter academies | 67% | 11% |
| Free schools | 61% | 12% |
| All schools | 64% | 10% |
Source: Provisional KS2 data (2018)
7.3 Table 7: Percentage reaching the expected standard in individual subjects by school type
| Percentage reaching the expected standard by school type: England, 2018 (all schools) | Reading test | Writing TA | Maths test | GPS test |
|---|---|---|---|---|
| LA maintained schools | 77% | 79% | 77% | 79% |
| Academies and free schools | 75% | 79% | 76% | 77% |
| Of which: | ||||
| Sponsored academies | 68% | 73% | 70% | 70% |
| Converter academies | 78% | 81% | 78% | 80% |
| Free schools | 75% | 75% | 73% | 76% |
| All schools | 75% | 78% | 76% | 78% |
Source: Provisional KS2 data (2018)
7.4 Attainment in academies over time
As noted above, the conversion of schools from one type to another means that the headline figures capture not only change in performance but also change in school type. It is difficult, therefore, to assess the impact of converting to an academy by looking only at the headline figures in 2018.
In order to address this difficulty, Table N4 of the accompanying tables provides a time series showing how reading, writing and maths attainment changes in years after a school becomes an academy. This time series shows that the academies that have been open the longest have the highest attainment. In converter academies that have been open for 7 years or more, 71% of pupils reached the expected standard in reading, writing and maths while in sponsored academies 62% of pupils reached the expected standard. In converter academies open for one academic year 65% of pupils reached the expected standard while in sponsored academies open for one year 53% reached the standard.
8. Attainment by school phase
Table 8 shows pupil attainment according to the phase of school. ‘Other’ includes schools where highest statutory age > 11 such as all-through schools.
Most (84%) 11-year-old pupils in mainstream schools are in primary schools that cover both the key stage 1 and key stage 2 age range. Many of these pupils will have been in the same school at the end of key stage 1. In 2018, 13% of 11-year-old pupils in mainstream schools are in junior schools while 2% are in middle schools. The remainder of pupils are in other types of schools such as all-through schools.
Attainment was broadly similar in primary, junior, and middle schools – 65% of pupils in mainstream primary schools reached the expected standard in reading, writing and maths compared to 66% in mainstream junior schools and 63% in mainstream middle schools. Schools in the ‘Other’ category had a lower attainment at the expected standard (60%). However, these are fewer in number and are concentrated in particular areas of the country.
8.1 Table 8: Attainment in reading, writing and maths by school phase
| Attainment in reading, writing and maths by religious character of school: England, 2018 (state-funded mainstream schools) | Number of schools | Number of eligible pupils | Percentage reaching the expected standard | Percentage achieving the higher standard |
|---|---|---|---|---|
| Primary schools | 13,773 | 511,973 | 65% | 10% |
| Junior schools | 1,062 | 79,140 | 66% | 11% |
| Middle schools | 114 | 13,226 | 63% | 9% |
| Other | 106 | 6,051 | 60% | 9% |
Source: Provisional KS2 data (2018)
Table N5A of the accompanying tables provides additional breakdowns of school attainment by cohort size.
9. Attainment by religious character of school
Table 9 shows pupil attainment according to religious character of the school. Religious character is taken from Get information about schools and is the legal designation of each school. Further information on faith schools can be found in the methodology document accompanying this release.
The majority of eligible pupils (71% of those at state-funded mainstream schools) attend schools with no designated religious character. Results for these schools are therefore very close to the national average as they make up the majority of the total.
Apart from Methodist and Other Christian Faith schools, attainment results in faith schools are slightly higher than the national average.
9.1 Table 9: Percentage reaching the expected standard in reading, writing and maths by religious character of school
| Percentage reaching the expected standard in reading, writing and maths by religious character of school: England, 2018 (state-funded mainstream schools) | Number of schools | Number of eligible pupils | Percentage reaching the expected standard |
|---|---|---|---|
| No religious character | 9,278 | 430,697 | 64 |
| Church of England | 4,024 | 117,323 | 66 |
| Roman Catholic | 1,609 | 56,870 | 70 |
| Methodist | 23 | 597 | 65 |
| Other Christian faith | 72 | 2,733 | 65 |
| Jewish | 32 | 1,281 | 77 |
| Muslim | 9 | 491 | 76 |
| Sikh | 5 | 280 | 74 |
Source: Provisional KS2 data (2018)
Jewish, Methodist, Muslim, Sikh and Hindu schools are very small in number, so other factors specific to this handful of schools, other than their religious character, may account for their results. There is only one Hindu school with eligible pupils and so results for this school are not shown until December, when school-level results are published.
Table N5 of the accompanying tables provides additional breakdowns of school attainment by religious character.
10. Local authority attainment
There is considerable variation between local authorities in attainment (Table 9). The difference between the lowest and highest performing local authorities was greatest in reading, writing and maths combined with a range of 32 percentage points, an increase from 25 percentage points in 2017. This change has been driven by both higher maximum attainment (80% in 2018 compared to 76% in 2017) and lower minimum attainment (48% in 2018 compared to 52% in 2017).
Results for Bedford were not included at the time of publication because there were known changes to the data after the cut-off date for publication. These figures were added after the provisional publication on 4 September and have been updated in this document published on 28 September. City of London and Isles of Scilly are not included in this analysis as they only have one school each.
10.1 Table 10: Minimum and maximum local authority attainment
| Minimum and maximum local authority attainment: England, 2018 (state-funded schools) | Minimum | Maximum | Range |
|---|---|---|---|
| % Reaching the expected standard | |||
| Reading, writing and maths | 48% | 80% | 32 |
| Reading test | 61% | 87% | 26 |
| Maths test | 60% | 88% | 28 |
| GPS test | 66% | 89% | 23 |
| Writing TA | 69% | 87% | 18 |
| Average scaled score | |||
| Reading test | 103 | 109 | 6 |
| Maths test | 102 | 108 | 6 |
| GPS test | 104 | 110 | 6 |
Source: Provisional KS2 data (2018)
The map shows the percentage of pupils reaching the expected standard in reading, writing and maths by local authority. This map reveals a complex picture of attainment across England, with a range of high and low attainment in different regions.
Inner and Outer London were the highest achieving regions with 70% and 68% of pupils achieving the expected standard in reading, writing and maths combined respectively.
The regions with lowest attainment were Yorkshire and The Humber, East Midlands, West Midlands, and the East, all of which had 62% of pupils achieving the expected standard.
The relative attainment in the regions is broadly consistent with last year, but attainment overall has increased.
10.2 Figure 4: Percentage of pupils reaching the expected standard in reading, writing and maths by local authority. England, 2018 (state-funded schools only)
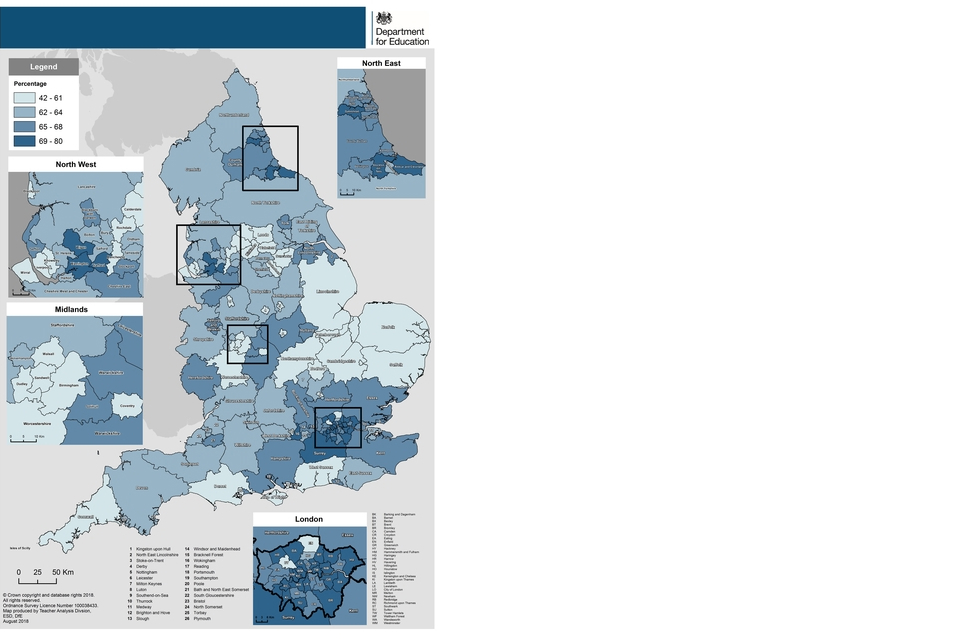
Source: Provisional KS2 data (2018)
Figure 5 shows the relationship between local authority results in reading, writing, and maths between 2017 and 2018. The results show that the majority of local authorities (131) have improved by at least 1 percentage point since 2017.
The black dotted line indicates achieving the same result in 2018 as in 2017. Local authorities that fall above the dotted line improved compared to 2017.
The blue line indicates the line of best fit. This line indicates that local authorities with lower attainment levels tended to see the biggest changes in attainment since 2017, i.e. the gap between black line and blue line is largest at lower attainment levels.
Note that more than one local authority may fall onto a single point on the figure and so the number of points do not sum to the number of local authorities.
10.3 Figure 5: Local authority attainment in reading, writing and maths between 2017 and 2018. England, 2017 and 2018
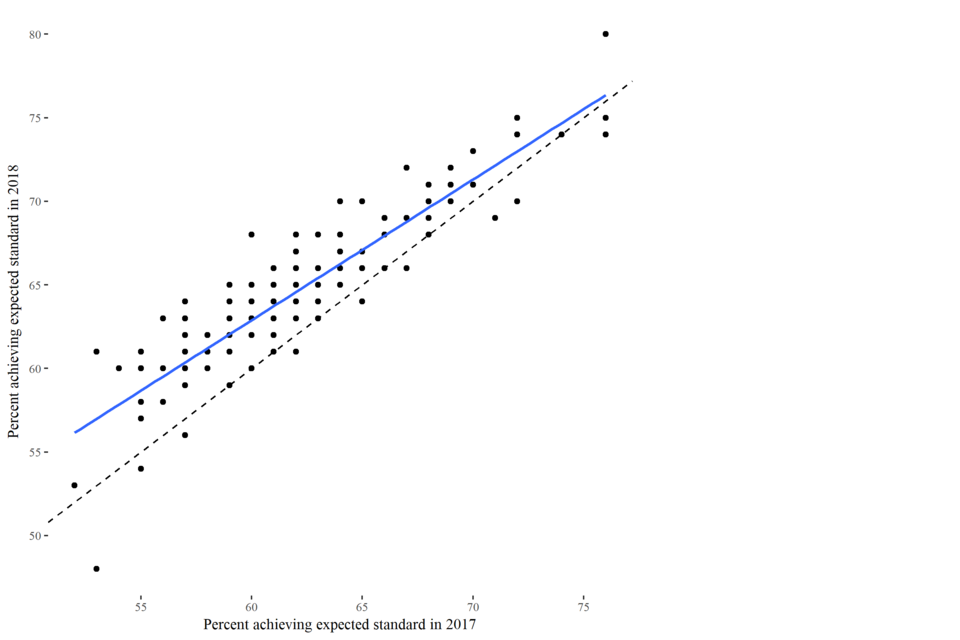
Source: Provisional KS2 data (2018) and Final KS2 data (2017)
11. About these statistics
This publication provides provisional 2018 key stage 2 national curriculum assessment results for pupils in schools in England at national, regional and local authority level. It provides additional information to that in the national curriculum assessments at key stage 2 in England, 2018 (interim) publication published on 10 July 2018. Information on progress made by pupils between the end of key stage 1 and the end of key stage 2 will be provided in the revised release in December. Further breakdown by pupil characteristics will also be provided in the revised release.
11.1 Feedback
We have published these statistics as a HTML publication. We would like your feedback on this new approach and if there is anything we can improve. You can contact us about any aspect of this publication at primary.attainment@education.gov.uk
11.2 Accompanying tables
The following tables are available in Excel format on the department’s statistics website:
| National tables | Attainment |
|---|---|
| Table N1a | Attainment at the end of key stage 2 in reading, writing and mathematics by gender, 2016 - 2018 |
| Table N1b | Attainment in key stage 2 tests by subject and gender, 2018 |
| Table N2a | Attainment at the end of key stage 2 by subject and gender, 2016 – 2018 |
| Table N2b | Distribution of scaled scores by subject, 2018 |
| Table N3 | Attainment in key stage 2 writing teacher assessment by subject and gender, 2018 |
| Table N4 | Attainment of pupils at the end of key stage 2 in academies by length of time open, 2018 |
| Table N5 | Attainment of pupils at the end of key stage 2 by school type, school phase, school cohort size and religious character, 2018 |
| Local authority tables | Attainment |
|---|---|
| Table L1 | Attainment at the end of key stage 2 in reading, writing and mathematics by region, local authority and gender, 2018 |
| Table L2a | Attainment of all pupils at the end of key stage 2 tests by region and local authority, 2018 |
| Table L2b | Attainment of boys at the end of key stage 2 tests by region and local authority, 2018 |
| Table L2c | Attainment of girls at the end of key stage 2 tests by region and local authority, 2018 |
| Table L3a | Attainment of all pupils at the end of key stage 2 teacher assessments by region and local authority, 2018 |
| Table L3b | Attainment of boys at the end of key stage 2 teacher assessments by region and local authority, 2018 |
| Table L3c | Attainment of girls at the end of key stage 2 teacher assessments by region and local authority, 2018 |
When reviewing the tables, please note that:
We preserve confidentiality:
The Code of Practice for Official Statistics requires us to take reasonable steps to ensure that our published or disseminated statistics protect confidentiality.
We suppress some figures:
Values of 1 or 2, or a percentage based on 1 or 2 pupils who achieved; or 0, 1 or 2 pupils who did not achieve a particular level are suppressed. Some additional figures have been suppressed to prevent the possibility of a suppressed figure being revealed. This suppression is consistent with our Statistical policy statement on confidentiality.
We adopt symbols to help identify this:
Symbols are used in the tables as follows: ‘.’ not applicable, ‘*’ LA level data based on a single school |Percentages in this publication are given to the nearest whole number but all gaps and differences have been calculated on unrounded data. Therefore, some figures may not match those produced from the rounded figures shown in the tables.
This is provisional data:
Figures in this publication are provisional. We will publish revised figures in the revised ‘National curriculum assessments at key stage 2’ publication in December. Small differences may not be indicative of a true difference in attainment. This is because there may be small differences between these figures and the revised figures published later in the year. The differences between provisional and revised national figures are usually negligible but LA level figures may be larger. Any unplanned revisions will be made in accordance with our Statistical policy statement on revisions.
We provide underlying data:
The publication is accompanied by national and local authority underlying data and metadata describing this data. This data is provided in csv format so that it can be loaded into the software of your choice.
11.3 Further information will be available
Characteristics breakdowns:
Characteristics breakdowns will be published in the revised publication in December.
Progress measures:
Information on progress for different pupil groups and for local authorities will be published in the revised publication in December.
School level figures:
School level data will be published in the performance tables in December.
Previously published figures:
National curriculum assessments at key stage 2 in England, 2018 (interim)](https://www.gov.uk/government/statistics/national-curriculum-assessments-key-stage-2-2018-interim). SFR69/2017: National curriculum assessments at key stage 2, 2017 (revised). Primary school performance tables 2017
11.4 National statistics
The United Kingdom Statistics Authority has designated these statistics as National Statistics, in accordance with the Statistics and Registration Service Act 2007 and signifying compliance with the Code of Practice for Official Statistics.
Designation can be broadly interpreted to mean that the statistics:
- meet identified user needs
- are well explained and readily accessible
- are produced according to sound methods
- are managed impartially and objectively in the public interest
Once statistics have been designated as National Statistics it is a statutory requirement that the Code of Practice shall continue to be observed. The Department has a set of statistical policies in line with the Code of Practice.
11.5 Technical information
A quality and methodology information document accompanies this publication. This provides further information on the data sources, their coverage and quality and explain the methodology used in producing the data, including how it is validated and processed.
National curriculum assessment figures published in this publication are based on the data that will be used to prepare the 2018 primary school performance tables. This data was shared with schools and local authorities as part of the checking exercise on 31 August 2018. It is based on test and teacher assessment data provided to the Department by the Standards and Testing Agency (STA) on 6 July 2018.
11.6 Contact us
Media enquiries
Press Office News Desk
Department for Education
Sanctuary Buildings
Great Smith St
London
SW1P 3BT
Telephone 020 7783 8300
Other enquiries or feedback
Connor Quinn
Education Data Division
Department for Education
Sanctuary Buildings
Great Smith St
London