3. Tax gaps: Excise (including alcohol, tobacco and oils)
Published 18 December 2012

© Crown copyright 2012
This publication is licensed under the terms of the Open Government Licence v3.0 except where otherwise stated. To view this licence, visit nationalarchives.gov.uk/doc/open-government-licence/version/3 or write to the Information Policy Team, The National Archives, Kew, London TW9 4DU, or email: psi@nationalarchives.gov.uk.
Where we have identified any third party copyright information you will need to obtain permission from the copyright holders concerned.
This publication is available at https://www.gov.uk/government/statistics/measuring-tax-gaps-methodological-annex/3-tax-gaps-excise-including-alcohol-tobacco-and-oils
Introduction
This chapter explains the excise duty gaps, outlining the main components and how they are estimated. It describes the key methods, data sources, and analytical approaches used to estimate the tax gap, broken down by excise duties.
Changes since previous publication
There have been no major methodological updates to the excise tax gap models for ‘Measuring tax gaps 2026 edition’. All models have been updated with revised data inputs in line with usual practice. Some models have been updated with partially projected data, the details of which are explained in detail in the rest of this chapter.
Alcohol
The alcohol duty gap is estimated for beer and spirits separately. The beer duty gap is estimated using a combination of a top-down and a bottom-up model, producing an upper and a lower bound, respectively. A central estimate is produced from the mid-point of the two models. The spirits duty gap is estimated using a top-down model only.
Duty loss from other types of alcohol is estimated as part of the ‘other excise duties’ model.
Spirits and beer upper bound estimate
Overview
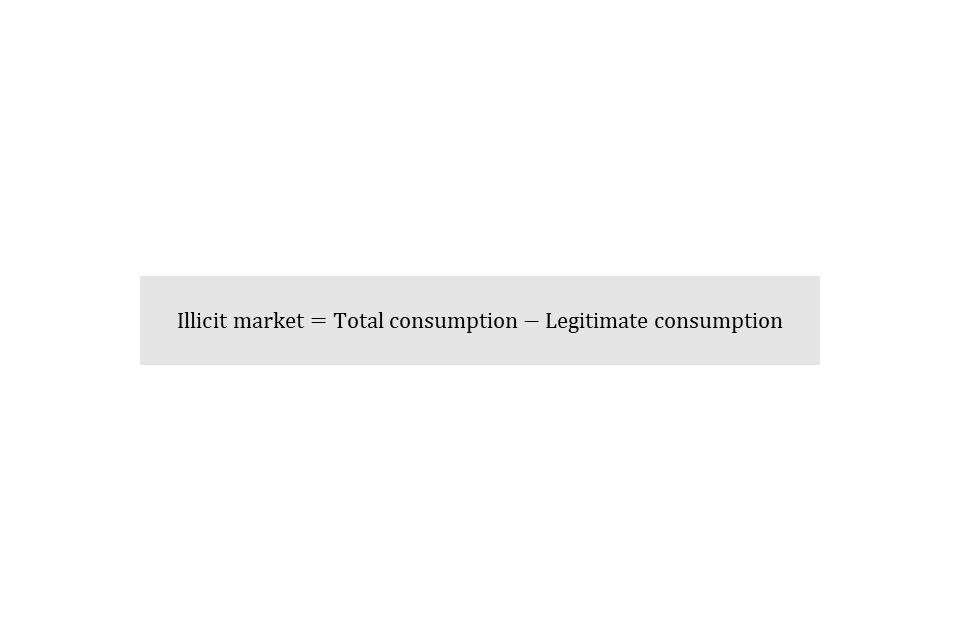
The estimates of the duty gap for spirits and the beer upper bound are produced using a top-down methodology. The estimate is produced by first calculating the volume of total consumption, and then subtracting legitimate consumption, with the residual being the illicit market, from which we derive the tax gap.

Although the spirits and the beer upper bound estimates are calculated using the same underlying methodology, there are some differences.
Details of the methodology, including differences, for the estimation of the spirits and beer upper bound tax gap are provided in the next sections, followed by the lower bound beer tax gap.
Step-by-step calculation
-
Estimate the volume of UK purchased alcohol consumption by scaling up average household consumption of beer and spirits (derived from the Office for National Statistics’ (ONS) Living Costs and Food Survey (LCF)) up to the UK adult population.
-
Estimate the volume of duty-free alcohol consumption by summing alcohol brought into the UK by air and sea (from the International Passenger Survey (IPS)) with goods purchased on-board ferries.
-
Sum UK purchased alcohol with duty-free alcohol to estimate the total UK alcohol consumption volume.
-
Estimate the legitimate consumption volume by summing UK duty paid consumption derived from clearance data with duty-free alcohol consumption.
-
Subtract legitimate consumption from total consumption to estimate the illicit market volume.
-
Combine with duty and VAT rates and average alcohol prices to estimate the duty and VAT losses from the illicit market.
Methodology
Estimating total consumption
The consumption of spirits or beer bought in the UK is estimated using the LCF from the ONS. LCF estimates are weighted by the ONS to adjust for survey non-response. The sample distribution is weighted so that it matches the population distribution in terms of region, age group, sex and household tenure.
Since the LCF only covers purchases within the UK, duty-free shopping is added to the consumption of spirits/beer bought in the UK to give total consumption.
UK purchased alcohol consumption
The consumption of UK purchased spirits and beer in any given year is calculated using the following data:
-
estimates of household spending on spirits/beer from the LCF. This is split by on-licence (e.g. in a pub or restaurant) or off-licence (e.g. bought in a shop and consumed at home) spending
-
the number of adults per household estimated from the LCF
-
average alcohol prices provided by the ONS
-
estimates of the UK adult population (aged 18 or over) from the ONS
-
underreporting uplift factors calculated independently for on-licence and off-licence sectors
The average weekly spending on spirits and beer for UK households is estimated using the LCF. Participating households are asked to record their spending on each type of alcohol (wine, spirits, beer, etc.). There is an additional category for recording drinks purchased as part of a ‘round’ of drinks, which will be referred to as ‘other drinks’.
Some of the ‘other drinks’ purchased will be spirits or beer. The calculations for beer and spirits consumption therefore include a proportion of ‘other drinks’ purchases.
The average weekly spending per household is converted to the volume consumed using the average price of spirits/beer, provided by the ONS. This is then scaled up to an annual figure.
The average consumption per household is then converted to the average per adult, by dividing by the average number of adults in a household. This is scaled up to the UK adult population.
Most under-age drinking is accounted for in the alcohol models. We assume that adults buy most of the alcohol consumed by children. This under-age alcohol consumption is therefore included in the adults’ alcohol spending and is measured by the survey.
Due to the relatively small sample size in the LCF, the average weekly expenditure for spirits or beer is heavily influenced by extreme expenditure values in the data. Outliers in the data have been capped at the 99th percentile.
Duty-free shopping
Alcohol purchased overseas by UK residents and brought into the UK to be consumed is referred to as duty-free shopping. In previous publications it was referred to as cross-border shopping. It is added to the UK household purchases to estimate total consumption.
Duty-free shopping is calculated using two data sources:
-
the International Passenger Survey (IPS) from the ONS
-
commercially provided data about purchases on-board ferries
The IPS provides estimates of the volume of spirits and beer that an average adult traveller brings into the country, separately for air and sea passengers. The IPS figures are weighted by the ONS, scaling up the survey data to estimate duty-free alcohol entering the UK. This estimate does not cover sales made on-board ferries, so commercially provided data about deliveries of spirits/beer to ferries are used to supplement the IPS figure and provide a total duty-free shopping estimate.

Estimating legitimate consumption
Legitimate consumption is calculated as UK duty paid consumption plus duty-free shopping.

Estimates of UK duty paid consumption are taken directly from returns to HMRC of the volumes of spirits/beer on which duty has been paid. Duty is payable once alcoholic goods are released onto the UK market for consumption. Amounts released are referred to as ‘clearances’. For spirits, the volumes of ready-to-drink products have been removed from spirits clearances to obtain figures for spirits only. Spirit-based ready-to-drinks (RTDs) are packaged beverages that are sold in a prepared form, ready for consumption, such as alcopops. The spirits based ready-to-drink products duty gap is included within the other excise duties gap.
The duty-free shopping component of legitimate consumption is calculated in the same way as for total consumption: alcohol bought overseas and brought into the UK, plus alcohol bought on-board ferries.
Estimating the illicit market
Total consumption is the sum of duty-free shopping and total consumption of UK purchased alcohol. The illicit market volume is calculated by subtracting legitimate consumption from total consumption.

Conversion to monetary losses
The alcohol duty losses associated with the illicit market are calculated by multiplying the illicit market volume by the spirits/duty rates. The VAT losses are calculated by multiplying the illicit market volume by average price, then multiplying by the VAT fraction. The duty and VAT losses are added together to estimate the total alcohol tax gap. For spirits, the duty loss is estimated by assuming an average spirits strength of 38%.
The average spirits/beer prices are derived from data provided by the ONS. The prices used in the model are weighted for on-licence and off-licence purchases and for different types of spirits/beer.
The VAT fraction is the portion of the retail price that is VAT — a 20% VAT rate is equivalent to a one-sixth VAT fraction. For example, if an item costs £100 excluding VAT, then 20% VAT is added, the final retail price will be £120. The VAT portion of the final retail price is £20, or one-sixth. VAT fractions are calculated annually to capture changes in the VAT rate. This method assumes that VAT is lost on all purchases. In some cases, the final illicit product is sold in legitimate outlets and so this may not always be the case, and this will be an overestimate of revenue losses.
Model adjustments
Spirits uplift factor
The LCF may underestimate total UK alcohol purchases due to:
-
respondent underreporting
-
underrepresenting certain subgroups with above average alcohol consumption
-
not covering the full extent of the alcohol market (e.g. businesses and tourists)
An uplift factor is necessary to correct for these biases. We calculate the uplift factor by following these steps:
Step 1 — base year consumption
Take a base year in which it is believed there was a negligible illicit market. This means HMRC clearances should be a true indicator of total consumption and will exceed the survey-based estimate of total consumption.
Step 2 — separate on-licence and off-licence consumption
Separate total and legitimate consumption into on-licence and off-licence consumption.
Step 3 — calculate on-licence uplift
Divide legitimate on-licence consumption (clearances) by the survey-based estimate of total on-licence consumption to derive an on-licence uplift factor.
Step 4 — calculate off-licence uplift
Divide legitimate off-licence consumption (clearances) by the survey-based estimate of total off-licence consumption to derive an off-licence uplift factor.
To reduce sampling error, the uplift factor is derived by taking the average of 3 years of data from the base years: 1990 to 1991, 1991 to 1992 and 1992 to 1993.
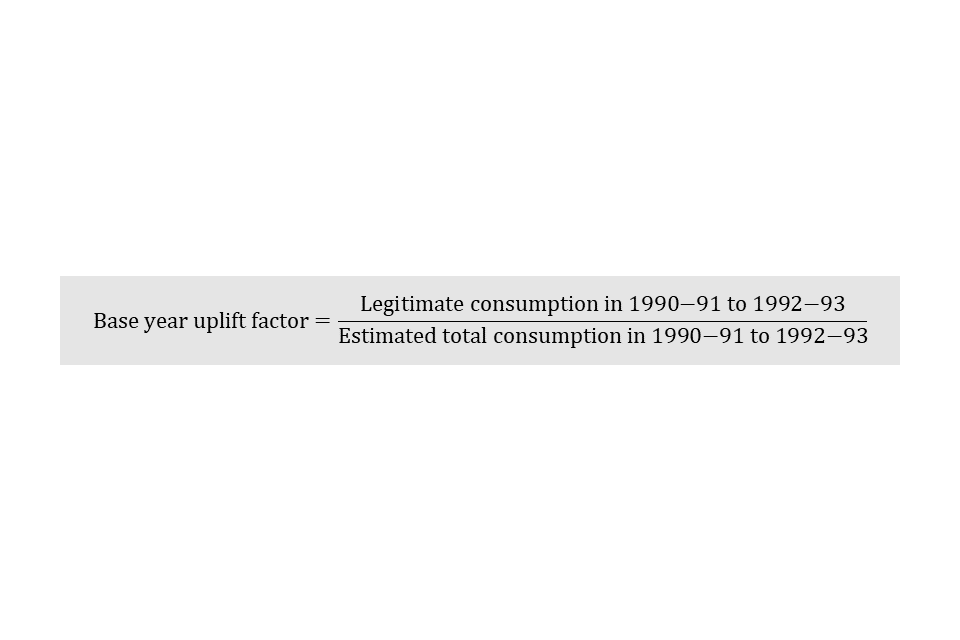
The uplift factors for on-licence and off-licence are 3.5 and 2.0, respectively. They are static and applied to the whole time series.
Beer uplift factor
The basis for the beer uplift factor is similar to spirits. However, beer consumption is split into draught and packaged consumption.
Step 1 — estimate draught consumption
Draught consumption is estimated by applying the proportion of on-licence sales that are draught (from British Beer and Pub Association data) to total on-licence beer consumption (LCF) and to legitimate consumption (clearances).
Step 2 — calculate underreporting of draught consumption
In any given year, we assume the illicit market in draught beer is negligible, making the draught under-reporting uplift the ratio of legitimate consumption to estimated total consumption.
Step 3 — calculate base year uplifts
As with spirits, we take base years when the whole beer illicit market was assumed to be negligible; tax years 1990 to 1991 through to 1992 to 1993. The base year uplift is the ratio of legitimate consumption to total consumption, calculated separately for draught and packaged beer. An average of the three base years is taken.
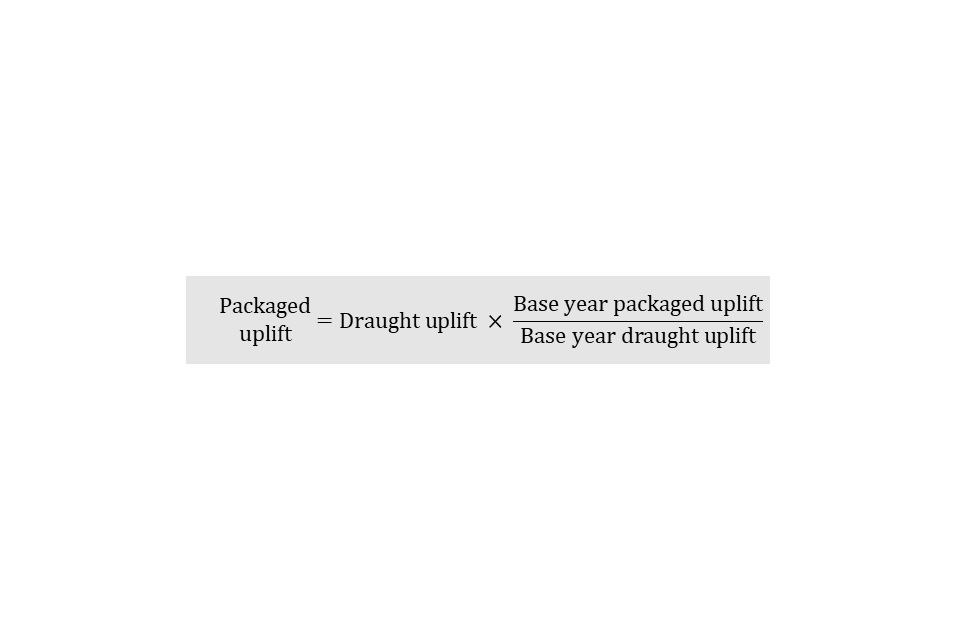
Step 4 — calculate the packaged to draught uplift ratio
Next, we assume the ratio of underreporting between draught and packaged beer has remained constant since the base year. The ratio is calculated as the base year packaged uplift divided by the base year draught uplift.
Step 5 — calculate the packaged uplift for a given year
For any given year, the packaged beer uplift is calculated by multiplying the current year draught uplift by the fixed packaged to draught ratio.
Since 2020 to 2021, the packaged beer uplift factor has been projected based on an average of the previous 3 years, resulting in an uplift between 2.8 and 3.0. This is due to model sensitivities around the methodology for calculating the uplift factor.
The net tax gap
In several tax gap models, the gross tax gap is calculated from the tax liability, then adjusted by subtracting compliance yield and non-payment to produce the net tax gap. This adjustment is not applied to the top-down beer and spirits duty gaps. Instead, these models estimate the duty gap by subtracting legitimate consumption from total consumption. Legitimate consumption is based on duty that has been declared and paid to HMRC (for example, through clearances), which already reflects the impact of HMRC’s compliance activity. As a result, this approach directly estimates the net duty gap without requiring any further adjustment.
Data issues and limitations
Projection of total consumption
The number of LCF responses reporting spirits expenditure is small relative to the survey’s sample size and so estimated average household expenditure can vary substantially between years. A 3-year rolling average is applied to the final total consumption estimate for spirits to reduce this volatility and make the tax gap trend clearer.
The spirits tax gap has been projected from 2020 to 2021 onwards based on the illicit market share for 2019 to 2020. This is due to data from recent years producing unreliable estimates.
Duty-free shopping
The IPS was suspended during COVID-19. As a result, 2020 to 2021 was projected using a 3-year average of duty-free alcohol purchases (from 2017, 2018 and 2019 IPS data). This was applied to ONS data on visitor numbers and spending to derive the 2020 to 2021 estimate.
Estimates for goods bought on ferries in 2023 to 2024 were unavailable, and so they were projected based on the average sales from 2022 to 2023.
In 2024, the ONS updated the IPS methodology, so duty-free alcohol purchase data for 2024 to 2025 was unavailable. The share of alcohol consumption from duty-free shopping for 2022 to 2023 and 2023 to 2024 was calculated, then these percentages were averaged and applied to total UK alcohol consumption in 2024 to 2025 to estimate the duty-free shopping volume for that year.
Upper and lower confidence intervals in the spirits estimate
The variation in the LCF is used to construct 95% confidence intervals around the central estimate. They indicate the potential size of chance fluctuations in the estimate due to sampling error. They do not account for systematic error from the model assumptions in the central estimate.
Sources of error
In summary, the main sources of error that may affect the accuracy of the spirits and beer upper bound tax gap estimates are:
-
total consumption is based LCF data, which may be affected by sampling variation and under coverage of high-risk groups, and is sensitive to underreporting
-
duty-free consumption relies on survey data and commercial sources that have gaps, methodological changes, and periods of projection
-
adjustments to correct for underreporting rely on historical ‘base years’, which may not reflect current consumption behaviour or market changes
-
converting alcohol volumes to tax losses requires assumptions on average prices, alcohol strength, and VAT treatment, which may not reflect the characteristics of illicit products and can lead to over- or under-estimation
Beer lower estimate
Overview
The beer tax gap lower estimate is produced using a bottom-up methodology. This means estimates of the illicit market are made directly, by estimating the fraud components that make up the illicit market. The following types of illicit beer are included in the lower estimate:
-
diversion of UK-produced beer
-
drawback fraud
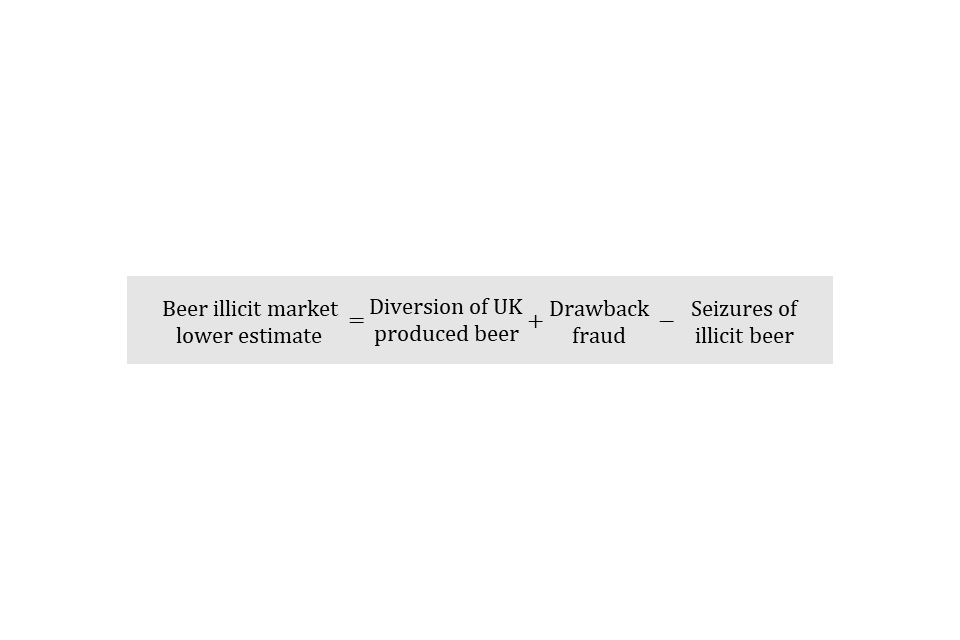
Some of this illicit beer is recovered through HMRC compliance activity, so this is subtracted to give the net tax gap. The tax gap estimate is defined as diversion of UK produced beer, plus drawback fraud, minus seizures of illicit beer.
A number of beer fraud channels are not included in this methodology as we are currently unable to estimate them. This is one of the reasons it is a lower bounding estimate. These include:
-
smuggled beer
-
diversion of foreign produced beer
-
counterfeit beer
-
any other fraud we do not know about
Step-by-step calculation
The lower bound beer duty gap is estimated as follows:
-
Sum dispatches from warehouses and brewers to the EU.
-
Calculate dispatches to selected EU countries by multiplying by the proportion of all EU dispatches going to selected EU countries.
-
Estimate volume of drawback claims from EU countries.
-
Calculate drawback claims from selected EU countries by multiplying by the proportion of all EU dispatches going to selected EU countries.
-
Estimate legitimate demand in selected EU countries by taking dispatches to those countries in a base year and subtracting duty-free shopping in the same year.
-
Estimate the illicit market by adding dispatches and drawback to selected EU countries, subtracting legitimate demand from those countries, then subtracting seizures of illicit beer.
Methodology
Diversion of UK-produced beer
Diversion fraud happens when beer is sent to the EU without paying duty, then illegally brought back into the UK using false paperwork. The taxes are not declared on the beer, and the illicit product enters the UK market.
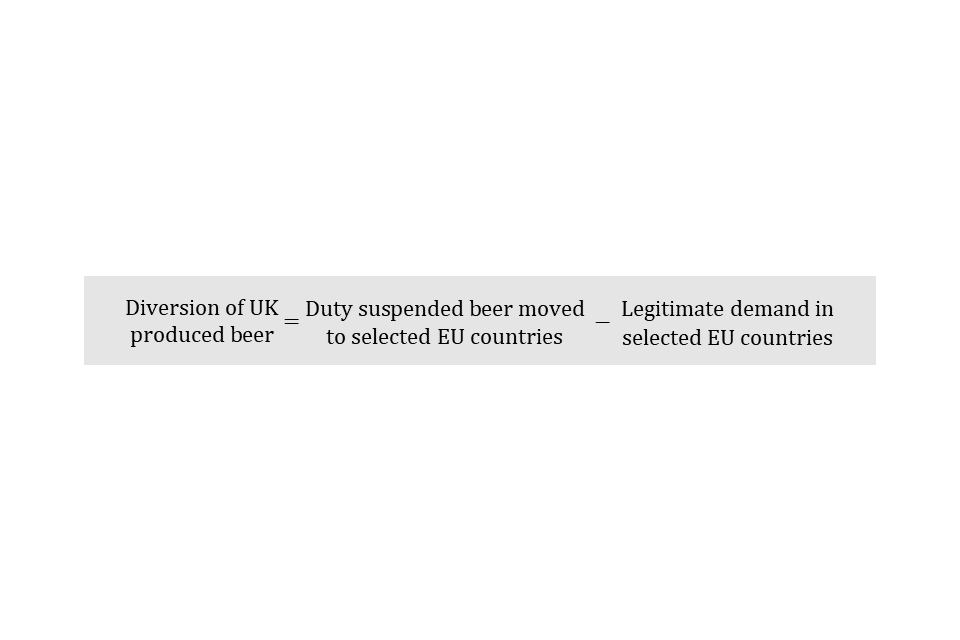
We estimate that diversion fraud is equal to the amount of beer moved without paying duty from the UK to certain EU countries, minus legitimate demand for UK branded beer in those countries. That is, we assume that any UK beer which is not feeding demand abroad will be diverted back to the UK illicit market.
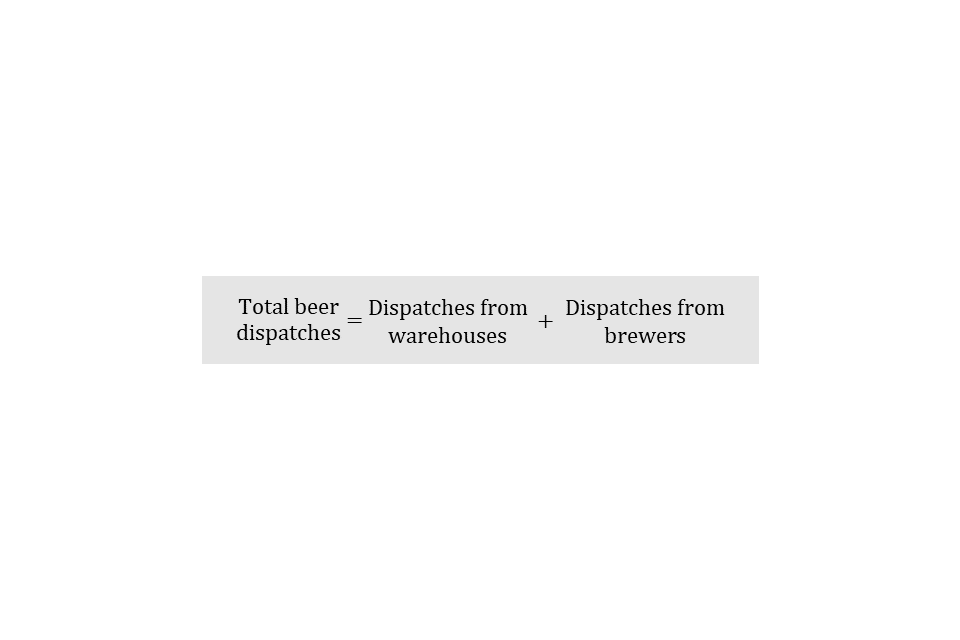
Beer moved in duty suspense from the UK to the EU includes dispatches from excise warehouses and brewers. Dispatches from excise warehouses are taken directly from Excise Warehouse Returns (W1 form). Dispatches from brewers are estimated using data from Beer Duty Returns (EX46 form). Total beer dispatches are calculated by summing warehouse and brewer dispatches.
To preserve the lower bounding nature of this estimate, we only include dispatches to certain EU countries. These countries have been selected based on proximity to the UK, the differential in price, operational indications of risk and patterns of supply.
The estimate of beer dispatches cannot be broken down to recipient country. Therefore, we use UK trade data. The proportion of beer dispatched to the selected EU countries is taken from UK trade data and applied to the estimated total dispatches to produce an estimate for dispatches to the selected countries.
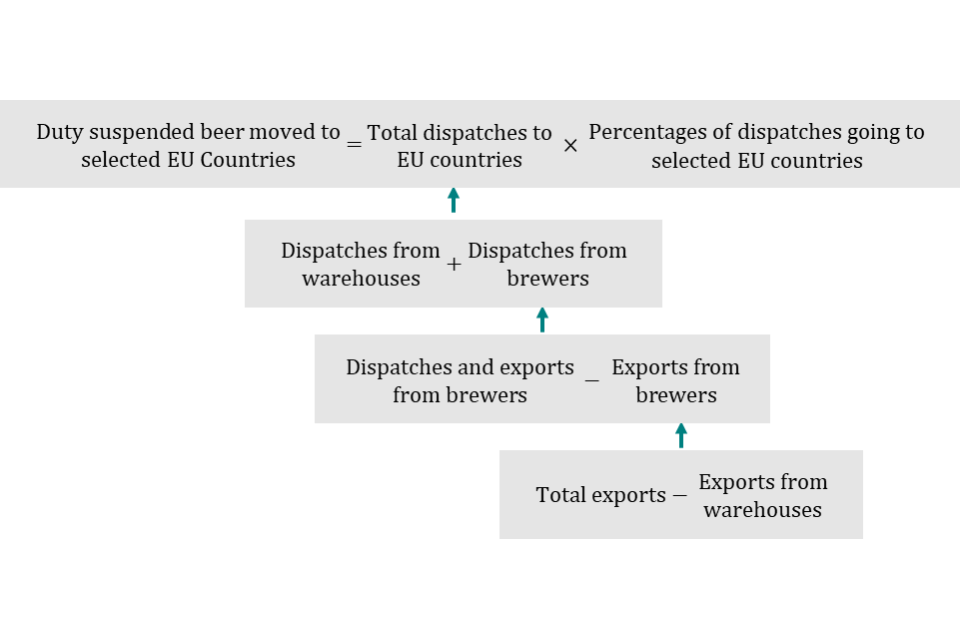
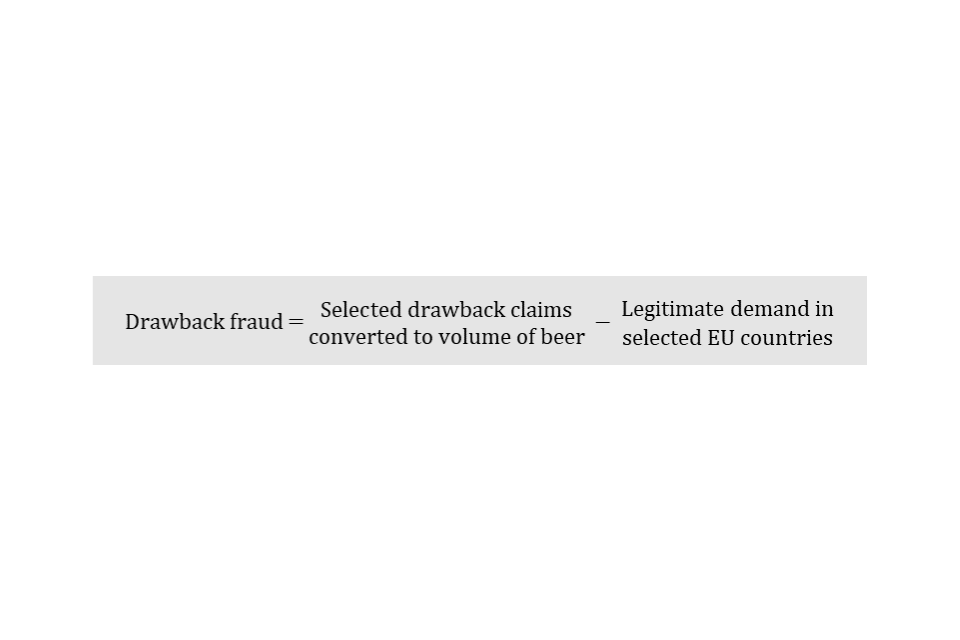
Drawback fraud
Drawback fraud occurs when goods are moved to the EU and the duty is reclaimed via drawback (a refund of UK beer duty). Duty is then paid at the lower rate in the destination country, and the goods are illicitly returned to the UK.
To estimate drawback fraud, we estimate the volume of beer corresponding to certain drawback claims, then subtract the legitimate demand for beer in the selected destination countries.
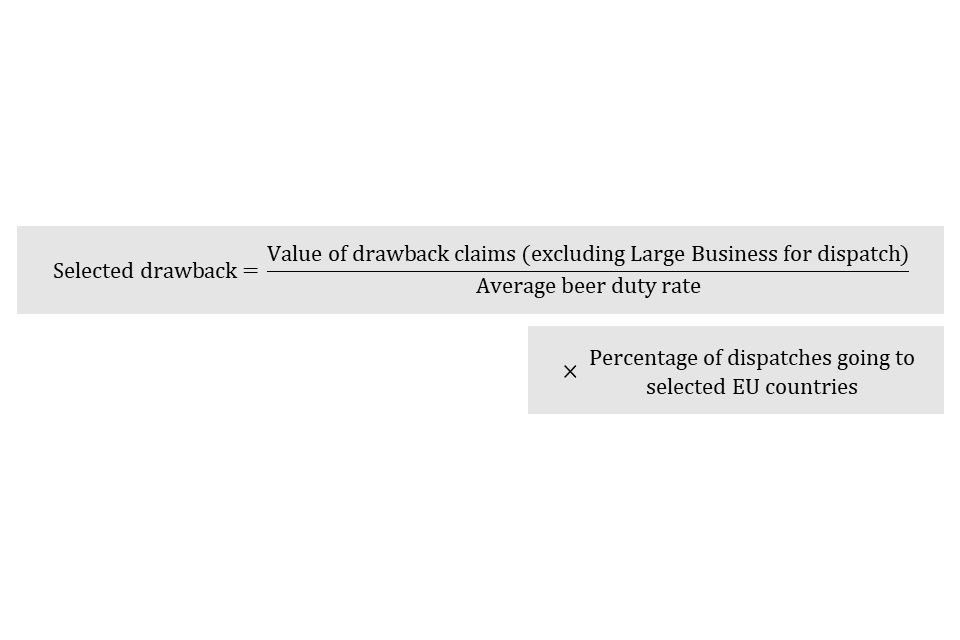
To preserve the lower bound nature of this estimate, we include drawback only where it is claimed on goods dispatched by businesses outside HMRC’s Large Business population, meaning that some potentially fraudulent activity is excluded and the estimate is deliberately conservative.
The value of these drawback claims is converted to volume of beer by dividing by the average duty rate for beer.
The volume is then adjusted using the proportion of dispatches going to the selected EU countries. This gives an estimate of the amount of beer going to the selected countries with drawback claimed by small and medium sized businesses.
Model adjustments
Legitimate demand in selected EU countries
Some of the beer moved to the selected EU countries will be supplying legitimate demand within those countries, rather than being diverted to the UK illicit market. We make one overall estimate of legitimate demand in the selected EU countries and subtract it from the sum of dispatches and drawback.
We have purposely overestimated legitimate demand by only accounting for the riskiest countries, which produces an underestimate of the illicit market, maintaining the lower bounding nature of the tax gap estimate.
The estimate of legitimate demand in other countries sums duty-free shopping bought by UK residents and legitimate consumption abroad. The latter may include:
-
consumption by UK expatriates
-
consumption by UK residents while abroad
-
consumption by foreign nationals
-
beer in transit to other countries

Duty-free shopping is estimated using data from the IPS. Only passengers from the selected EU countries are included.
Legitimate consumption of UK produced beer abroad
We could not find reliable data on legitimate consumption of UK produced beer abroad. So, we estimate it based on the assumption that in a certain year, when the illicit market upper estimate was low, there was negligible illicit activity meaning all dispatches to the selected EU countries were consumed legitimately. This is likely to provide an overestimate of legitimate consumption abroad, as there would likely be some level of fraud in these years. This supports the methodology being a lower estimate of the tax gap.
For stability, an average of 2 years is used: 2000 to 2001 and 2001 to 2002. We refer to these 2 years as the ‘base year’.
Brewers return data is not available for years prior to 2007. Consequently, we use an alternative data source, UK trade data, to estimate dispatches in the base year.
In the base year we assume that all dispatches supply either duty-free shopping by UK residents or legitimate consumption abroad. We subtract an estimate of duty-free shopping in the base year from dispatches in the base year; the remainder is assumed to be legitimate consumption abroad.

We believe that UK trade data may underestimate beer dispatches in the base year as it does not record certain types of beer movement. These include:
-
goods in transit
-
deliveries to embassies
-
deliveries to Navy, Army, and Air Force Institutes (NAAFI)
Additionally, as the threshold for recording goods on UK trade data is relatively high, beer may have a higher proportion of small traders than other commodities. This may mean the standard adjustment applied to UK trade data to account for small traders may be too low for beer.
To account for these concerns, we uplift the UK trade data. There is very little evidence to indicate the actual scale of uplift required. Comparison with our calculated dispatches in later years led us to apply a factor of 2. Again, the high level of this adjustment may result in this being an overestimate of legitimate demand. This is in keeping with the lower bounding methodology for the tax gap, as higher legitimate demand would see a lower estimate for the illicit market.
Illicit market lower estimate
To summarise, the beer illicit market lower estimate is calculated by summing selected dispatches and selected drawback, before subtracting seizures of illicit beer and legitimate demand in selected countries. Legitimate demand in selected countries is defined as duty-free shopping of UK residents plus legitimate consumption abroad.
Data issues and limitations
Since the tax year 2016 to 2017, the beer illicit market lower estimate has been projected to better reflect changes in fraud. This is calculated by keeping the gross tax gap constant, whilst using operational intelligence as a proxy to capture the impact of changes in the illicit market.
Implied mid-point estimate of the beer duty gap
The implied mid-point estimate is calculated as the average of the upper and lower estimates. It is only intended as an indicator of long-term trend — the true tax gap could lie anywhere within the bounds.
The bounds do not take account of any systematic tendency to over- or under-estimate the size of the tax gap that might arise from the modelling assumptions.
Sources of error
In summary, the following sources of error may affect the accuracy of the lower bound beer tax gap estimate:
-
several illicit channels (for example smuggling, counterfeit beer, and diversion of foreign-produced beer) are excluded because they cannot be reliably estimated, meaning the model omits part of the illicit market
-
the model assumes that any UK beer sent to selected EU countries above estimated legitimate demand is diverted back to the UK, which may not fully reflect true consumption patterns
-
dispatches cannot be observed by destination country, so UK trade data proportions are applied, introducing uncertainty where these proxies do not accurately reflect actual flows
-
legitimate consumption abroad is based on assumptions and historical base year data, which may overestimate legitimate demand
-
the illicit market lower estimate has been projected since 2016 to 2017
Uncertainty rating
The uncertainty rating for the beer and spirits tax gap estimates is ‘very high’. While the top‑down approach should capture all forms of non‑compliance, some high‑risk groups may be underrepresented, and several key assumptions are long-standing and have not been updated using recent evidence. The LCF has a strong sample size and methodology, but uncertainty remains around underreporting of alcohol consumption and under coverage of some population subgroups. The projection of the beer bottom-up model since 2016 to 2017, and the projection of the spirits model since 2020 to 2021, means true figures are likely to be markedly different from the published estimates.
Tobacco
Overview
The tobacco duty gap, which includes cigarettes and hand-rolling tobacco is estimated using a top-down model.
The model estimates the volume of total consumption and then subtracts legitimate consumption. The residual is the estimated illicit market, from which we derive the tax gap.
Step-by-step calculation
-
Estimates of prevalence (proportion of the population that smoke) and consumption per smoker calculated from the Opinion and Lifestyle Survey. Historically figures sourced from the General Lifestyle Survey (GLF).
-
Apply an uplift factor to account for under-reporting of self-declared tobacco consumption.
-
Apply an uplift factor to account for survey non-declaration using medical evidence collected during Health Survey for England.
-
Estimates of total consumption is a product of the estimates of smoking prevalence and consumption per smoker for declared and undeclared smokers.
-
Total consumption is scaled using estimates of the adult population (aged 16 or above) provided by the Office for National Statistics (ONS).
-
Calculate upper and lower bounds for total consumption.
-
Estimates of legitimate consumption calculated using UK duty paid consumption and duty-free shopping volumes.
-
Illicit market is calculated as the sum of declared and undeclared total consumption, minus legitimate consumption.
-
Illicit market volumes are converted to monetary losses.
Methodology
Estimating total consumption
The estimate of total UK cigarettes and hand-rolling tobacco consumption is a product of cigarette and hand-rolling tobacco smoking prevalence (proportion of the population that smoke) and consumption per smoker for declared and undeclared smokers.
The estimates of prevalence and consumption per smoker are calculated using the Opinions and Lifestyle Survey.
The model then uplifts estimated consumption figures to account for:
-
under-reporting of self-declared tobacco consumption
-
survey non-declaration using medical evidence collected during Health Survey for England
Opinions and Lifestyle Survey
The Opinions and Lifestyle Survey is a monthly survey of adults in Great Britain by the ONS that collects data on people’s experiences, attitudes and behaviours across a wide range of topics. It measures smoking prevalence and average daily tobacco consumption.
Prior to 2012, tobacco consumption was estimated using the GLF. The Opinions and Lifestyle Survey data on dual smokers was used to adjust these estimates for upper and lower bounds. Since 2012, estimates for prevalence and average consumption per smoker have been based solely on data from the Opinions and Lifestyle Survey.
Duty-free shopping
Tobacco purchased overseas by UK residents and brought into the UK to be consumed is referred to as duty-free shopping. In previous publications it was referred to as cross border shopping.
Duty-free shopping is calculated using the International Passenger Survey (IPS) from the ONS.
The IPS provides estimates of the number of cigarettes and/or hand-rolling tobacco that an average adult traveller brings into the country, separately for air and sea passengers. The IPS figures are weighted by the ONS, scaling up the survey data to estimate the duty-free tobacco entering the UK.
This estimate, however, does not cover sales made on-board ferries. Commercially provided data about deliveries of cigarettes to ferries is used to supplement the duty-free shopping estimate.
Estimating legitimate consumption
Legitimate consumption is calculated as UK duty paid consumption plus duty-free shopping.
Estimates of UK duty paid consumption are taken directly from returns to HMRC of the volumes of cigarettes and hand-rolling tobacco on which duty has been paid. Duty is payable once tobacco goods are released onto the UK market for consumption. Amounts released are referred to as ‘clearances’.
The legitimate consumption component of duty-free shopping is calculated in the same way as for total consumption: tobacco bought overseas and brought into the UK.
Estimating the illicit market
The illicit market is calculated by subtracting legitimate consumption from the sum of declared and undeclared total consumption.
The proportion of the total market that is supplied through the illicit market is determined by dividing illicit market volume by total consumption volume. This is termed the illicit market share.
Conversion to monetary losses
The tobacco duty losses associated with the illicit market are calculated by multiplying the illicit market volume by the tobacco duty rates. The VAT losses are calculated by multiplying the illicit market volume by average price, then multiplying by the VAT fraction. The duty and VAT losses are added together to estimate the total tobacco tax gap.
The average price is taken as the weighted average price of all cigarettes or hand-rolling tobacco that were UK duty paid.
The VAT fraction is the portion of the retail price that is VAT — a 20% VAT rate is equivalent to a one-sixth VAT fraction. For example, if an item costs £100 excluding VAT, then 20% VAT is added, the final retail price will be £120. The VAT portion of the final retail price is £20, or one-sixth. VAT fractions are calculated annually to capture changes in the VAT rate. This method assumes that VAT is also lost on all purchases. In some cases, the final illicit product is sold in legitimate outlets where VAT is paid, so this method results in an overestimate of revenue losses.
Model adjustments
Uplift factor for underreporting of self-declared tobacco consumption
To account for under-declaration of tobacco consumption, an uplift factor is calculated by taking estimates of total consumption from the GLF in a base year. For cigarettes, the base year is 1996 to 1997, and for hand-rolling tobacco it is an average of 3 years, 1983 to 1986. Estimates of total consumption in base years are compared with consumption of actual clearances to HMRC and an estimate of legitimately purchased cigarettes from abroad.

The uplift factors for the cigarettes and hand-rolling tobacco estimates are 1.5 and 1.1, respectively.
Uplift factor for survey non-declaration
The Health Survey for England is an official statistics survey commissioned by the Department of Health and Social Care and currently published by NHS Digital/NHS England. It is designed to track long‑term trends in population health and health‑related behaviours.
To address the potential under-reporting of tobacco consumption in surveys, an uplift factor is applied based on medical evidence obtained from the Health Survey for England. This provides cotinine levels measured in saliva samples, which serve as biomarkers for smoking. By comparing the two we can correct for any non-declaration of smoking behaviour in the Opinions and Lifestyle Survey, ensuring smoking prevalence is not underestimated within the tobacco duty gap estimate.
The net tax gap
In several tax gap models, the gross tax gap is calculated from the total tax liability, then adjusted by subtracting compliance yield and non-payment to produce the net tax gap. This adjustment is not applied to the top-down tobacco duty gap. Instead, this model estimates the duty gap by subtracting legitimate consumption from total consumption. Legitimate consumption is based on duty that has been declared and paid to HMRC (for example, through clearances), which already reflects the impact of HMRC’s compliance activity. As a result, this approach directly estimates the net duty gap without requiring any further adjustment.
Data issues and limitations
Projection of total consumption
For the tax years 2018 to 2019 and 2019 to 2020, we adjusted the consumption data to reflect a change in the Opinions and Lifestyle Survey design. We used time series discontinuity analysis from the ONS to understand how the changes affected the data. We also used an uplift factor based on comparing the two versions of the questionnaire. This uplift is applied to average daily consumption survey data.
For the tax years from 2020 to 2021 up to 2022 to 2023 the ONS temporarily removed tobacco consumption questions from their Opinions and Lifestyle Survey used to calculate total consumption. These questions were reintroduced from tax year 2023 to 2024. The missing years have been imputed using linear interpolation based on illicit market share data from tax years 2019 to 2020 and 2023 to 2024.
As a result of modifications to question sequencing and funding limitations, certain consumption data for 2024 to 2025 are incomplete. Accordingly, projected consumption data for this period have been estimated based on established historical trends.
Duty-free shopping
The IPS was suspended during COVID-19. As a result, 2020 to 2021 was projected using a 3-year average of duty-free alcohol purchases (from 2017, 2018 and 2019 IPS data). This was applied to ONS data on visitor numbers and spending to derive the 2020 to 2021 estimate.
Estimates for goods bought on ferries in 2023 to 2024 were unavailable, and so they were projected based on the average sales from 2022 to 2023.
In 2024, the ONS updated the IPS methodology, so duty-free tobacco purchase data for 2024 to 2025 was unavailable. The share of tobacco consumption from duty-free shopping for 2022 to 2023 and 2023 to 2024 was calculated, then these percentages were averaged and applied to total UK tobacco consumption in 2024 to 2025 to estimate the duty-free shopping volume for that year.
Upper and lower bounds for total consumption
The uncertainties in the survey data used to create these estimates mean that it is not possible, with sufficient accuracy, to produce a single point estimate of total consumption. However, due to the methodology we use, it is difficult to produce confidence intervals. Instead, we use the survey data to produce an upper bound and lower bound for total consumption. This allows us to produce a range for total consumption that takes account of the uncertainty in the underlying data.
The one difference between the upper and lower bound calculations is the treatment of dual smokers. Dual smokers are individuals who consume both cigarettes and hand-rolling tobacco.
Dual smokers: mainly cigarettes, are individuals who smoke cigarettes and hand-rolling tobacco, but mainly cigarettes.
Dual smokers: mainly hand-rolling tobacco, are individuals who smoke cigarettes and hand-rolling tobacco, but mainly hand-rolling tobacco.
The upper bound of total cigarette or hand-rolling tobacco consumption is calculated firstly by estimating consumption levels from smokers who only smoked cigarettes or hand-rolling tobacco. This is added together with consumption of cigarettes or hand-rolling tobacco that could be smoked by dual smokers respectively.


The lower bound of total cigarette or hand-rolling tobacco consumption is calculated firstly by estimating consumption levels from smokers who only smoked cigarettes or hand-rolling tobacco. This is added together with consumption of cigarettes or hand-rolling tobacco that could be smoked by dual smokers respectively.


Sources of error
In summary, the main sources of error that may affect the accuracy of the tobacco tax gap estimate include:
-
total consumption is based on the Opinions and Lifestyle Survey data, which may be affected by sampling variation and under coverage of high-risk groups, and is sensitive to underreporting
-
duty-free consumption relies on survey data and commercial sources that have gaps, methodological changes, and periods of projection
-
adjustments to correct for underreporting rely on historical ‘base years’, which may not reflect current consumption behaviour or market changes
-
converting tobacco volumes to tax losses requires assumptions on average prices and VAT treatment, which may not reflect the characteristics of illicit products and can lead to over- or under-estimation
Uncertainty rating
The uncertainty rating for the tobacco tax gap estimate is ‘high’. The model accounts for whole tax base where tobacco consumption occurs. However, the consumption survey doesn’t cover underaged smoking. While the model data is clear, projecting total consumption and duty-free volumes for 2024 to 2025 adds uncertainty.
Hydrocarbon oils (fuel duty)
Overview
The hydrocarbon oils duty gap arises from the misuse of rebated diesel (red diesel) which is taxed at a reduced rate. In this chapter, we refer to this as the diesel tax gap.
We estimate the diesel tax gap using a 5-step bottom-up methodology. We build the estimate up step-by-step, based on fuel consumption data, HMRC receipts and a random roadside survey, measuring illicit diesel use in road vehicles to obtain our estimate of total revenue loss. This replaced the previous top-down methodology from 2016 to 2017 onwards.
The misuse of other fuels, such as petrol, is excluded as it is believed to be negligible and cannot currently be measured. However, other fuel duties do contribute to the hydrocarbon oils duty total theoretical liabilities.
Step-by-step calculation
-
Measure legitimate diesel consumption using HMRC clearances.
-
Measure proportion of vehicles misusing rebated fuel using random roadside surveys, known as the strike rate.
-
Estimate illicit diesel consumption using the strike rate and legal consumption.
-
Estimate revenue loss from unpaid duty and VAT to derive gross diesel tax gap.
-
Calculate the net diesel tax gap by subtracting compliance yield from the gross diesel tax gap.
Methodology
A bottom-up approach is used to estimate the diesel tax gap from the tax year 2016 to 2017 onwards. This means we build the estimate step-by-step from direct observations of fuel consumption data, HMRC clearances (the volume of diesel on which duty has been paid), and evidence from random roadside surveys measuring non-compliance by road vehicles.
Estimates before 2016 to 2017 were calculated using a top-down methodology, which compared total fuel consumption with declared consumption. This was no longer fit for purpose from 2013 to 2014 as it was not sensitive enough to measure the low diesel tax gap. The 2013 to 2014 estimate was therefore rolled forward until the current approach was introduced in 2016 to 2017. Estimates from 2016 to 2017 onwards are therefore not directly comparable with earlier years.
We calculate the Great Britain (GB) and Northern Ireland (NI) diesel tax gaps separately, but the methodology is the same in each case.
Measuring legitimate diesel consumption
We gather HMRC diesel clearance volumes (the amount of diesel on which duty has been paid) to estimate legitimate consumption. We then split them between GB and NI using road transport consumption statistics published by the Department for Energy Security and Net Zero (DESNZ).
Measuring the misuse of rebated fuel
We use roadside surveys to estimate the proportion of vehicles misusing rebated fuel. These surveys are carried out over a three-month period every three years, testing 1,900 vehicles across GB and NI for illegal use of rebated diesel. The proportion of tested vehicles found to be misusing rebated diesel is referred to as the ‘strike rate’. As with legitimate consumption, we calculate separate strike rates for GB and NI. The strike rates from the most recent survey, conducted in 2023, were 0.33% for GB and 0.89% for NI.
Estimating illicit diesel consumption
We estimate illicit consumption using the strike rate and legitimate consumption. Illicit consumption is calculated by dividing the strike rate by one minus the strike rate and then multiplying this by legitimate consumption.
This assumes that total fuel consumption is made up of legal and illicit use, and that the strike rate represents the proportion of total consumption that is illicit. This provides our estimate of the volume of rebated fuel being used illicitly.
Estimating revenue Loss
Rebated fuel is subject to lower duty rates and a lower retail price including VAT. When rebated fuel is used outside the rules governing eligible vehicles and permitted uses, revenue is lost because that fuel should have been subject to a higher rate of fuel duty and associated VAT.
We estimate the revenue loss by applying the difference in fuel duty rates and VAT paid, between rebated and standard fuel to the estimated illicit consumption. Average retail prices used to estimate VAT paid are taken from published data from the DESNZ.

Calculating the gross tax gap
The diesel tax gap is calculated as the sum of the duty loss and VAT loss.
This provides the gross duty gap, which represents the total revenue lost from illicit consumption before adjusting for compliance activity.
Data inputs
There are five data inputs used to estimate the diesel tax gap:
- HMRC Clearance volumes
- Road transport consumption statistics published by DESNZ
- Randomised roadside survey on the misuse of rebated fuel in road vehicles
- Restoration fees (compliance yield)
- Fuel retail price statistics from DESNZ
HMRC clearances
HMRC clearances are the returns that HMRC receives from the volumes of diesel on which duties have been paid. These figures are derived from HMRC quarterly statistics on receipts and clearances by oil type, together with the duty rates in force in the UK.
Random survey
The randomised roadside survey is carried out every three years over a three-month period. In each survey, 1,900 vehicles across the UK (1,500 Great Britain and 400 Northern Ireland) are stopped and tested for illicit diesel use. The sample is stratified by vehicle type and region to ensure a representative sample of all UK vehicles. Strike rates are measured separately for GB and NI. Survey data from 2017 are used for the tax years 2016 to 2017 through 2018 to 2019. Survey data from 2020 are used for the tax years 2019 to 2020 through 2021 to 2022. Survey data from 2023 are used for the tax years 2022 to 2023 through 2024 to 2025. Months in which the survey is performed vary, spanning April to June 2017, January to March 2020 and September to November 2023.
Consumption statistics
Consumption statistics for fuels used in road transport at regional and local levels are sourced from DESNZ covering 2005 to 2023. This is used to determine the split of consumption volumes between GB and NI. We derive our figure from the data for diesel buses, cars, HGVs and LGVs and carry forward the 2023 figure as our estimate.
Compliance yield
Restoration fees form our compliance yield figures that are later used to adjust the model and obtain the net tax gap.
Restoration fees cover the revenue collected from penalties for misusing rebated fuel plus an amount of duty calculated from the size of the vehicle fuel tank.
Fuel retail prices
Fuel retail prices are sourced from published data from the DESNZ. These include monthly and annual prices for road fuels and fuels used for home heating, as well as an index of crude oil prices, and are used to estimate the VAT £ rate.
Model adjustments
We adjust our final gross figure to account for revenue recovered through compliance activity. We use restoration fees for this adjustment, which are payments made when misuse of rebated fuel is identified.
We refer to this adjustment as compliance yield.
The net tax gap is then calculated by subtracting compliance yield from the gross tax gap.
Timing
The model uses data from a random roadside survey, carried out every three years over a three-month period. The strike rate obtained from the survey is therefore carried forward and applied to intervening years where no survey data is available.
This means that changes in misuse may not be fully captured during intervening years, in addition to seasonal variations in misuse over the course of a single year.
Confidence intervals
The upper and lower estimates of the tax gap correspond to confidence intervals, which indicate the range within which we expect the true value of the illicit market to lie. These intervals arise from the roadside survey data due to random sampling error in calculating the strike rate.
Data issues and limitations
The model relies on the roadside survey data, which captures only a sample of vehicles over a limited time period and may not fully reflect all patterns of fuel misuse across the population. Misuse beyond roadways, such as in machinery, is not captured by roadside testing.
Some types of non-compliance are not included in the model because they cannot be directly measured. This includes fuel laundering, smuggling, and duty-free shopping.
Additionally, the model depends on HMRC clearance data and road fuel consumption statistics published by DESNZ. DESNZ consumption statistics are revised as more complete information becomes available, and some inputs are based on statistical estimates rather than direct measurement.
Changes to this data feed directly into the estimates of legitimate consumption. This in turn changes the estimated level of illicit consumption and the resulting calculation of revenue loss.
Sources of error
The main sources of error in this model are:
-
random sampling error in the roadside survey, which affects the estimated strike rate and therefore the calculated level of illicit diesel use
-
the use of strike rates from roadside surveys conducted at a single point in time (2017, 2020 and 2023), which are carried forward and applied to multiple tax years
-
exclusion of specific types of non-compliance that are not directly measured, including fuel laundering, smuggling, and fuel use not captured by roadside testing, such as machinery
Uncertainty rating
The uncertainty rating for the hydrocarbon oils duty gap estimate is ‘medium’. Some uncertainty arises from not including duty-free shopping and other forms of non-compliance beyond misuse of rebated fuel in road vehicles in our scope. Uncertainty arises in the roadside surveys, due to random sampling error and measured strike rates being carried forward until the next survey. The methodology also relies on the assumption that the hydrocarbon oils duty gap is equal in absolute value to the diesel tax gap.
Other excise duties
The other excise duties gap includes:
-
betting and gaming duties
-
cider and perry duties
-
spirits-based ready-to-drink beverage duties
-
wine duties
Overview
The gap in other excise duties is estimated using an illustrative approach. We use the excise duties for which we have a direct estimate (alcohol, tobacco and oils) as a proxy to estimate how much revenue might be lost. Each year, we calculate a weighted average percentage tax gap for these taxes and then apply that average to the receipts for ‘other excise duties’ to give an approximate estimate of the size of the losses.
The average percentage revenue losses should not be considered estimates of the true percentage losses across betting and gaming, cider and perry, spirits-based ready-to-drink beverages and wine duties, as these are unknown. Many of these taxes are very different from one another in nature and are therefore subject to different rules. The true other excise duties gaps are therefore likely to vary across the duties.
Step-by-step calculation
-
Take the total receipts for betting and gaming, cider and perry, spirits-based ready-to-drink beverages and wine duties (as published in HMRC tax receipts bulletin).
-
Calculate a weighted average percentage tax gap from established excise duty estimates, namely alcohol, tobacco and oils.
-
Apply the weighted average percentage tax gap to these receipts to calculate the tax gap estimate for other excise duties.
Uncertainty rating
The uncertainty rating for the other excise duties gap is ‘very high’. This is because the model is highly illustrative and the true other excise duties gaps are likely to be markedly different.