Malpractice in GCSE, AS and A level: summer 2022 exam series
Updated 19 November 2024
Applies to England

© Crown copyright 2024
This publication is licensed under the terms of the Open Government Licence v3.0 except where otherwise stated. To view this licence, visit nationalarchives.gov.uk/doc/open-government-licence/version/3 or write to the Information Policy Team, The National Archives, Kew, London TW9 4DU, or email: psi@nationalarchives.gov.uk.
Where we have identified any third party copyright information you will need to obtain permission from the copyright holders concerned.
This publication is available at https://www.gov.uk/government/statistics/malpractice-in-gcse-as-and-a-level-summer-2022-exam-series/malpractice-in-gcse-as-and-a-level-summer-2022-exam-series
1. Introduction
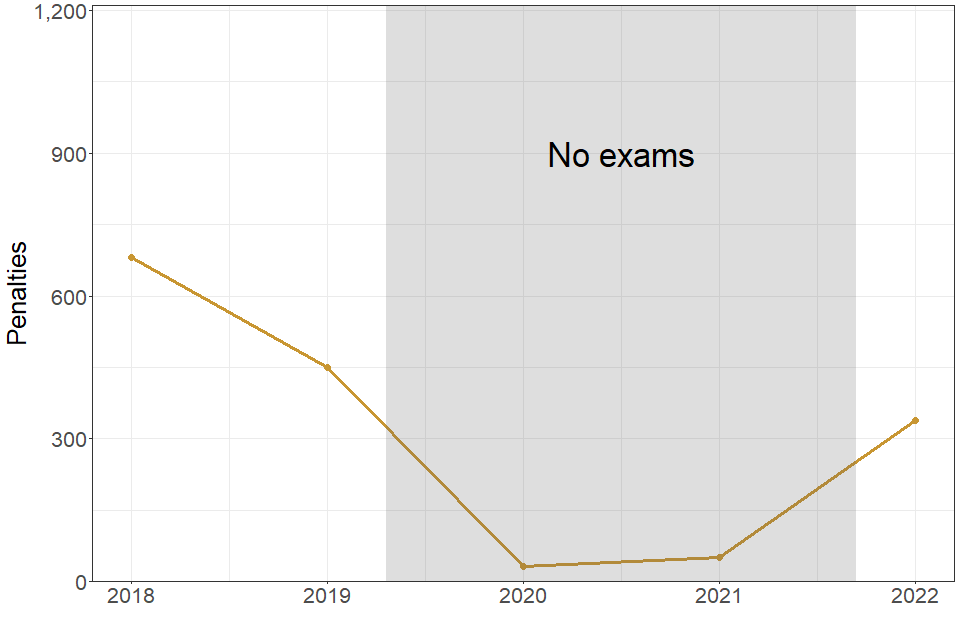
This release presents figures on penalties issued by exam boards to students, schools or colleges, and school or college staff for malpractice in GCSE, AS and A level qualifications for the summer 2022 exam series in England. As GCSE, AS and A level exams were cancelled in 2020 and 2021, the figures are compared to those from 2019, which was the most recent year in which exams went ahead.
The exceptional assessment arrangements put in place in 2020 and 2021 resulted in very low numbers of penalties issued in those 2 years. The different methods of assessment used in 2020 and 2021 also meant that malpractice cases may not be comparable to years when exams are sat. For this reason, although we report the number of penalties in 2020 and 2021, no further breakdowns by types of penalty or offence have been presented for these years. This information is available in the data tables accompanying this report.
Further information, including definitions and examples of the different categories of malpractice presented within this publication, is available in the Suspected Malpractice Policies and Procedures document published by the Joint Council for Qualifications.
2. Main trends
The main trends for malpractice in GCSE, AS and A level qualifications for the summer 2022 exam series were:
-
The number of penalties issued to students increased since the last time exams took place: 4,335 penalties were issued to students in 2022, up from 3,040 in 2019, and representing 0.03% of entries.
-
Mobile phone and other communication device offences accounted for 43% of all student penalties: There were 1,845 penalties for this type of offence in 2022, compared with 1,385 in 2019.
-
The number of penalties issued to school or college staff decreased since the last time exams took place: 340 penalties were issued to staff in 2022, down from 450 in 2019. This involves a very small proportion of the total number of staff in England (nearly 360,000).
-
The number of penalties issued to schools or colleges decreased since the last time exams took place: 60 penalties were issued to schools and colleges in 2022, down from 135 in 2019, and involving 0.9% of centres.
3. Student malpractice
Exam boards may impose sanctions and penalties on students found to have committed malpractice. The penalties for student malpractice vary depending on the type of offence. An individual student can be penalised more than once and by more than one exam board if they commit malpractice offences when sitting more than one assessment. A student may also receive one penalty for multiple offences.
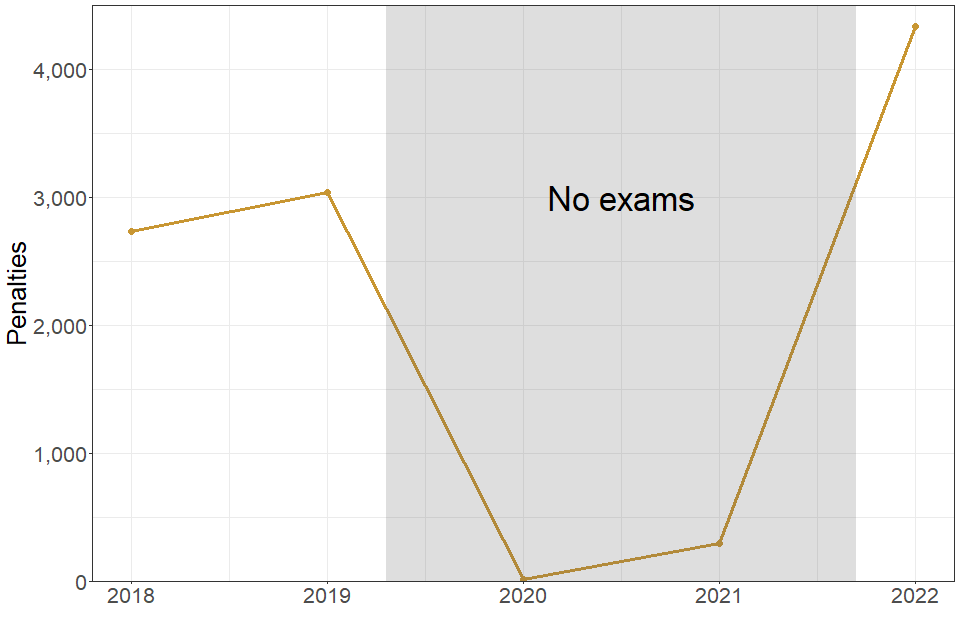
| 2018 | 2019 | 2020 | 2021 | 2022 | |
|---|---|---|---|---|---|
| Number of penalties issued to students | 2735 | 3040 | 20 | 300 | 4335 |
4,335 penalties were issued to students in 2022, up from 3,040 in 2019.
Penalties were issued to 3985 individual students in 2022, compared to 2805 individual students in 2019.
3.1 Types of student malpractice
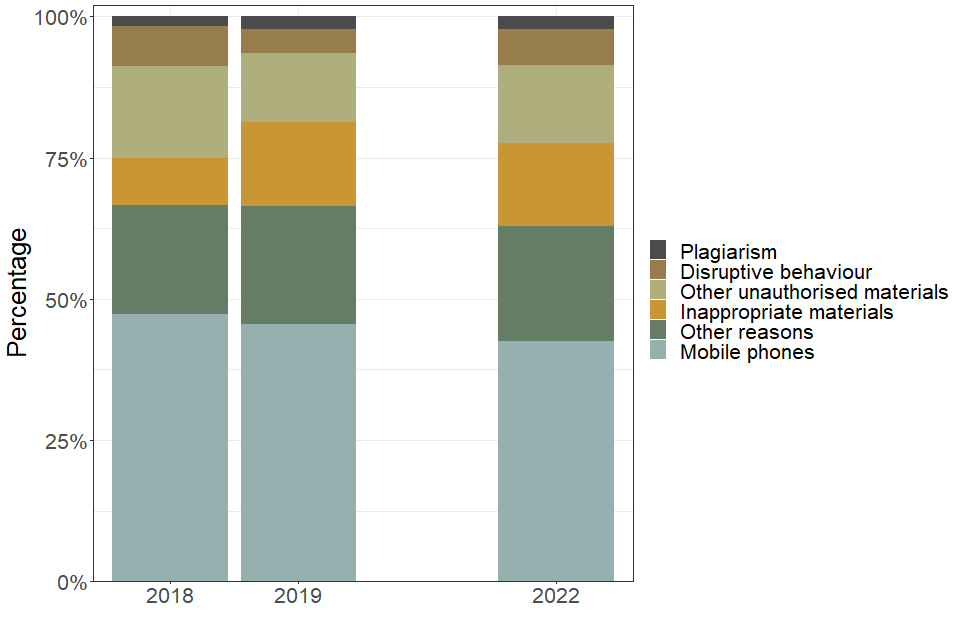
| Type of student malpractice | 2018 | 2019 | 2022 |
|---|---|---|---|
| Disruptive behaviour (percent) | 7.1 | 4.3 | 6.4 |
| Inappropriate materials (percent) | 8.3 | 14.8 | 14.6 |
| Mobile phones (percent) | 47.3 | 45.6 | 42.6 |
| Other reasons (percent) | 19.2 | 20.9 | 20.3 |
| Other unauthorised materials (percent) | 16.3 | 12.2 | 13.9 |
| Plagiarism (percent) | 1.8 | 2.3 | 2.2 |
Note: The ‘mobile phones’ category also includes other communication devices. ‘Inappropriate materials’ refers to the inclusion of inappropriate, offensive or obscene materials in scripts, coursework or portfolios. The ‘Other unauthorised materials’ category includes watches (not smartwatches, which are included with mobile phones) which were prohibited from being brought into the examination room or assessment situation from September 2021.
The most common type of malpractice reported in 2022 was the introduction of a mobile phone or other communications device into the examination room, the same as in 2019. This category accounted for 43% of all student penalties (1,845 penalties in 2022, compared with 1,385 in 2019).
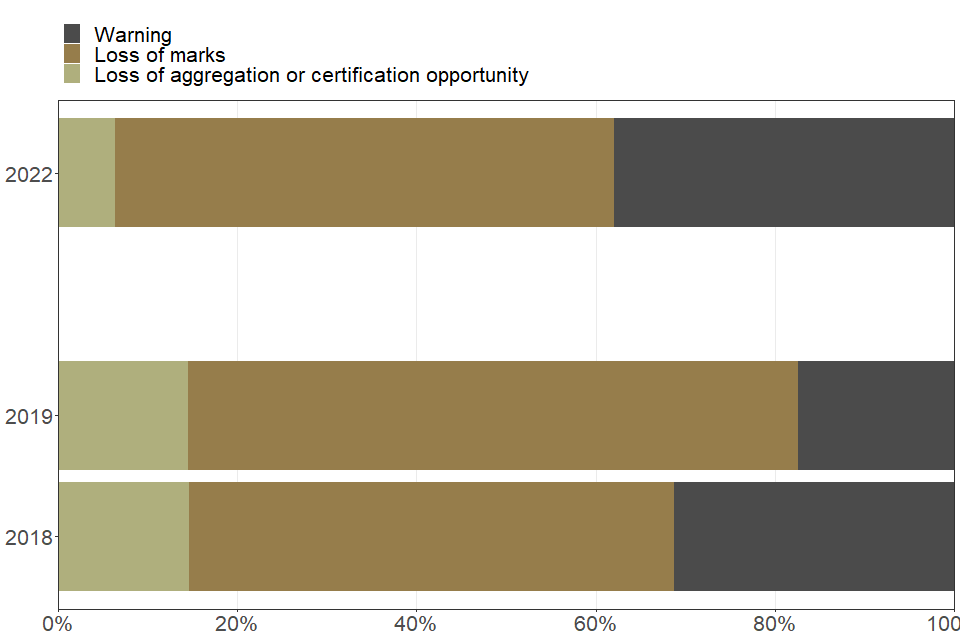
3.2 Types of penalty issued to students
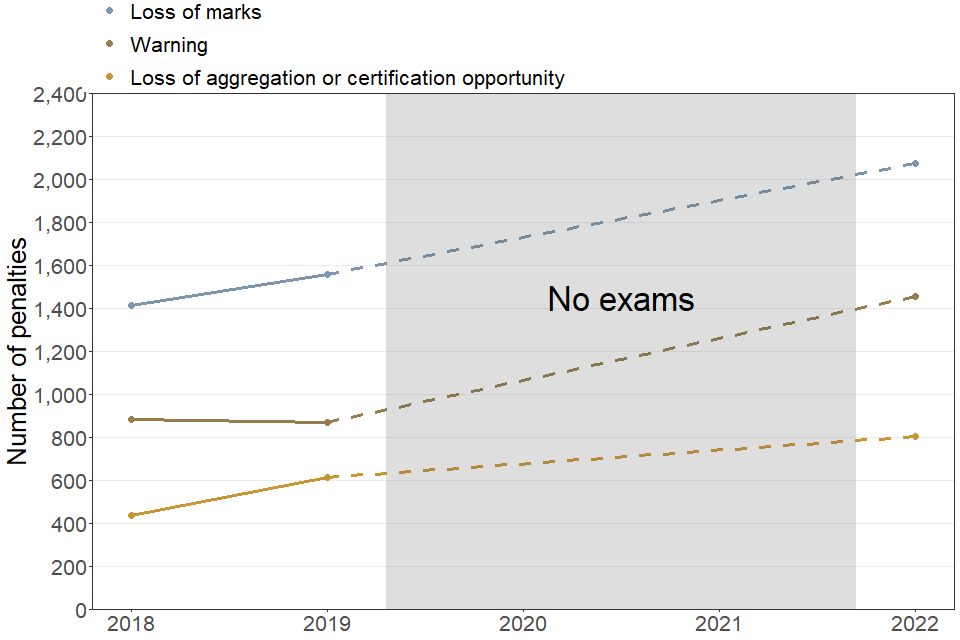
| Penalty type | 2018 | 2019 | 2022 |
|---|---|---|---|
| Loss of aggregation or certification opportunity | 435 | 610 | 805 |
| Loss of marks | 1415 | 1560 | 2075 |
| Warning | 885 | 870 | 1455 |
| Total | 2735 | 3040 | 4335 |
The most common type of penalty issued in 2022 was a loss of marks, with the number of this type of penalty increasing to 2075 from 1560 in 2019.
3.3 Number of penalties issued per student
Individual students can receive multiple penalties for multiple offences. In 2022, the majority of penalised students (93%) received only one penalty, similar to 2019 (94%). There were a small number of penalised students who committed more than one offence and received a penalty for each of these offences.
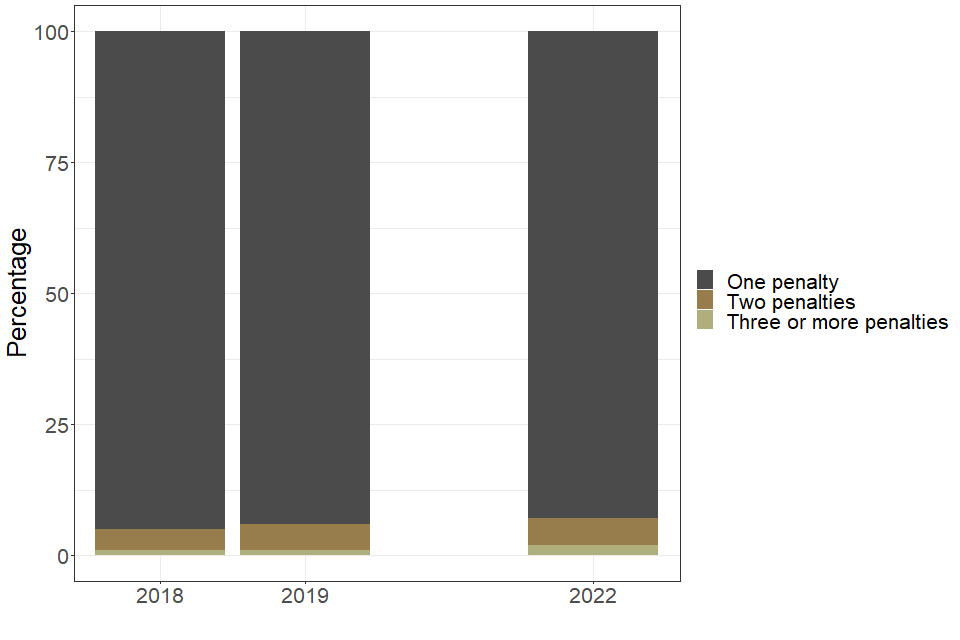
| Number of penalties issued per student | 2018 | 2019 | 2022 |
|---|---|---|---|
| One penalty (percentage of students) | 95 | 94 | 93 |
| Two penalties (percentage of students) | 4 | 5 | 5 |
| Three or more penalties (percentage of students) | 1 | 1 | 2 |
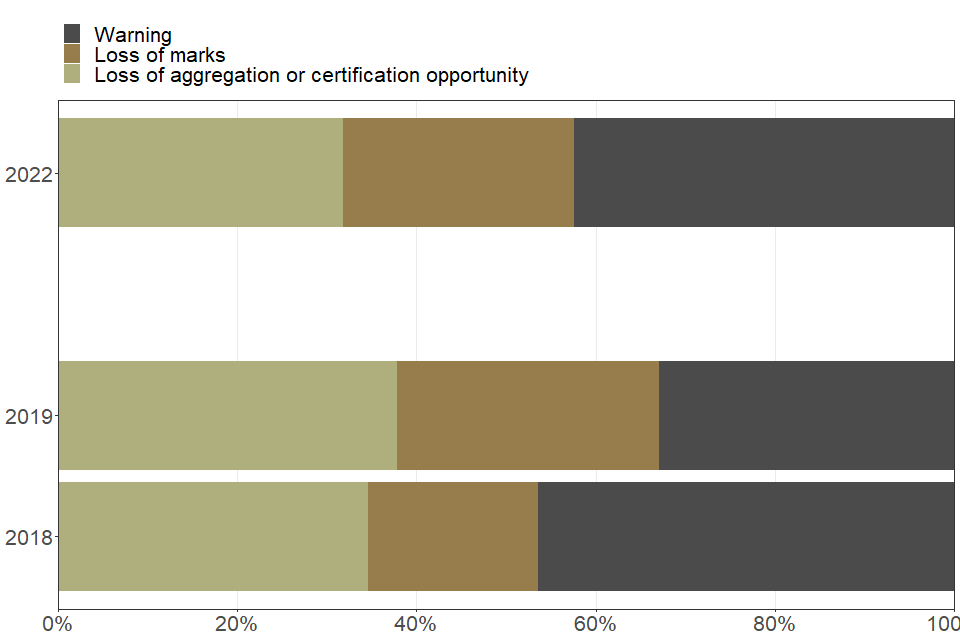
3.4 Types of penalty issued to students, by type of malpractice
Disruptive behaviour
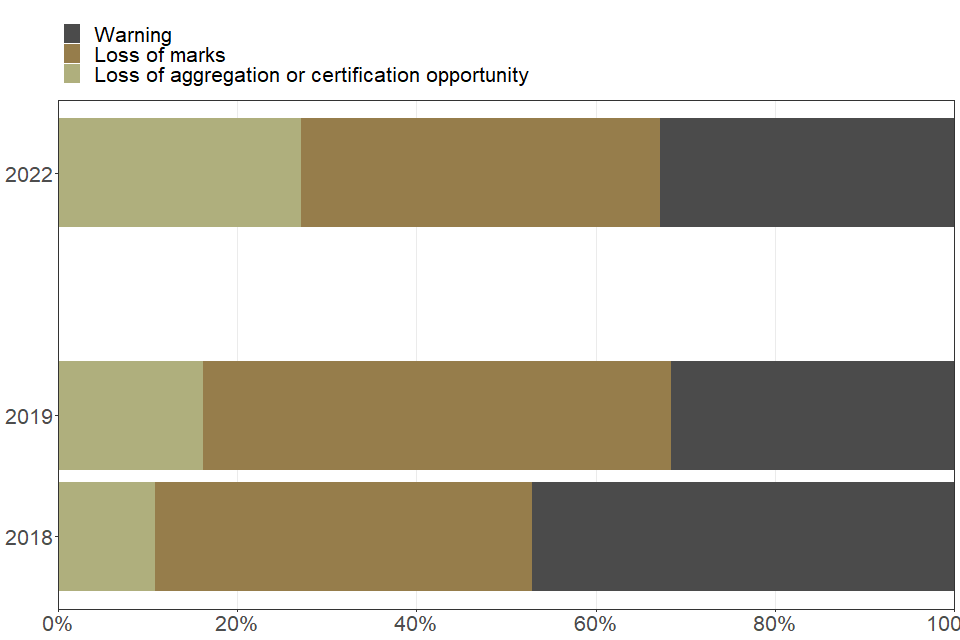
| Type of penalty issued to students for disruptive behaviour | 2018 | 2019 | 2022 |
|---|---|---|---|
| Loss of aggregation or certification opportunity (percent) | 10.9 | 16.2 | 27.1 |
| Loss of marks (percent) | 42.0 | 52.3 | 40.1 |
| Warning (percent) | 47.2 | 31.5 | 32.9 |
Inappropriate materials
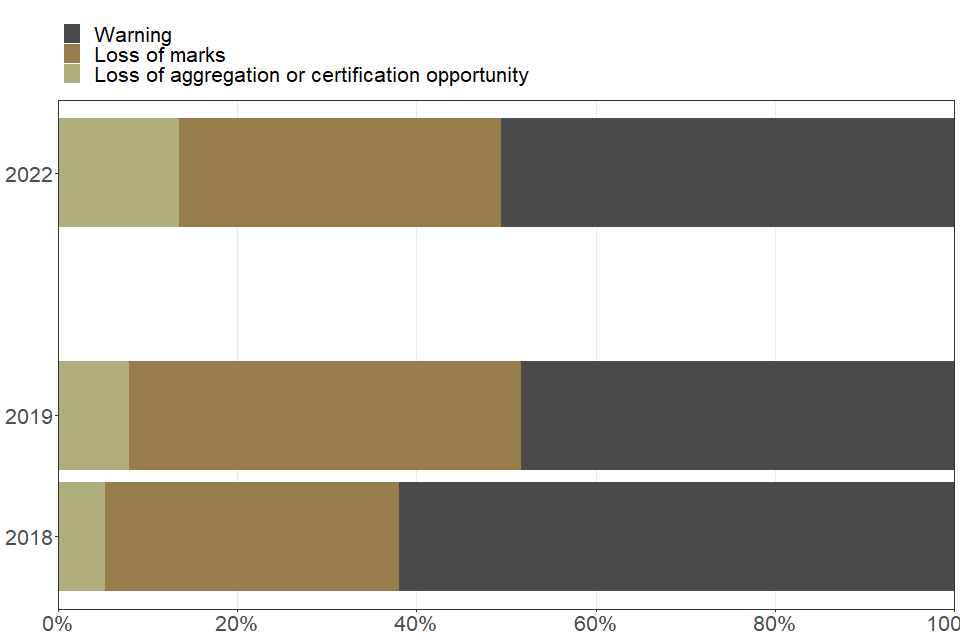
| Type of penalty issued to students for inappropriate behaviour | 2018 | 2019 | 2022 |
|---|---|---|---|
| Loss of aggregation or certification opportunity (percent) | 5.3 | 8.0 | 13.5 |
| Loss of marks (percent) | 32.7 | 43.7 | 35.9 |
| Warning (percent) | 61.9 | 48.3 | 50.6 |
Mobile phones
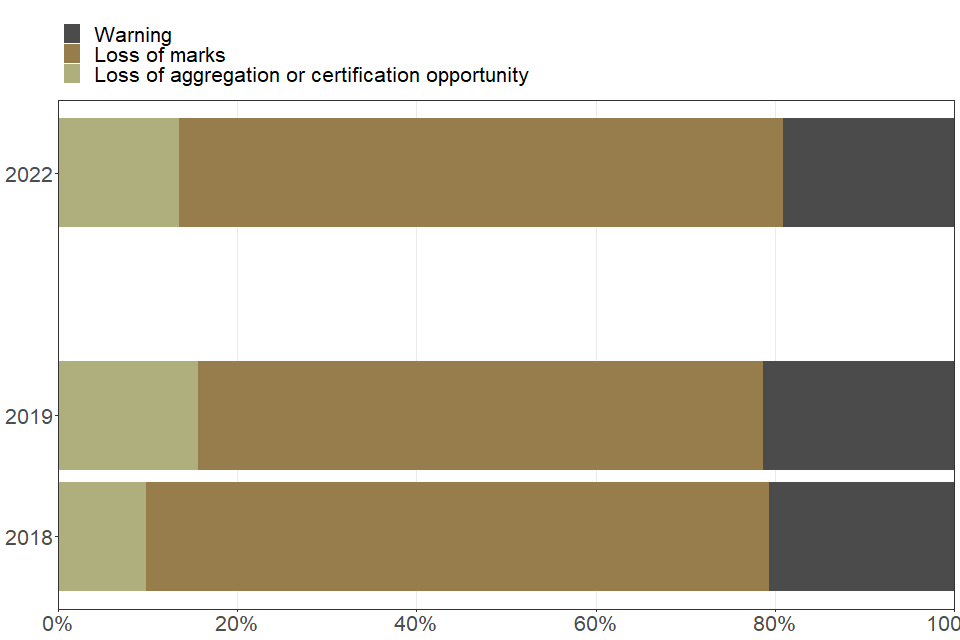
| Type of penalty issued to students for mobile phones | 2018 | 2019 | 2022 |
|---|---|---|---|
| Loss of aggregation or certification opportunity (percent) | 9.9 | 15.6 | 13.5 |
| Loss of marks (percent) | 69.5 | 63.0 | 67.4 |
| Warning (percent) | 20.6 | 21.4 | 19.1 |
Other unauthorised materials
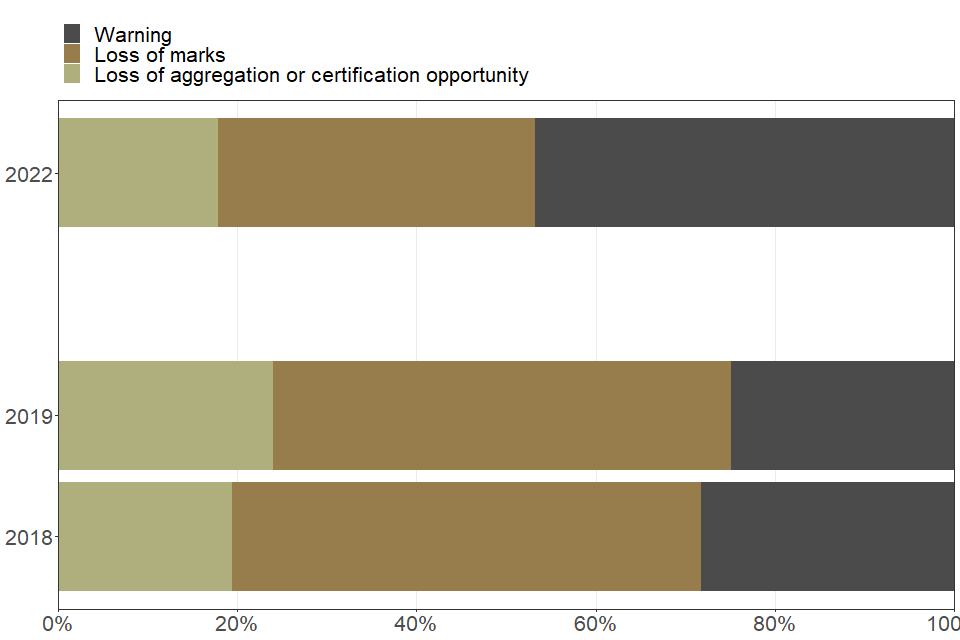
| Type of penalty issued to students for other unauthorised materials | 2018 | 2019 | 2022 |
|---|---|---|---|
| Loss of aggregation or certification opportunity (percent) | 19.5 | 24.1 | 17.9 |
| Loss of marks (percent) | 52.3 | 51.1 | 35.3 |
| Warning (percent) | 28.2 | 24.9 | 46.8 |
Plagiarism
| Type of penalty issued to students for plagiarism | 2018 | 2019 | 2022 |
|---|---|---|---|
| Loss of aggregation or certification opportunity (percent) | 14.6 | 14.5 | 6.3 |
| Loss of marks (percent) | 54.2 | 68.1 | 55.8 |
| Warning (percent) | 31.2 | 17.4 | 37.9 |
Other reasons
| Type of penalty issued to students for other reasons | 2018 | 2019 | 2022 |
|---|---|---|---|
| Loss of aggregation or certification opportunity (percent) | 34.6 | 37.8 | 31.9 |
| Loss of marks (percent) | 19.0 | 29.3 | 25.7 |
| Warning (percent) | 46.4 | 32.9 | 42.4 |
Penalties for student malpractice varied depending on the type of offence. A loss of marks was the most common type of penalty for plagiarism and a warning was most common for other types of offence. Students found with mobile phones or other communication devices were more likely to lose marks than for any other type of penalty. The categories presented here are broad, and could cover a range of individual circumstances. The precise penalty applied depends on the circumstances of the specific case.
4. Staff malpractice
Exam boards may impose penalties for malpractice committed by an individual member of staff at a school or college, for example a teacher or an invigilator. More than one penalty can be imposed for a single offence.
| 2018 | 2019 | 2020 | 2021 | 2022 | |
|---|---|---|---|---|---|
| Number of penalties issued to staff | 680 | 450 | 35 | 50 | 340 |
340 penalties were issued to staff, down from 450 in 2019.
Penalties were issued to 265 members of centre staff from 215 centres (compared to 450 penalties issued to 400 members of staff at 305 centres in 2019). This involves a very small proportion of the total number of staff in England (nearly 360K full time equivalent teachers and support staff in state funded secondary schools).
4.1 Types of staff malpractice
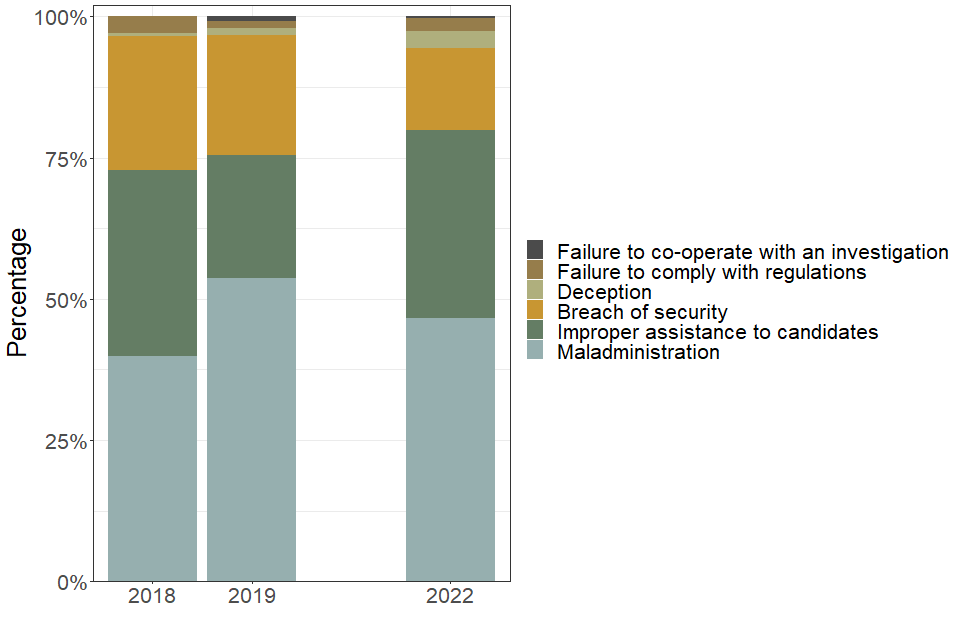
| Type of staff malpractice | 2018 | 2019 | 2022 |
|---|---|---|---|
| Breach of security (percent) | 23.6 | 21.2 | 14.5 |
| Deception (percent) | 0.6 | 1.3 | 2.9 |
| Failure to co-operate with an investigation (percent) | 0.0 | 0.9 | 0.3 |
| Failure to comply with regulations (percent) | 2.9 | 1.1 | 2.4 |
| Improper assistance to candidates (percent) | 32.9 | 21.8 | 33.3 |
| Maladministration (percent) | 39.9 | 53.7 | 46.6 |
Note: ‘Failure to comply with regulations’ refers to a failure to comply with regulations for access arrangements, reasonable adjustments, and/or special consideration.
The largest proportion of penalties were for maladministration (the failure to adhere to the regulations of examinations and non-examination assessments). Improper assistance to candidates was the second most common type of offence. Instances of deception remained low in 2022, similar to 2019, and there were fewer than 5 cases of failure to co-operate with an investigation recorded this year.
4.2 Types of penalty issued to staff
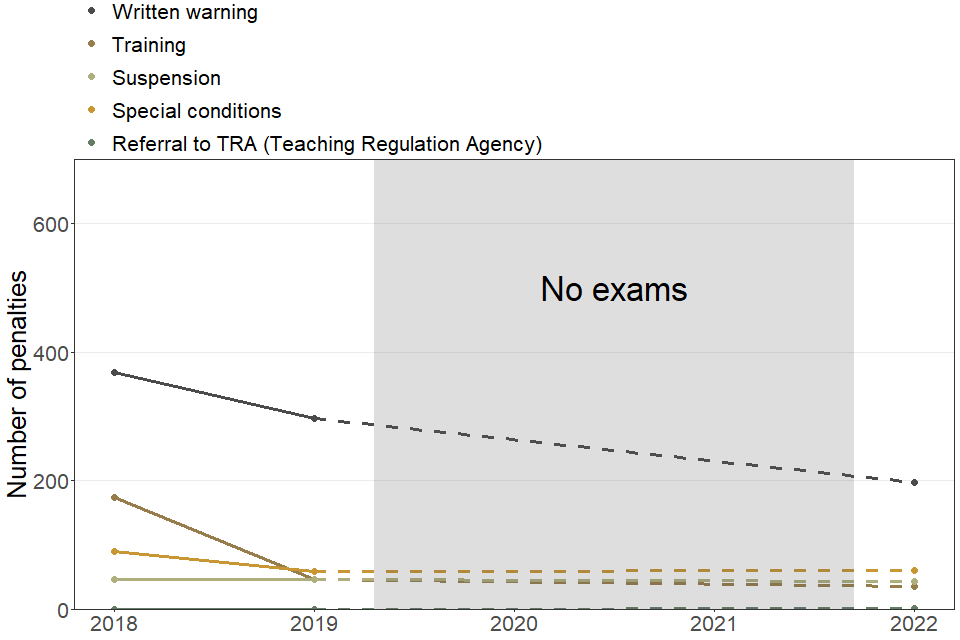
| Type of penalty issued to staff | 2018 | 2019 | 2022 |
|---|---|---|---|
| Referral to TRA (Teaching Regulation Agency) | 0 | 0 | Fewer than 5 |
| Special conditions | 90 | 60 | 60 |
| Suspension | 45 | 45 | 45 |
| Training | 175 | 45 | 35 |
| Written warning | 370 | 295 | 200 |
| Total | 680 | 450 | 340 |
The number of written warnings and requirements to undertake training have gone down this year, compared to 2019, while the numbers of other penalty types are broadly in line with 2019. Written warnings continue to be the most common penalty issued to staff. Cases of members of centre staff being required to undertake additional training have decreased, falling to 35 cases in 2022 compared to 45 in 2019.
4.3 Number of penalties issued per staff member
Individual members of centre staff can receive multiple penalties for multiple offences. In 2022, the majority of penalised centre staff (78%) received one penalty, down from 91% in 2019. Around 22% of penalised centre staff committed more than one offence and received a penalty for each of these offences.
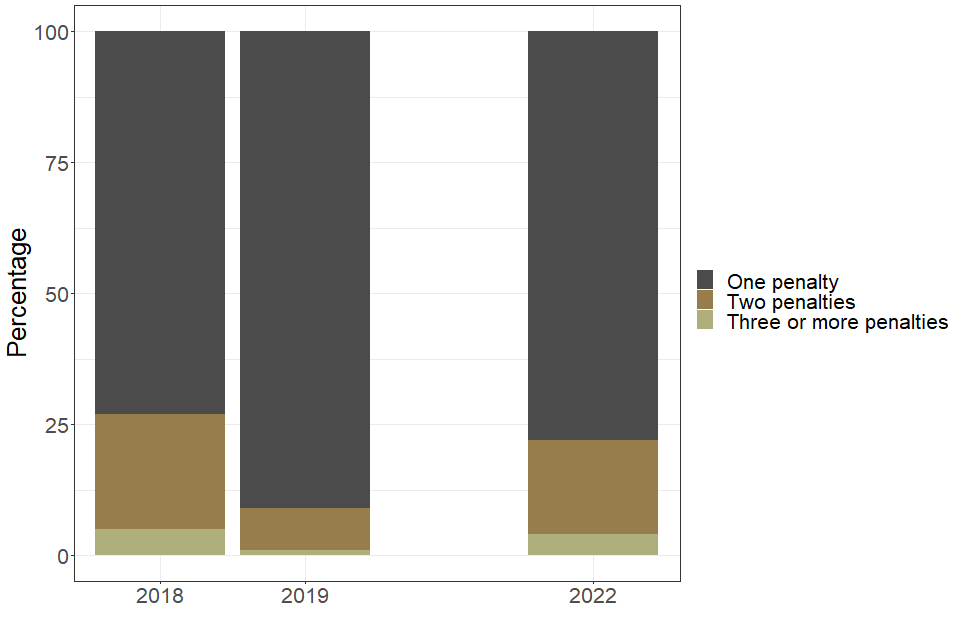
| Number of penalties issued per staff member | 2018 | 2019 | 2022 |
|---|---|---|---|
| One penalty (percentage of staff) | 73 | 91 | 78 |
| Two penalties (percentage of staff) | 22 | 8 | 18 |
| Three or more penalties (percentage of staff) | 5 | 1 | 4 |
5. School or college malpractice
Where there is evidence that malpractice is the result of a serious management failure, an exam board may apply sanctions against a whole department or a school or college.
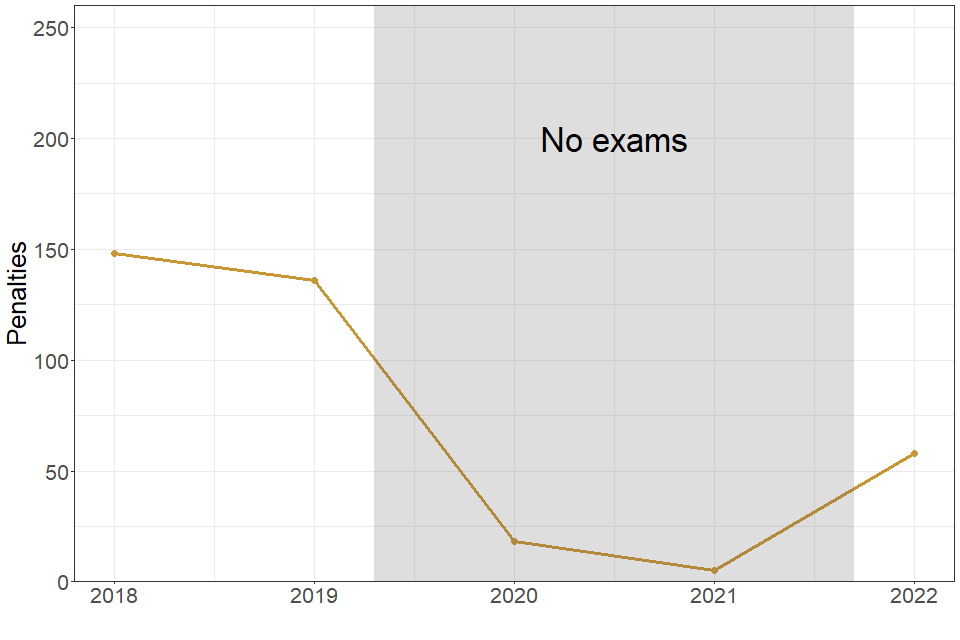
| 2018 | 2019 | 2020 | 2021 | 2022 | |
|---|---|---|---|---|---|
| Number of penalties issued to schools and colleges | 150 | 135 | 20 | 5 | 60 |
60 penalties were issued to 50 individual schools/colleges (out of nearly 6,000) in 2022, compared to 135 penalties issues to 115 individual schools/colleges in 2019.
5.1 Types of school or college malpractice
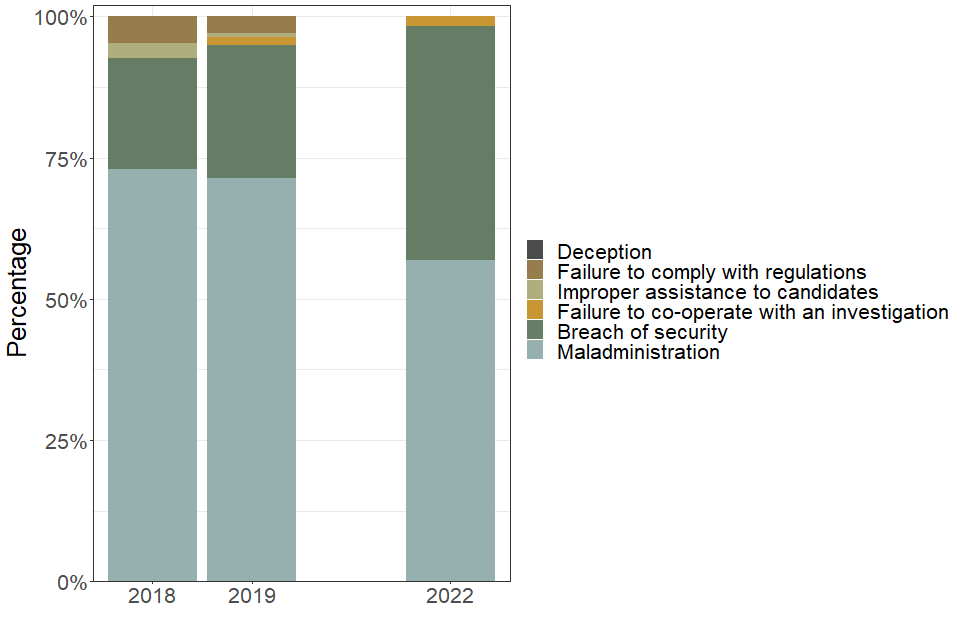
| Type of school or college malpractice | 2018 | 2019 | 2022 |
|---|---|---|---|
| Breach of security (percent) | 19.6 | 23.5 | 41.4 |
| Deception (percent) | 0 | 0 | 0 |
| Failure to co-operate with an investigation (percent) | 0.0 | 1.5 | 1.7 |
| Failure to comply with regulations (percent) | 4.7 | 2.9 | 0.0 |
| Improper assistance to candidates (percent) | 2.7 | 0.7 | 0.0 |
| Maladministration (percent) | 73.0 | 71.3 | 56.9 |
The largest proportion of penalties in 2022 were for maladministration (57%), followed by breach of security (41%).
5.2 Types of penalty issued to schools or colleges
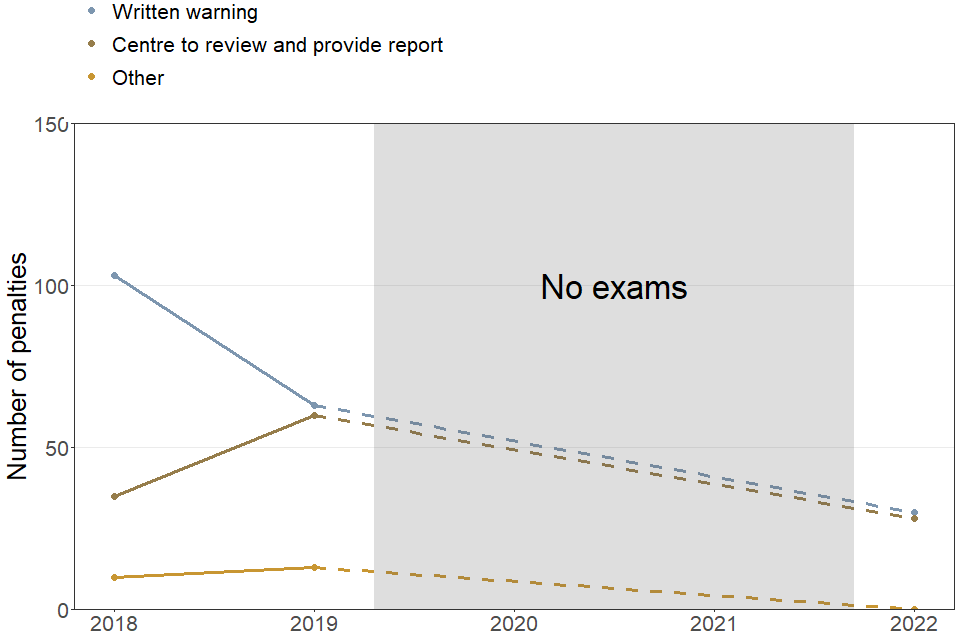
| Type of penalty issued to school or college | 2018 | 2019 | 2022 |
|---|---|---|---|
| Centre to review and provide report | 35 | 60 | 30 |
| Other | 10 | 15 | 0 |
| Written warning | 105 | 65 | 30 |
| Total | 150 | 135 | 60 |
Note: The “other” category includes additional monitoring or inspection, training, withdrawal of centre recognition, restrictions on examination and assessment materials, and withdrawal of approval for a specific qualification.
Penalties issued to centres have gone down this year in all categories, compared to 2019.
5.3 Number of penalties issued per school or college
Schools and colleges can receive multiple penalties for multiple offences. In 2022, the majority of penalised centres (92%) received one penalty, up from 84% in 2019. Around 8% of penalised centres committed more than one offence and received a penalty for each of these offences.
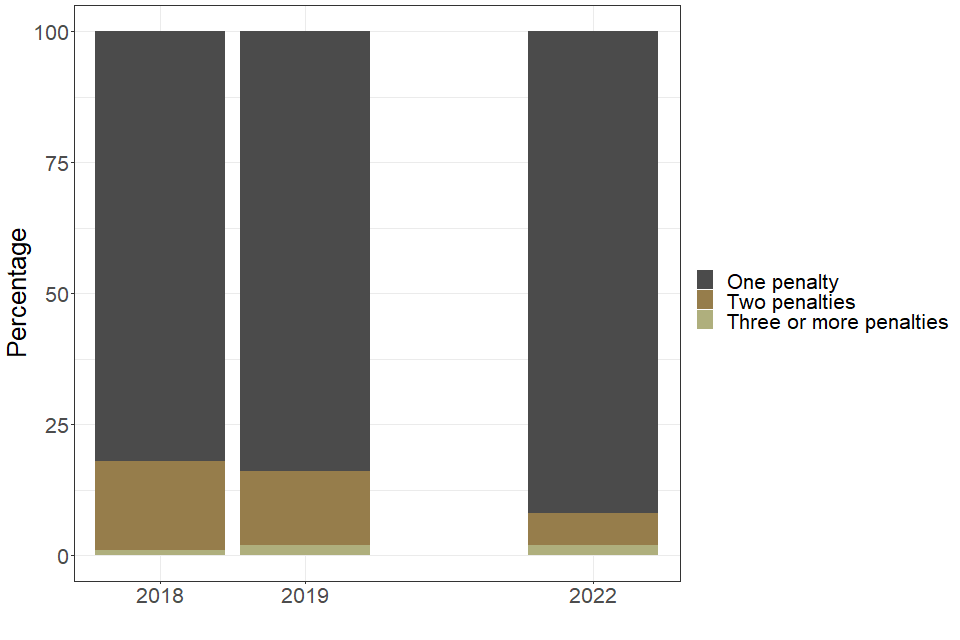
| Number of penalties issued per school or college | 2018 | 2019 | 2022 |
|---|---|---|---|
| One penalty (percentage of schools and colleges) | 82 | 84 | 92 |
| Two penalties (percentage of schools and colleges) | 17 | 14 | 6 |
| Three or more penalties (percentage of schools and colleges) | 1 | 2 | 2 |
6. Contextual information
In this statistical release, Ofqual presents data on malpractice in GCSE, AS, and A level exams during the summer 2022 exam series in England. The data may not reflect the full extent of malpractice because these cases relate only to instances of reported
malpractice where a penalty has been applied.
Exams were cancelled in summer 2020 and in summer 2021 following the closure of schools and colleges to most students, as part of the response to the coronavirus (COVID-19) pandemic, and this will have affected patterns of malpractice.
A breach of the exam boards’ regulations that might undermine the integrity of an assessment may constitute malpractice. It includes bringing in to the exam room unauthorised material or mobile phones, and failures by school or college staff to comply with exam board instructions.
We require exam boards to have procedures in place to prevent, investigate and act in relation to malpractice by students, school or college staff or others involved in providing a qualification. The Joint Council for Qualifications (JCQ) publishes policies and guidance on malpractice that set out procedures for dealing with suspected malpractice as well as definitions for the categories of malpractice listed within this release.
In this release, all figures are rounded to the nearest 5 to ensure confidentiality of data. Further information on this release is available in the background information and data tables accompanying this report.
Please note that the figures for summer 2021 published in this release are different from those published in the last release. Some exam boards have recently submitted revised 2021 figures to capture the cases that were still in progress when the 2021 data was originally reported.
7. User feedback
We welcome your feedback on our publications. Should you have any comments on this statistical release and how to improve it to meet your needs please contact us at data.analytics@ofqual.gov.uk.
Head of profession: Nadir Zanini