Main findings: local authority inspection outcomes as at 31 March 2026
Published 6 August 2026
Applies to England

© Crown copyright 2026
This publication is licensed under the terms of the Open Government Licence v3.0 except where otherwise stated. To view this licence, visit nationalarchives.gov.uk/doc/open-government-licence/version/3 or write to the Information Policy Team, The National Archives, Kew, London TW9 4DU, or email: psi@nationalarchives.gov.uk.
Where we have identified any third party copyright information you will need to obtain permission from the copyright holders concerned.
This publication is available at https://www.gov.uk/government/statistics/local-authority-inspection-outcomes-as-at-31-march-2026/main-findings-local-authority-inspection-outcomes-as-at-31-march-2026
This is the main findings report for the local authority inspection outcomes as at 31 March 2026 release. The following are also available:
-
underlying data
-
methodology
-
pre-release access list
Summary
This release includes:
-
local authority children’s services most recent inspections and outcomes as at 31 March 2026 with a report published by 30 June 2026
-
outcomes for inspections from 1 April 2025 to 31 March 2026 with a report published by 30 June 2026
-
a comparison to historical inspection outcomes under the inspecting local authority children’s services (ILACS) framework
The overall quality of local authority children’s services in England has improved over the past few years. As at 31 March 2026, 73% of local authorities were judged to be good or outstanding at their most recent inspection, compared with 53% as at 31 March 2022.
Of the 146 local authorities that had been inspected more than once under the ILACS framework, 63 (43%) improved their overall effectiveness judgement compared with their previous ILACS inspection; 47 (32%) retained a good or outstanding judgement and 21 (14%) declined in overall effectiveness.
The quality of local authority children’s services varied substantially at a regional level. However, compared with the outcomes reported in our previous statistical release (as at 31 March 2025), the difference between regions has narrowed. The proportion of local authorities judged good or outstanding was highest in the London region (91%, previously 88%) and lowest in the North West (50%, previously 46%).
There was some variation in quality across the different practice judgement areas. Overall, 65% of local authorities were judged good or outstanding for ‘the experiences and progress of children in need of help and protection’, compared with 77% for ‘the experiences and progress of children in care’ and 72% for ‘the experiences and progress of care leavers’.
Introduction
Out of the nearly 12.2 million children living in England, just over 402,000 (3%) are in the social care system at any one time. Nearly 81,800 (20%) of these children are in care.
Across England, 153 local authorities are responsible for ensuring and overseeing the effective delivery of social care services for children in need of help and protection, children in care, and care leavers. We inspect these local authorities under the ILACS framework.
Quality of local authority children’s services as at 31 March 2026
Overall effectiveness
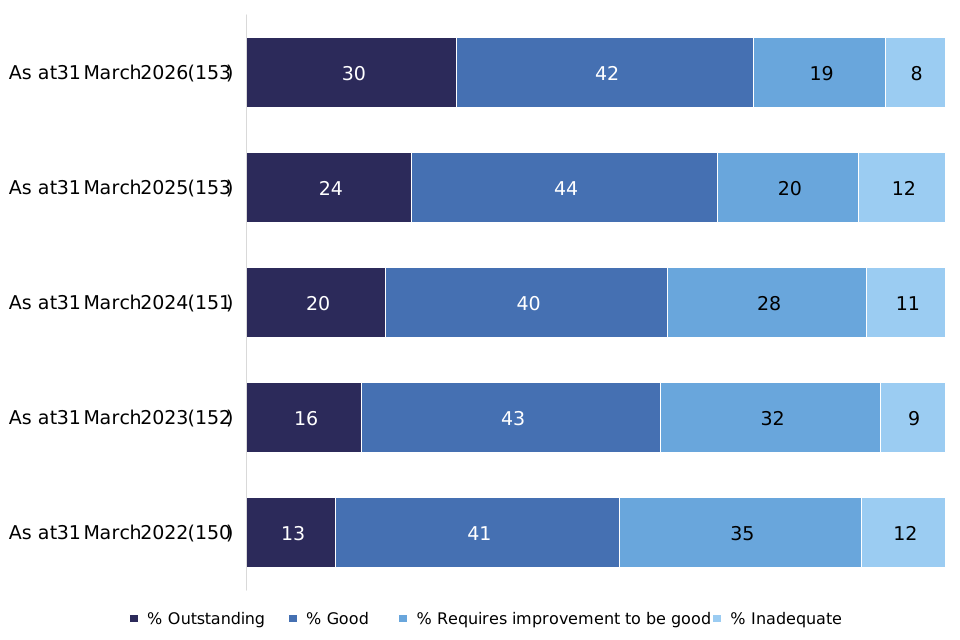
As at 31 March 2026, the 153 local authorities had the following overall effectiveness judgements at their most recent inspection:
-
46 (30%) outstanding
-
65 (42%) good
-
29 (19%) requires improvement to be good
-
13 (8%) inadequate
Compared with the picture as at 31 March 2025, there have been some changes for each graded judgement, as seen in Figure 1. The proportion of local authorities judged:
-
outstanding increased by almost 7 percentage points
-
good decreased by just over 1 percentage point
-
requires improvement to be good decreased by just over 1 percentage point
-
inadequate decreased by almost 4 percentage points
The overall quality of local authority children’s services in England has improved over the past few years. As at 31 March 2026, 73% of local authorities were judged good or outstanding at their most recent inspection, compared with 53% as at 31 March 2022. For the first time, more local authorities were judged outstanding (46) than were judged requires improvement to be good or inadequate (42).
Figure 1: Local authorities’ overall effectiveness at their most recent inspection
1. Numbers in brackets represent the number of local authorities with an overall effectiveness outcome as at 31 March 2026, 2025, 2024, 2023 and 2022, respectively.
2. Due to rounding, percentages might not add up to 100.
View data in an accessible format.
Of the 153 local authorities in England, 146 had been inspected more than once under the ILACS framework as at 31 March 2026. Of these, compared with their previous ILACS inspection, as shown in Table 1:
-
63 (43%) improved – 10 of these improved by 2 judgements
-
47 (32%) retained a good or outstanding judgement
-
21 (14%) declined – 6 of these declined by 2 judgements
Table 1: Change in overall effectiveness for local authorities that had been inspected more than once under the ILACS framework as at 31 March 2026
| Previous overall effectiveness judgement | Number of local authorities that improved | Number of local authorities that retained their judgement | Number of local authorities that declined |
|---|---|---|---|
| Outstanding | - | 20 | 4 |
| Good | 24 | 27 | 11 |
| Requires improvement to be good | 25 | 14 | 6 |
| Inadequate | 14 | 1 | - |
Regional and local authority level
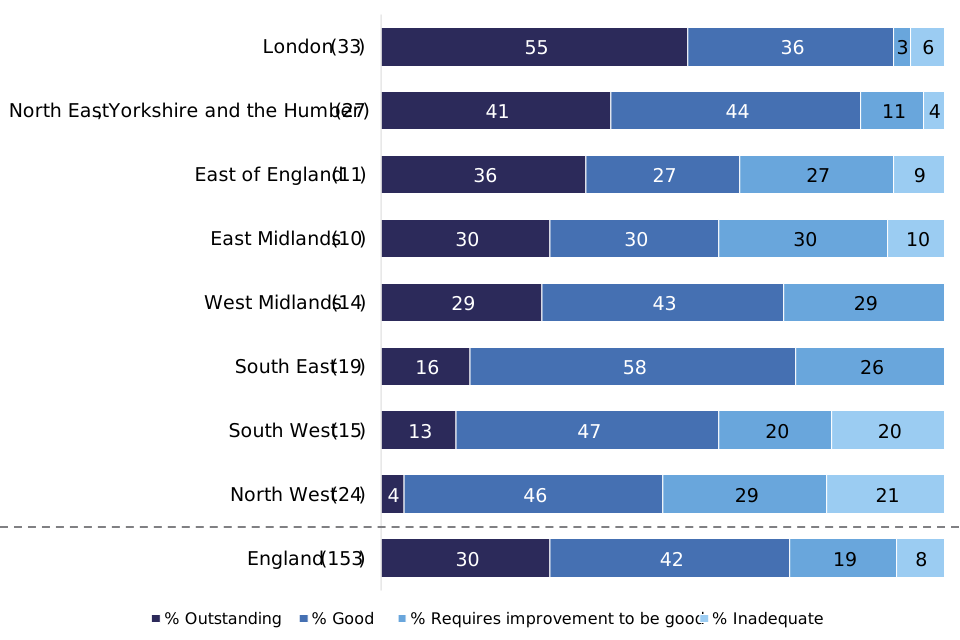
The overall effectiveness of local authority children’s services as at 31 March 2026 showed substantial variations at a regional level, as seen in Figure 2. However, proportions in this section should be treated with caution as they refer to low numbers.
In the London region, 18 local authorities (55%) were judged outstanding – considerably higher than the national figure of 30% and an increase of just over 12 percentage points since 31 March 2025. Conversely, in some regions, these proportions were much lower than the national figure:
-
in the South East, 3 local authorities (16%) were judged outstanding
-
in the South West, 2 local authorities (13%) were judged outstanding
-
in the North West, 1 local authority (4%) was judged outstanding
In the West Midlands and South East regions, no local authorities were judged inadequate. In contrast, the North West and South West regions had the highest proportions of local authorities judged inadequate, at 21% (5 local authorities) and 20% (3 local authorities), respectively.
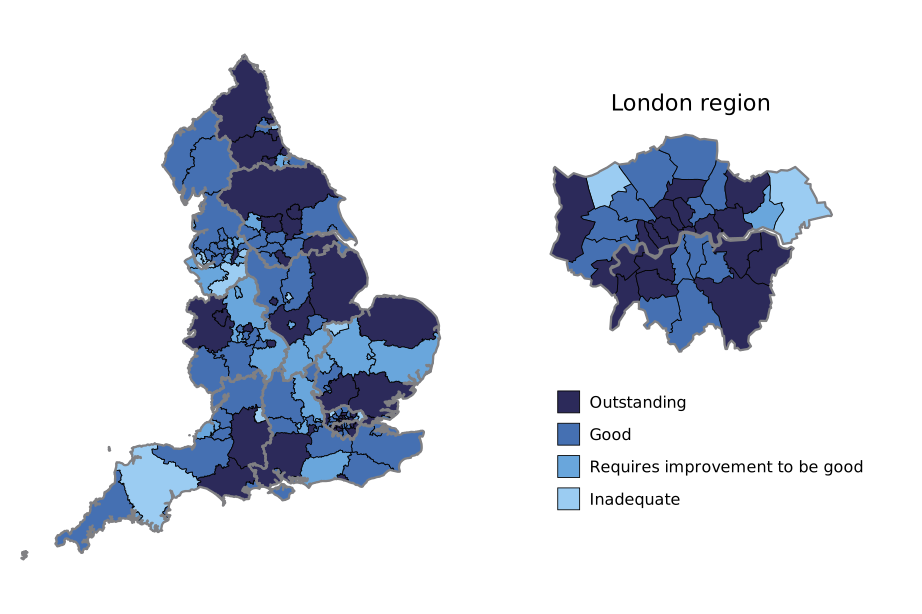
At a local authority level, as seen in Figure 3, those with an overall effectiveness judgement of good or outstanding tend to be geographically clustered together, whereas inadequate local authorities are more dispersed. An exception to this is the North West region, where some inadequate local authorities border each other.
Figure 2: Local authorities’ overall effectiveness at their most recent inspection, by region
1. Numbers in brackets represent the number of local authorities with a graded judgement.
2. Due to rounding, percentages might not add up to 100.
View data in an accessible format.
Figure 3: Map showing the overall effectiveness of local authorities as at 31 March 2026
1. This map of England and close-up of the London region uses a grey outline to show regional boundaries.
2. To magnify the image, use the zoom function on your browser.
3. A close-up of the London region is included due to the small size and density of the local authorities.
4. See the Inspections_as_at_31_March tab in the underlying data spreadsheet to view this data in an accessible format.
Inspection sub-judgements
During standard and short inspections, local authorities receive the following graded judgements in addition to their overall effectiveness judgement:
-
the impact of leaders on practice with children and families
-
the experiences and progress of children in need of help and protection
-
the experiences and progress of children in care
-
the experiences and progress of care leavers
The care leavers judgement was introduced in January 2023. The experiences of care leavers were previously evaluated as part of the judgement ‘the experiences and progress of children in care and care leavers’. This became a separate judgement following a consultation in summer 2022.
As at 31 March 2026, 144 of the 153 local authorities inspected had a graded judgement for care leavers. Of these 144, there are 66 local authorities (46%) that have a different judgement for care leavers compared with children in care.
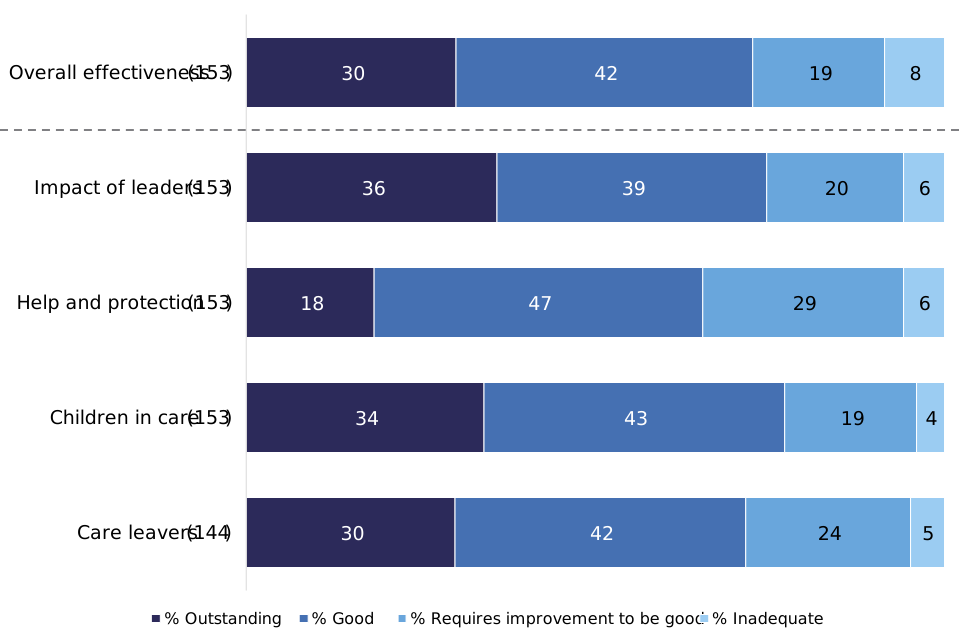
Figure 4 shows a breakdown of the outcomes for all local authorities at their most recent inspection as at 31 March 2026 for each sub-judgement area. There was some variation in the quality of local authority children’s services across the different areas. Less effective practice was generally seen for ‘the experiences and progress of children in need of help and protection’, with 100 local authorities (65%) judged good or outstanding. The strongest practice was seen for ‘the experiences and progress of children in care’, where 118 local authorities (77%) were judged good or outstanding. The sub-judgement with the highest proportion of outstanding judgements was ‘the impact of leaders on practice with children and families’, with just over a third of local authorities (36%) judged outstanding at their latest inspection.
There were 4 local authorities judged inadequate for one practice judgement which resulted in an overall effectiveness judgement of inadequate. Their other judgement areas were judged good or requires improvement to be good.
Figure 4: Inspection sub-judgement outcomes at local authorities’ most recent inspection
1. Numbers in brackets represent the number of local authorities with a graded judgement in that area.
2. Due to rounding, percentages might not add up to 100.
3. ILACS judgement area names have been abbreviated in this figure.
View data in an accessible format.
ILACS inspection activity between 1 April 2025 and 31 March 2026
Between 1 April 2025 and 31 March 2026, we visited 98 of the 153 local authorities, on 113 different occasions. The reports for these inspections and visits were all published by 30 June 2026. These visits included:
-
17 standard inspections
-
24 short inspections
-
46 focused visits
-
26 monitoring visits
ILACS standard and short inspections
While local authorities that were previously judged good or outstanding usually receive a short inspection, local authorities that were previously judged inadequate or requires improvement to be good receive a standard inspection. Both standard and short inspections result in graded judgements.
Between 1 April 2025 and 31 March 2026, we carried out 17 standard inspections and 24 short inspections. Due to potential risks that had been identified, 3 local authorities previously judged good received standard inspections. However, in 2 of those inspections we found that the local authority had improved to outstanding overall.
The overall effectiveness judgements for the 41 standard or short inspections carried out between 1 April 2025 and 31 March 2026 were:
-
16 local authorities (39%) outstanding
-
19 local authorities (46%) good
-
6 local authorities (15%) requires improvement to be good
-
0 local authorities inadequate
Of these 41 local authorities, 32 had previously been inspected under the ILACS framework once before and 9 had been inspected twice before. The overall effectiveness judgement improved for 24 local authorities (59%) and declined for 4 (10%). There were 12 local authorities (29%) that retained a judgement of good or outstanding.
Following a cycle of monitoring visits, we reinspected 6 local authorities that had been judged inadequate at their previous inspection. All improved, with 4 local authorities getting an overall effectiveness judgement of good and 2 getting a judgement of requires improvement to be good.
ILACS monitoring visits
We carry out monitoring visits after a local authority is judged inadequate. These visits do not result in a graded judgement. The first monitoring visit usually occurs around 6 months after we publish the short/standard inspection report. These first monitoring visits are not included in our annual figures, as we do not publish reports for these visits unless they are the second set of monitoring visits for a local authority. We will usually carry out between 4 and 6 monitoring visits before the next full inspection.
Between 1 April 2025 and 31 March 2026, we carried out a total of 26 monitoring visits across 17 local authorities that had been judged inadequate at their latest inspection.
ILACS focused visits
We carry out focused visits between standard or short inspections. These do not result in a graded judgement. A focused visit looks at one or more aspects of the service, themes or cohorts of children.
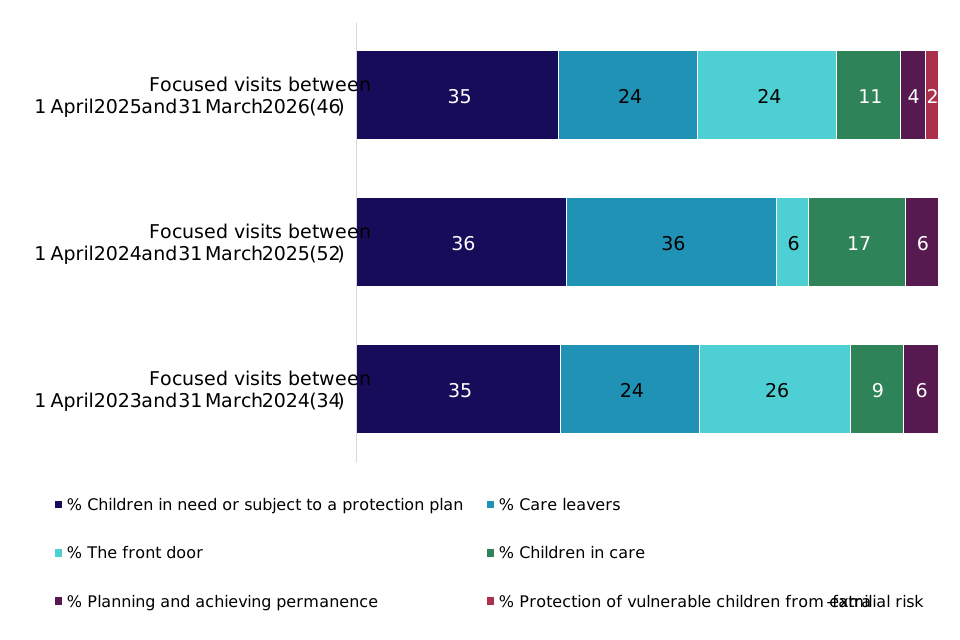
Details of visit themes from this year compared with last year are given in Figure 5. The most common focused visit theme from 1 April 2025 to 31 March 2026 was ‘children in need or subject to a protection plan’ (35%). Conversely, from 1 April 2024 to 31 March 2025, the 2 most common themes were ‘children in need or subject to a protection plan’ and ‘care leavers’ (both 36%).
Figure 5: ILACS focused visits by theme and reporting year
1. Numbers in brackets represent the number of focused visits carried out in the given time period.
2. Due to rounding, percentages might not add up to 100.
View data in an accessible format.
Further information
Contacts
If you are a member of the public and have any comments or feedback on this publication, contact Clare Atkinson (clare.atkinson@ofsted.gov.uk) or the social care inspection insight team (socialcareSAO@ofsted.gov.uk).
Acknowledgements
Thanks to the following for their contribution to this statistical release: Olivia Ford, Ben Clark-Betts, Jonathan Eastwood, Ella Routledge, Giada Maugeri, Reed Roberts, Talan George, Mundeep Gill, Jay Kerai, and Richmond Quaison.
Glossary
Definitions of terms are in the statistical glossary.
Annex: data tables for figures
This section contains the underlying data in an accessible table format for Figures 1, 2, 4, and 5.
Data for Figure 1: Local authorities’ overall effectiveness at their most recent inspection
| Period (number of local authorities) | % Outstanding | % Good | % Requires improvement to be good | % Inadequate |
|---|---|---|---|---|
| As at 31 March 2026 (153) | 30 | 42 | 19 | 8 |
| As at 31 March 2025 (153) | 24 | 44 | 20 | 12 |
| As at 31 March 2024 (151) | 20 | 40 | 28 | 11 |
| As at 31 March 2023 (152) | 16 | 43 | 32 | 9 |
| As at 31 March 2022 (150) | 13 | 41 | 35 | 12 |
See Figure 1.
Data for Figure 2: Local authorities’ overall effectiveness at their most recent inspection, by region
| Region (number of local authorities) | % Outstanding | % Good | % Requires improvement to be good | % Inadequate |
|---|---|---|---|---|
| London (33) | 55 | 36 | 3 | 6 |
| North East, Yorkshire and the Humber (27) | 41 | 44 | 11 | 4 |
| East of England (11) | 36 | 27 | 27 | 9 |
| East Midlands (10) | 30 | 30 | 30 | 10 |
| West Midlands (14) | 29 | 43 | 29 | 0 |
| South East (19) | 16 | 58 | 26 | 0 |
| South West (15) | 13 | 47 | 20 | 20 |
| North West (24) | 4 | 46 | 29 | 21 |
| England (153) | 30 | 42 | 19 | 8 |
See Figure 2.
Data for Figure 4: Inspection sub-judgement outcomes at local authorities’ most recent inspection
| Sub-judgements (number of local authorities) | % Outstanding | % Good | % Requires improvement to be good | % Inadequate |
|---|---|---|---|---|
| Overall effectiveness (153) | 30 | 42 | 19 | 8 |
| Impact of leaders (153) | 36 | 39 | 20 | 6 |
| Help and protection (153) | 18 | 47 | 29 | 6 |
| Children in care (153) | 34 | 43 | 19 | 4 |
| Care leavers (144) | 30 | 42 | 24 | 5 |
See Figure 4.
Data for Figure 5: ILACS focused visits by theme and reporting year
| Period (number of local authorities) | % Children in need or subject to a protection plan | % Care leavers | % The front door | % Children in care | % Planning and achieving permanence | % Protection of vulnerable children from extra-familial risk |
|---|---|---|---|---|---|---|
| 1 April 2025 and 31 March 2026 (46) | 35 | 24 | 24 | 11 | 4 | 2 |
| 1 April 2024 and 31 March 2025 (52) | 36 | 36 | 6 | 17 | 6 | - |
| 1 April 2023 and 31 March 2024 (34) | 35 | 24 | 26 | 9 | 6 | - |
See Figure 5.