Local Alcohol Profiles for England: short statistical commentary, July 2021
Published 6 July 2021
Applies to England

© Crown copyright 2021
This publication is licensed under the terms of the Open Government Licence v3.0 except where otherwise stated. To view this licence, visit nationalarchives.gov.uk/doc/open-government-licence/version/3 or write to the Information Policy Team, The National Archives, Kew, London TW9 4DU, or email: psi@nationalarchives.gov.uk.
Where we have identified any third party copyright information you will need to obtain permission from the copyright holders concerned.
This publication is available at https://www.gov.uk/government/statistics/local-alcohol-profiles-for-england-lape-july-2021-update/local-alcohol-profiles-for-england-short-statistical-commentary-july-2021
Updates
New data has been added to the Local Alcohol Profiles for England (LAPE) tool on the Fingertips platform. The following indicators have been updated and are available at local authority level as well as for England, the regions, and various inequality groups:
- percentage of adults who abstain from drinking alcohol
- percentage of adults binge drinking on heaviest drinking day
- percentage of adults drinking over 14 units of alcohol a week
- incidence rate of alcohol-related cancer
Main findings
The percentage of adults:
- who abstain from alcohol in England has increased from 15.5% in 2011 to 2014 to 16.2% in 2015 to 2018
- binge drinking on the heaviest drinking day in England has reduced from 16.4% in 2011 to 2014 to 15.4% in 2015 to 2018
- drinking over 14 units of alcohol a week in England has reduced from 25.3% in 2011 to 2014 to 22.8% in 2015 to 2018
A greater percentage of the population of the most deprived areas abstain from alcohol, while binge drinking and drinking over the recommended 14 units a week was more common in less deprived areas. This does not match indicators for alcohol-related harm, especially mortality and admissions, where the more deprived areas experience the greatest burden of harm.
For the period 2016 to 2018, there were an estimated 59,000 new alcohol-related cancer registrations – this equates to approximately 19,670 new cancer cases each year. The incidence rate of alcohol-related cancer increased gradually between 2004 to 2006 and 2011 to 2013. However, since 2012 to 2014 there have been minor reductions in the incidence rate. The incidence rate of alcohol-related cancer per 100,000 population between 2015 to 2017 and 2016 to 2018 has remained static for females and has slightly decreased for males.
Key definitions used in this release
These meanings are:
- abstain from drinking alcohol – in the Health Survey for England, abstainers are defined as those who respond:
“No” to the question “Do you drink alcohol nowadays?” and
“Never” to “Do you drink occasionally or never drink?” - binge drinking on heaviest drinking day – in the Health Survey for England, binge drinkers are defined as:
those who reported drinking more than 6 units of alcohol (women), or more than 8 units of alcohol (men) on their heaviest drinking day in the previous week - adults drinking over 14 units of alcohol a week – in the Health Survey for England those, drinking over the CMO recommended limits are defined as regular drinkers who reported that they usually drink more than 14 units of alcohol a week
-
alcohol-related cancer incidence – alcohol-attributable fractions are applied to cancer incidence by age and gender for the 6 cancer types, with a recognised link to alcohol consumption:
- lCD-10 codes C00-C14 – lips, oral cavity and pharynx
- ICD-10 code C15 – oesophagus
- ICD-10 code C18-C21 – colorectal
- ICD-10 code C22 – liver
- ICD-10 code C32 – larynx
- ICD-10 code C50 – breast
Summary of updated indicators
Adults who abstain from drinking alcohol
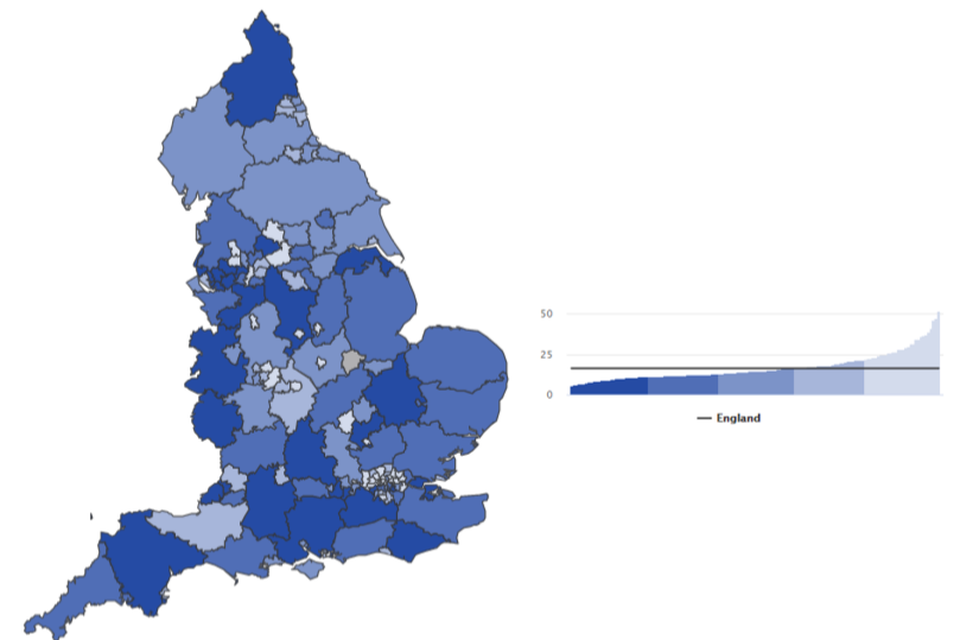
The percentage of adults who abstain from alcohol in England has increased from 15.5% in 2011 to 2014 to 16.2% in 2015 to 2018.
The percentage of adults who abstain from alcohol is highest in the most deprived decile (25.2%) compared with the least deprived decile (11.3%). For 2017 to 2019, Brent (51.8%) had the highest percentage of abstainers while Warrington (5.9%) had the lowest.
Figure 1: Percentage of adults who abstain from drinking alcohol, county and unitary authorities (UA), 2015 to 2018
Adults binge drinking on heaviest drinking day
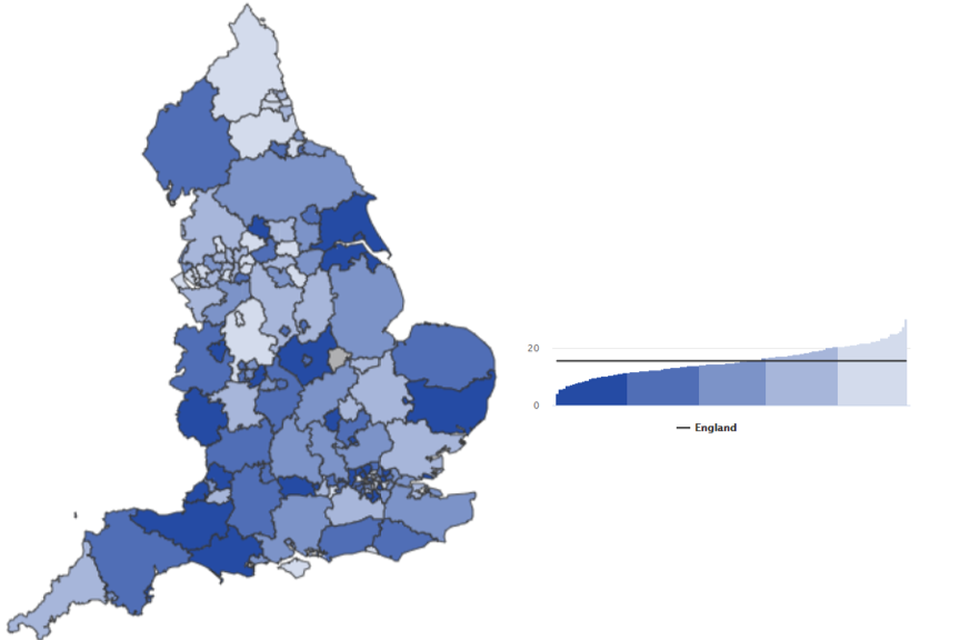
The percentage of adults binge drinking on heaviest drinking day in England has reduced from 16.4% in 2011 to 2014 to 15.4% in 2015 to 2018.
The percentage of adults binge drinking on heaviest drinking day was highest in the third-most deprived decile (18.5%) and lowest in the second-least deprived decile (13.9%). However, there was no clear pattern of inequality across deciles. This differs from indicators for alcohol-related harm, especially mortality and admissions, where the more deprived decile typically experiences the greatest burden of harm.
For 2015 to 2018 (excluding Kensington and Chelsea due to wide confidence intervals), Calderdale (27.4%) had the highest percentage of adults binge drinking on heaviest drinking day, while Brent (4.3%) had the lowest.
Figure 2: Percentage of adults binge drinking on heaviest drinking day, county and UA, 2015 to 2018
Adults drinking over 14 units of alcohol a week
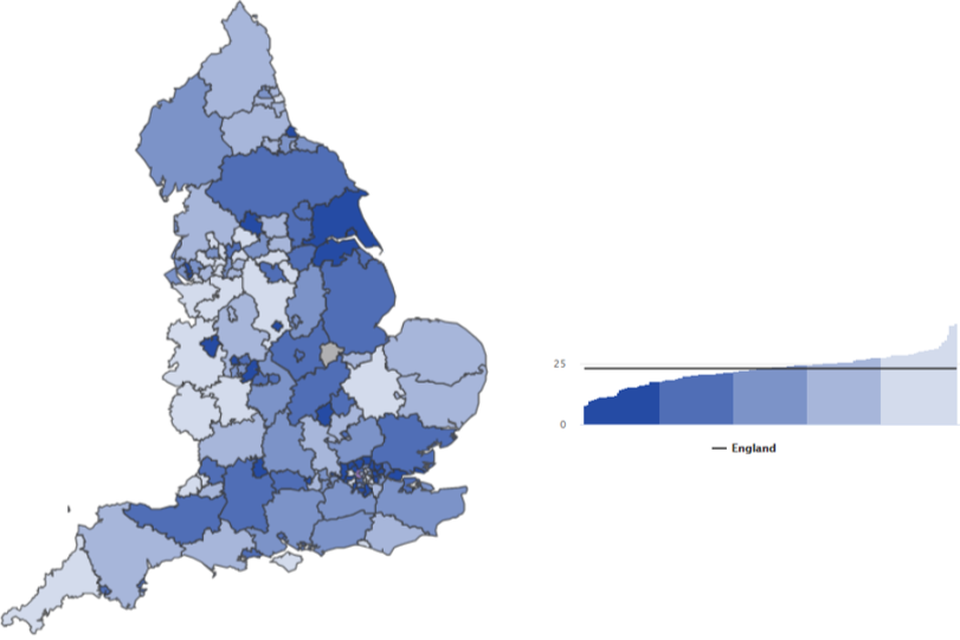
The percentage of adults drinking over 14 units of alcohol a week in England has reduced from 25.3% in 2011 to 2014 to 22.8% in 2015 to 2018.
The percentage of adults drinking over 14 units of alcohol a week was highest in the least deprived decile (24.1%) and lowest in the most deprived decile (19.9%), though differences across deciles were minor. Again, this differs from indicators for alcohol-related harm, especially mortality and admissions, where the more deprived decile typically experiences the greatest burden of harm.
For 2015 to 2018 (excluding Kensington and Chelsea due to wide confidence intervals), Brighton and Hove and the Isle of Wight (both 47.0%) had the highest percentage of adults drinking over 14 units of alcohol a week, while Slough (7.9%) had the lowest.
Figure 3: Percentage of adults drinking over 14 units of alcohol a week, county and UA, 2015 to 2018
Alcohol-related cancer incidence
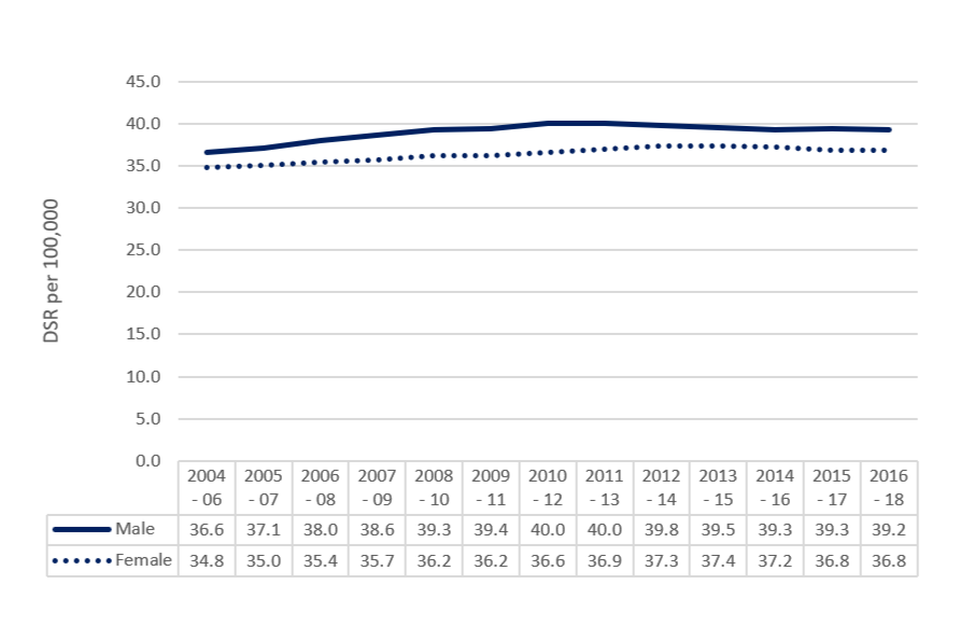
Between 2016 to 2018 there were an estimated 59,000 cancer registrations which were related to alcohol consumption. This equates to approximately 19,667 new cancer cases each year attributed to alcohol.
The rate of alcohol-related cancers in males increased gradually between 2004 to 2006 and 2011 to 2013 and fell in each subsequent period. In the 3-year period of 2016 to 2018, the rate in males fell to 39.2 alcohol-related cancers per 100,000 population. The rate of new alcohol-related cancers in females increased each period to 2013 to 2015 but reduced in 2014 to 2016 and 2015 to 2017. In the most recent period (2016 to 2018), the rate of new alcohol-related cancers in females remained at 36.8 per 100,000 population.
Figure 4: Alcohol-related cancer incidence by sex, England
Alcohol-related cancer incidence rates were higher for those in the most deprived decile (41.1 per 100,000), compared with the least deprived decile (35.8 per 100,000). For 2016 to 2018, Blackpool (48.5 per 100,000) had the highest rate followed by Manchester (48.1 per 100,000), while Westminster (28.4 per 100,000) had the lowest followed by Harrow (30.5 per 100,000).
Background and further information
The Local Alcohol Profiles for England (LAPE) have been published on an annual basis since 2006. These profiles have been designed to help local government and health services assess the effect of alcohol use on their local populations. They will inform commissioning and planning decisions to tackle alcohol use and improve the health of local communities.
The LAPE data tool helps local areas assess alcohol-related harm and monitor the progress of efforts to reduce this.
You can view the LAPE tool here.
Definitions and methodology for all LAPE indicators is described in our user guide.
You can view the LAPE User Guide here.
Responsible statistician, product lead: Mark Cook
For queries relating to this publication, please contact: lape@phe.gov.uk