Local Alcohol Profiles for England: short statistical commentary, February 2021
Published 2 February 2021
Applies to England

© Crown copyright 2021
This publication is licensed under the terms of the Open Government Licence v3.0 except where otherwise stated. To view this licence, visit nationalarchives.gov.uk/doc/open-government-licence/version/3 or write to the Information Policy Team, The National Archives, Kew, London TW9 4DU, or email: psi@nationalarchives.gov.uk.
Where we have identified any third party copyright information you will need to obtain permission from the copyright holders concerned.
This publication is available at https://www.gov.uk/government/statistics/local-alcohol-profiles-for-england-lape-february-2021-update/local-alcohol-profiles-for-england-short-statistical-commentary-february-2021
1. New in this update
New alcohol-specific mortality and hospital admissions data have been added to the Local Alcohol Profiles for England (LAPE) tool on the Fingertips platform. The following indicators have been updated and are available at local authority level as well as for England, the regions, and various inequality groups:
- alcohol-specific mortality
- mortality from chronic liver disease
- hospital admissions due to alcohol-specific conditions
- hospital admissions due to alcohol-specific conditions – Under 18s
2. Main findings
- there were 17,360 alcohol-specific deaths in England between 2017 and 2019, an increase in the rate to 10.9 (per 100,000). This is the fourth successive increase in the rate
- the rate of deaths from chronic liver disease was 12.0 (per 100,000), equating to 19,100 deaths between 2017 and 2019
- the rate of hospital admissions for conditions solely caused by alcohol consumption increased for the third consecutive year in 2019 to 2020, equating to 347,760 admissions
- the rate of hospital admissions for conditions solely caused by alcohol consumption in the under 18s continued to fall in 2019 to 2020
- gender and inequality gaps persist across the measures showing that disproportionate levels of harm are impacting on men and the most deprived
3. Key definitions used in this release
- alcohol-specific mortality: Deaths from conditions wholly caused by alcohol. This definition is also used by the Office for National Statistics in their annual UK data release
- mortality from chronic liver disease: Deaths from chronic liver disease, including cirrhosis, classified by an underlying cause of death with ICD10 code K70, K73 or K74
- alcohol-specific admissions: Admissions to hospital where the primary diagnosis or any of the secondary diagnoses are an alcohol-specific (wholly attributable) condition
4. Summary of updated indicators
4.1 Alcohol-specific mortality
There were 17,360 alcohol-specific deaths in England between 2017 and 2019. This equates to a rate of 10.9 (per 100,000) and is the fourth successive increase in the rate. The rate in 2017 to 2019 is the same as it was at the start of LAPE in 2006 to 2008. The female rate between 2017 and 2019 was 7.1 (per 100,000) while the male rate was 14.9 (per 100,000). Consequently, the number of alcohol-specific deaths between 2017 and 2019 for men (11,580) was double the figure for women (5,770).
Figure 1: Alcohol-specific mortality by gender, England
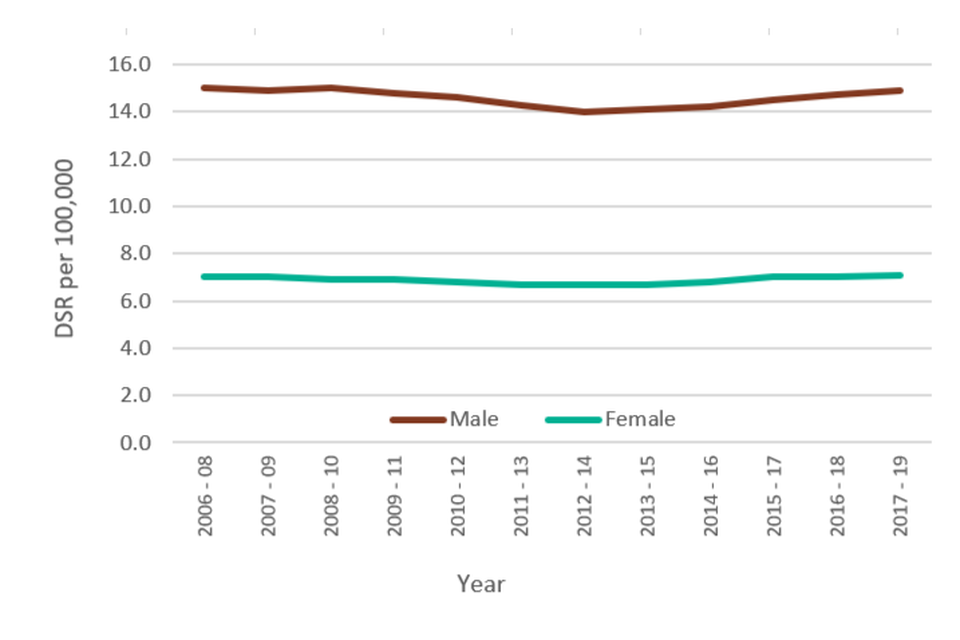
The rate of alcohol-specific deaths in the most deprived decile (15.8 per 100,000) was double the rate observed in the least deprived decile (7.2 per 100,000) in the most recent time period.
Figure 2 shows the variation in alcohol-specific mortality rates across local authorities in England, ranging from 3.9 (per 100,000) in Bracknell Forest to 27.3 (per 100,000) in Blackpool, a 7-fold difference.
Figure 2: Alcohol-specific mortality, district and unitary authorities in England, 2017 to 2019

4.2 Mortality from chronic liver disease
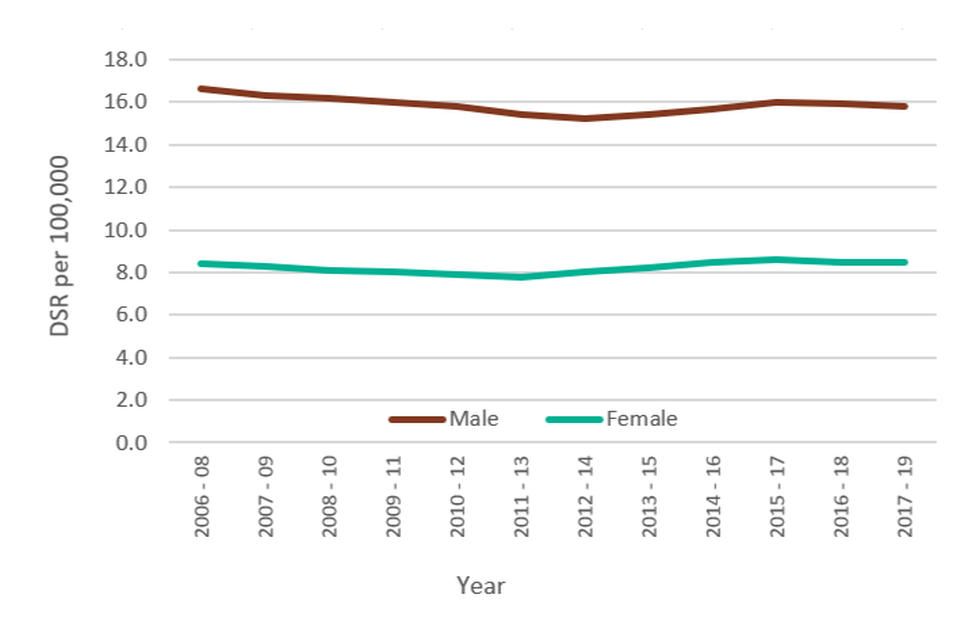
There were 19,100 deaths from chronic liver disease between 2017 and 2019. This equates to a rate of 12.0 (per 100,000).
The female rate (8.5 per 100,000) and the male rate (15.8 per 100,000) both showed little change in the latest period. Again, the number of deaths from chronic liver disease between 2017 and 2019 for men (12,120) was almost double the number for women (6,980).
Figure 3: Mortality from chronic liver disease by gender, England
The rate of chronic liver disease mortality in the most deprived areas (17.2 per 100,000) was almost double the rate in the least deprived (8.7 per 100,000) in the most recent time period.
Figure 4: Mortality from chronic liver disease by deprivation decile, England 2017 to 2019

4.3 Alcohol-specific admissions
In 2019 to 2020, there were 347,760 alcohol-specific hospital admissions. The rate of admissions increased from 626 (per 100,000) in 2018 to 2019 to 644 (per 100,000) in 2019 to 2020, the third consecutive increase.
Figure 5: Admissions for alcohol-specific conditions, England
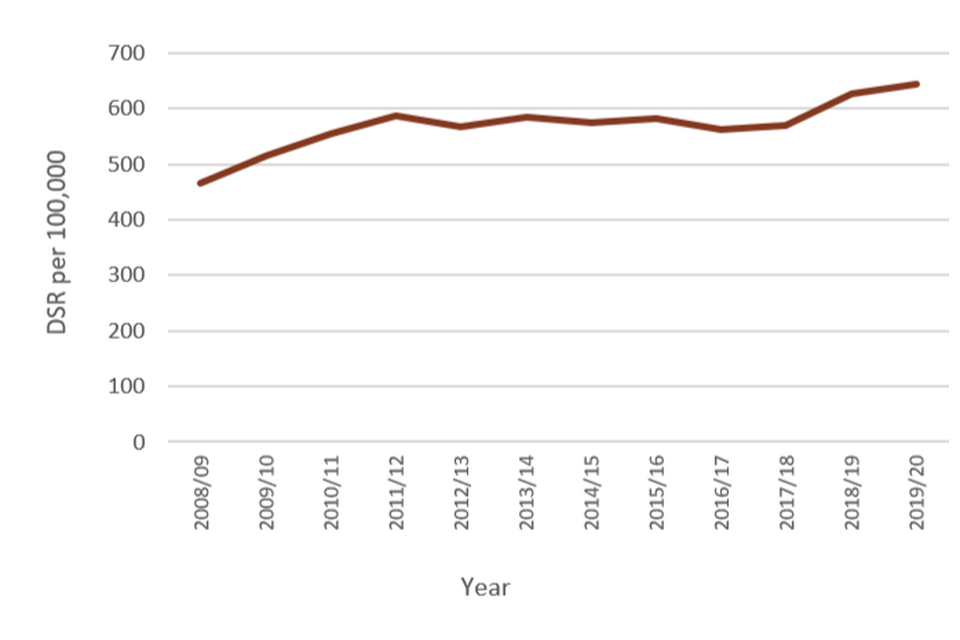
Alcohol-specific hospital admissions are strongly associated with deprivation. The rate of hospital admissions was markedly higher in the most deprived 10% of local authorities (894 per 100,000) compared to the least deprived 10% (462 per 100,000).
Alcohol-specific hospital admissions in the under 18s have been falling every year since the earliest period published in LAPE (2006 to 2007 and 2008 to 2009). In the 3-year period 2017 to 2018 and 2019 to 2020, there were 10,990 admissions, with the rate again falling from 31.6 (per 100,000) to 30.7 (per 100,000).
In the under 18 group, more girls are admitted to hospital for alcohol-specific reasons than boys. In the most recent 3-year period, the admission rate for girls was 36.7 (per 100,000) compared to 24.9 (per 100,000) for boys.
Figure 6: Under 18 admissions for alcohol-specific conditions by gender, England

5. Background and further information
The Local Alcohol Profiles for England (LAPE) have been published on an annual basis since 2006. These profiles have been designed to help local government and health services assess the effect of alcohol use on their local populations. They will inform commissioning and planning decisions to tackle alcohol use and improve the health of local communities.
The LAPE data tool helps local areas assess alcohol-related harm and monitor the progress of efforts to reduce this.
View the LAPE Profile
Definitions and methodology for all LAPE indicators are described in our user guide.
View the LAPE User Guide
Responsible statistician, product lead: Mark Cook For queries relating to this publication, please contact: lape@phe.gov.uk