Local Alcohol Profiles for England: short statistical commentary, February 2020
Updated 12 February 2020

© Crown copyright 2020
This publication is licensed under the terms of the Open Government Licence v3.0 except where otherwise stated. To view this licence, visit nationalarchives.gov.uk/doc/open-government-licence/version/3 or write to the Information Policy Team, The National Archives, Kew, London TW9 4DU, or email: psi@nationalarchives.gov.uk.
Where we have identified any third party copyright information you will need to obtain permission from the copyright holders concerned.
This publication is available at https://www.gov.uk/government/statistics/local-alcohol-profiles-for-england-february-2020-data-update/local-alcohol-profiles-for-england-short-statistical-commentary-february-2020
1. New in this update
New admissions data for 2018 to 2019 has been added to the Local Alcohol Profiles for England (LAPE) tool on the Fingertips platform. The following indicators have been updated and are available at Local Authority level as well as for England, the regions, and various inequality groups:
- admission episodes for alcohol-related conditions (Broad)
- admission episodes for alcohol-related conditions (Narrow)
- admission episodes for alcohol-specific conditions
- this release includes the above indicators broken down by age group and cause where appropriate
The following new indicators have been added to the LAPE tool:
- quarterly admission episodes for alcohol-related conditions (Broad)
- quarterly admission episodes for alcohol-related conditions (Narrow)
This reinstates the quarterly estimates that were removed from LAPE for methodological reasons some time ago.
2. Main findings
In 2018 to 2019 in England there were 1.26 million hospital admissions where the primary or any secondary reason for admission was related to alcohol (Broad measure). Increases in the admission rate have been observed every year since 2008 to 2009.
The rate of hospital admissions where the main reason for admission was related to alcohol (Narrow measure) has historically been relatively static, but there has been an increase in the rate in 2018 to 2019. This increase represents the highest rate observed since the start of LAPE.
The rate of hospital admissions for alcohol-related conditions on the Narrow measure was highest in the over 65s age group.
The rate of hospital admissions for conditions solely caused by alcohol consumption in the under 18s continued to fall in 2018 to 2019.
The majority of alcohol related conditions are due to chronic conditions partially caused by alcohol, the most common being cardiovascular disease.
3. Main definitions used in this release
3.1 Broad definition
A measure of hospital admissions where either the primary diagnosis (main reason for admission) or one of the secondary (contributory) diagnoses is an alcohol-related condition. This represents a broad measure of alcohol-related admissions but is sensitive to changes in coding practice over time.
3.2 Narrow definition
A measure of hospital admissions where the primary diagnosis (main reason for admission) is an alcohol-related condition. This represents a narrower measure. Since every hospital admission must have a primary diagnosis it is less sensitive to coding practices but may also understate the part alcohol plays in the admission.
In general, the Broad measure gives an indication of the full impact of alcohol on hospital admissions and the burden placed on the NHS. The Narrow measure estimates the number of hospital admissions which are primarily due to alcohol consumption and provides the best indication of trends in alcohol-related hospital admissions.
-
Wholly attributable: these are conditions known to be solely caused by alcohol consumption. Examples are alcoholic liver disease and acute alcohol intoxication
-
Partially attributable: these are conditions where it is known that a proportion of the cases are caused by alcohol consumption. Examples are circulatory diseases and certain cancers
4. Summary of updated indicators
4.1 Alcohol-related admissions (Broad)
In 2018 to 2019, there were 1.26 million alcohol-related hospital admissions on the Broad definition measure. The rate increased from 2,224 (per 100,000) in 2017 to 2018 to 2,367 (per 100,000) in 2018 to 2019. Increases in the rate have been observed every year since 2008 to 2009.
Figure 1: Admissions for alcohol-related conditions (Broad), England
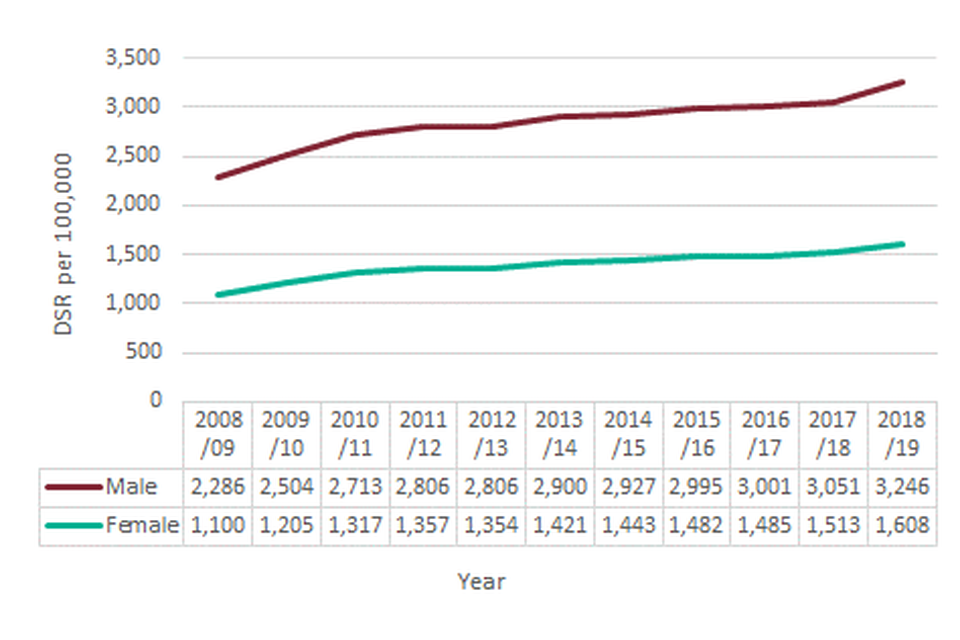
Figure 1: Admissions for alcohol-related conditions (Broad), England
Alcohol-related hospital admissions are associated with deprivation. The rate of hospital admissions on the Broad definition was markedly higher in the most deprived 10% of district and unitary authorities (3,002 per 100,000) than in the least deprived 10% (1,817 per 100,000).
Rates of alcohol-related hospital admissions vary across the country. The South East had the lowest rate (1,921 per 100,000) and the North East the highest (2,927 per 100,000).
Variation across local authorities was even greater with the lowest rate in Wokingham (1,329 per 100,000) and the highest in Southampton (4,022 per 100,000).
Figure 2: admissions for alcohol-related conditions (Broad), district and unitary authorities, 2018 to 2019
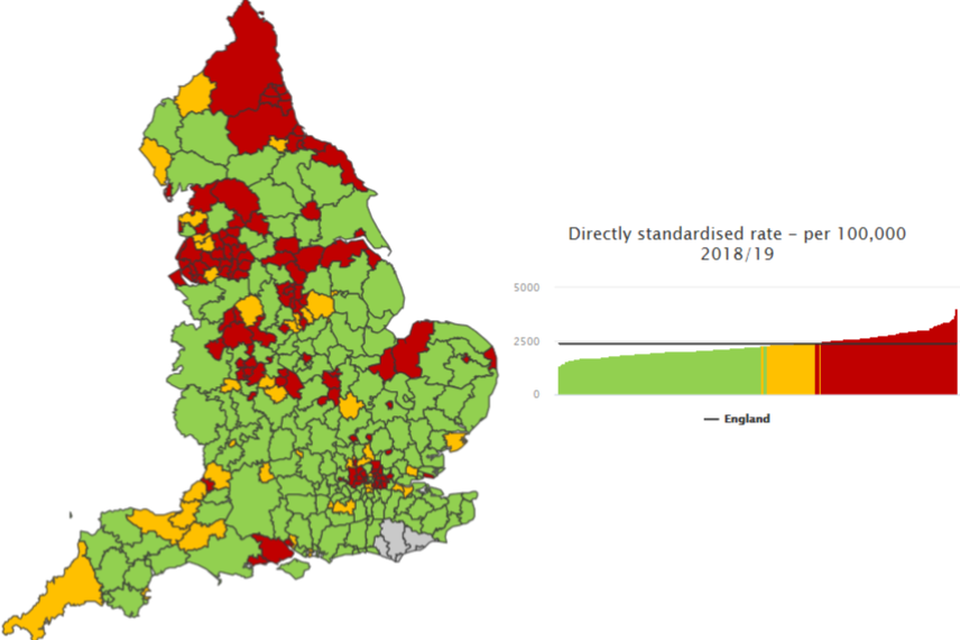
Figure 2: Admissions for alcohol-related conditions (Broad), district and unitary authorities, 2018/19
4.2 Alcohol-related admissions (Narrow)
In 2018 to 2019, there were 357,659 hospital admissions for alcohol-related conditions on the Narrow measure. The rate had changed relatively little over time but did increase to 664 (per 100,000) in 2018 to 2019. This is the highest rate observed since the start of LAPE.
Figure 3: admissions for alcohol-related conditions (Narrow), England
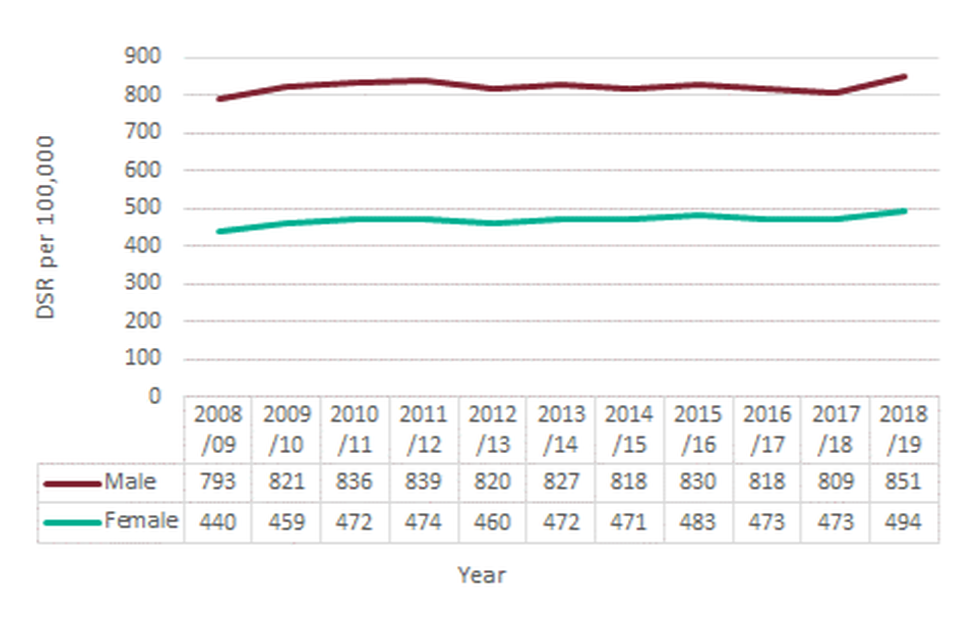
Figure 3: Admissions for alcohol-related conditions (Narrow), England
The rate of hospital admissions for alcohol-related conditions on the Narrow measure was highest in the over 65s age group (1,049 per 100,000) followed by the 40-64 age group (929 per 100,000). By gender, the rate was highest for males aged over 65 (1,501 per 100,000) and for females aged 40 to 64 (714 per 100,000). However, the rates in the 2 oldest female groups are beginning to converge.
Figure 4: admissions for alcohol-related conditions (Narrow), Males, England
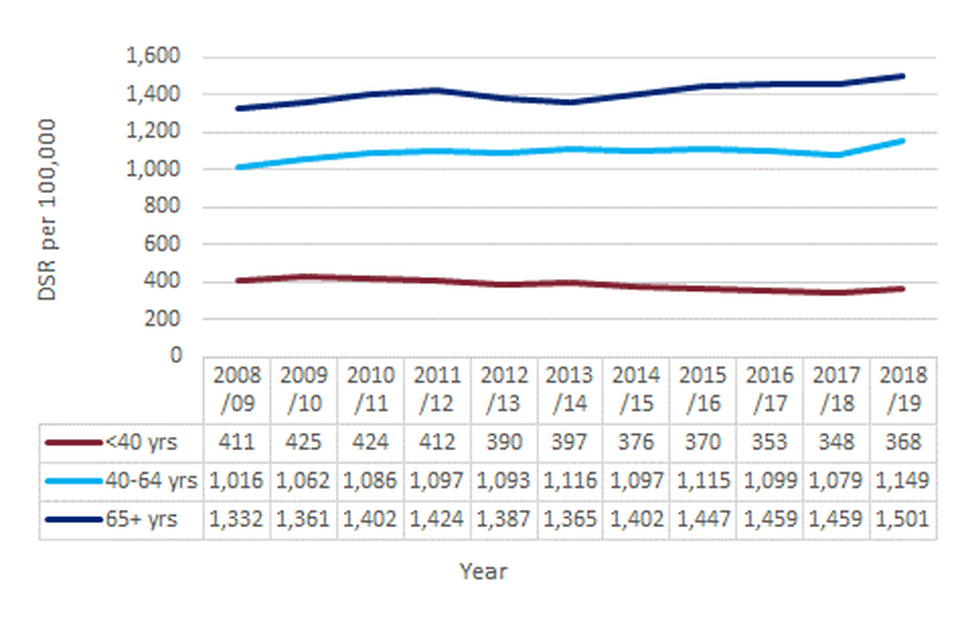
Figure 4: Admissions for alcohol-related conditions (Narrow), Males, England
Figure 5: admissions for alcohol-related conditions (Narrow), Females, England
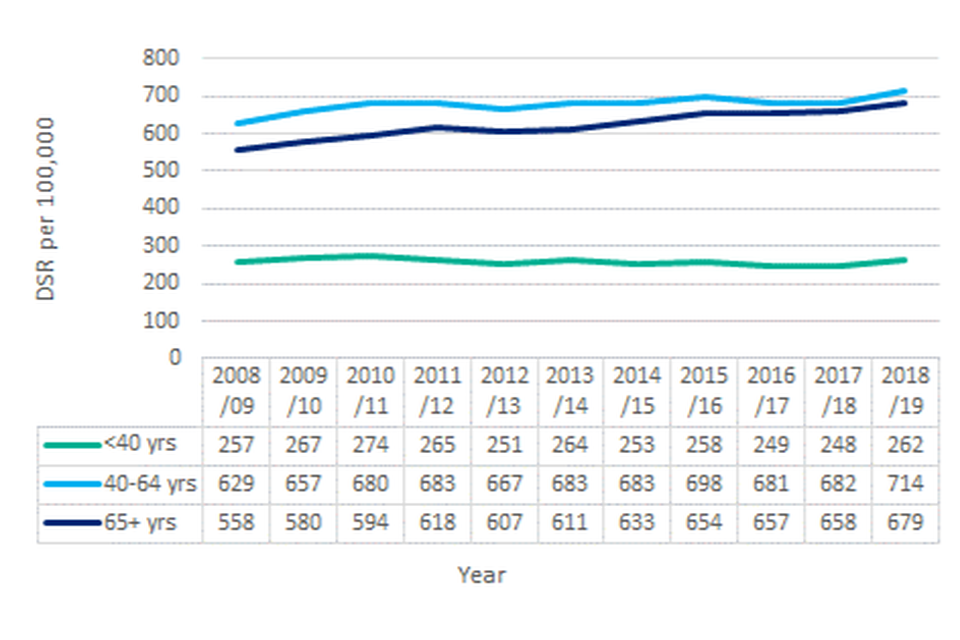
Figure 5: Admissions for alcohol-related conditions (Narrow), Females, England
The rate of hospital admissions on the Narrow definition was higher in the most deprived 10% of local authorities (775 per 100,000) than the least deprived 10% (510 per 100,000).
The South East had the lowest rate (526 per 100,000) and the North East the highest (908 per 100,000).
Variation across local authorities was even greater with the lowest rate in Wokingham (389 per 100,000) and the highest in Stoke-on-Trent (1,127 per 100,000).
Figure 6: admissions for alcohol-related conditions (Narrow), district and unitary authorities, 2018 to 2019
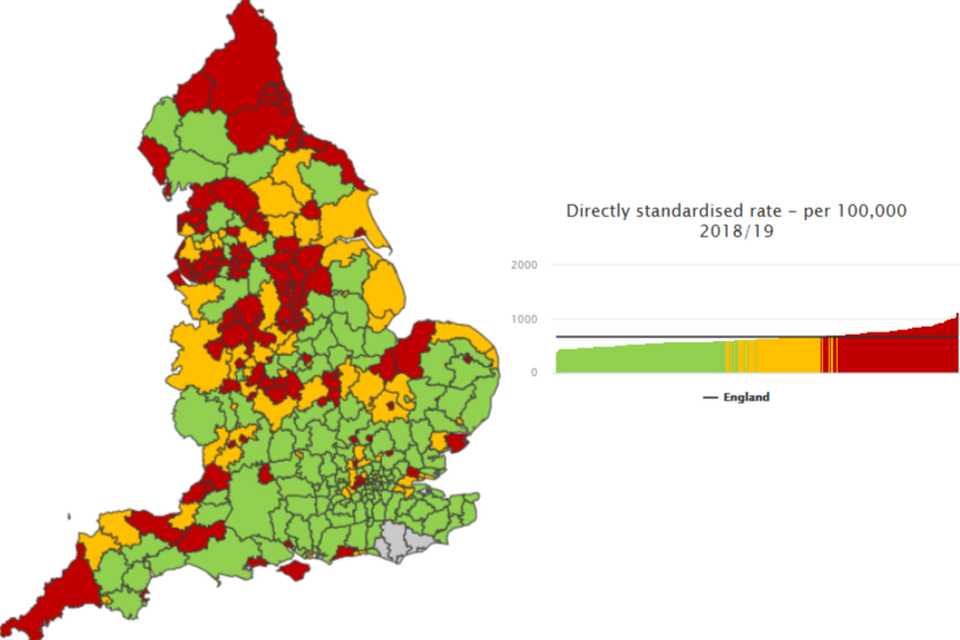
Figure 6: Admissions for alcohol-related conditions (Narrow), district and unitary authorities, 2018/19
4.3 Alcohol-specific admissions
In 2018 to 2019, there were 336,314 alcohol-specific hospital admissions. The rate of admissions increased from 570 (per 100,000) in 2017 to 2018 to 626 (per 100,000) in 2018 to 2019.
Figure 7: Admissions for alcohol-specific conditions, England
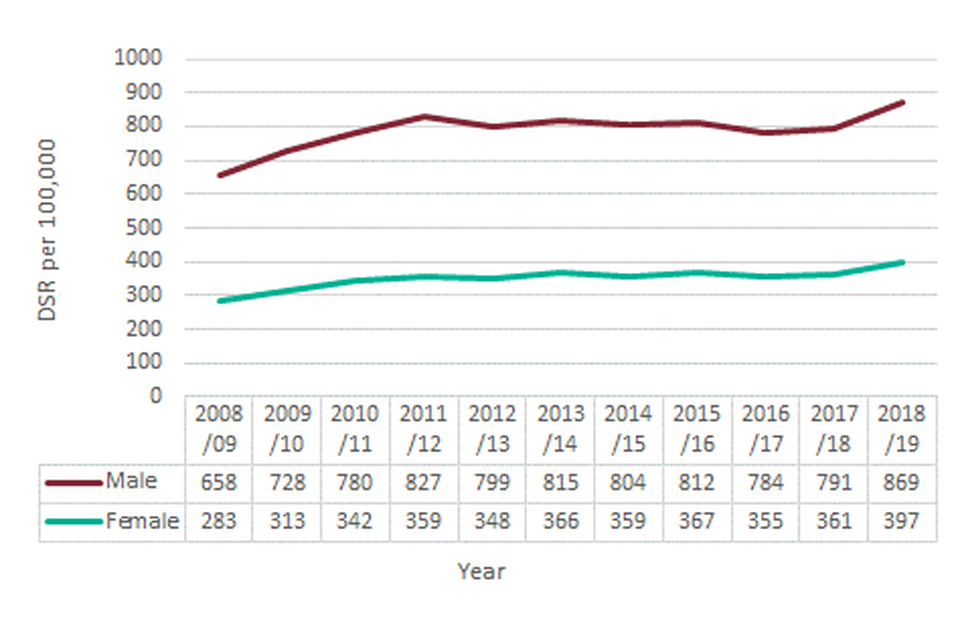
Figure 7: Admissions for alcohol-specific conditions, England
Alcohol-specific hospital admissions are strongly associated with deprivation. The rate of hospital admissions was markedly higher in the most deprived 10% of local authorities (894 per 100,000) than observed in the least deprived 10% (447 per 100,000).
Alcohol-specific hospital admissions in the under 18s have been falling every year over the past decade. In the 3-year period 2016 to 2017, to 2018 to 2019 there were 11,233 admissions, with the rate again falling from 32.9 (per 100,000) to 31.6 (per 100,000).
Figure 8: under 18 admissions for alcohol-specific conditions, England
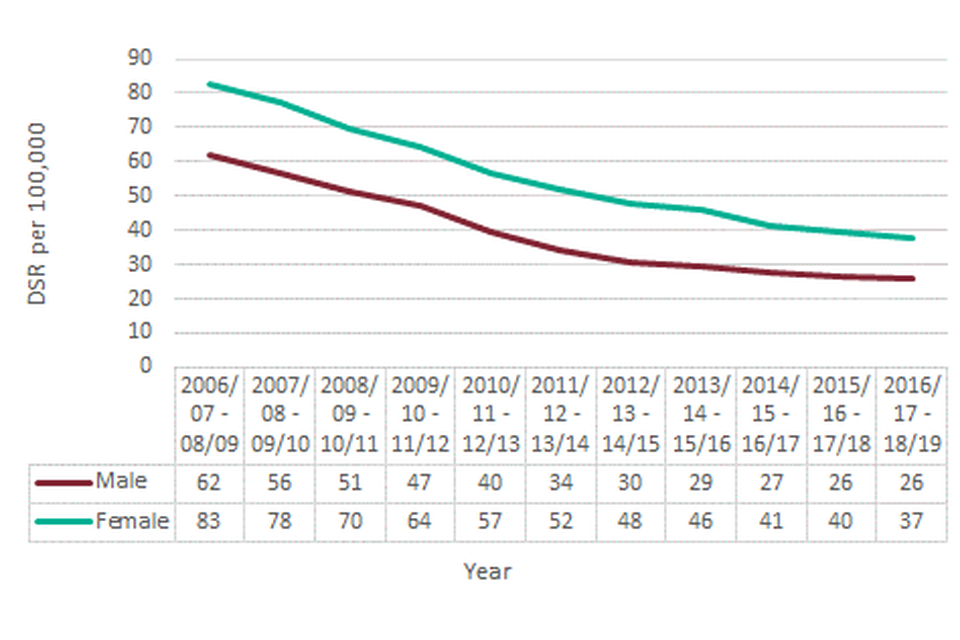
Figure 8: Under 18 admissions for alcohol-specific conditions, England
In the under 18 group, more girls are admitted to hospital for alcohol-specific reasons than boys. In the most recent 3-year period, the admission rate for girls was 37.5 (per 100,000) compared to 25.9 (per 100,000) for boys.
4.4 Alcohol-related conditions
In 2018 to 2019, chronic conditions which are partially but not wholly caused by alcohol accounted for 68% of all alcohol-related hospital admissions on the Broad definition.
Figure 9: number of alcohol-related admissions (Broad) by condition type, England, 2018 to 2019
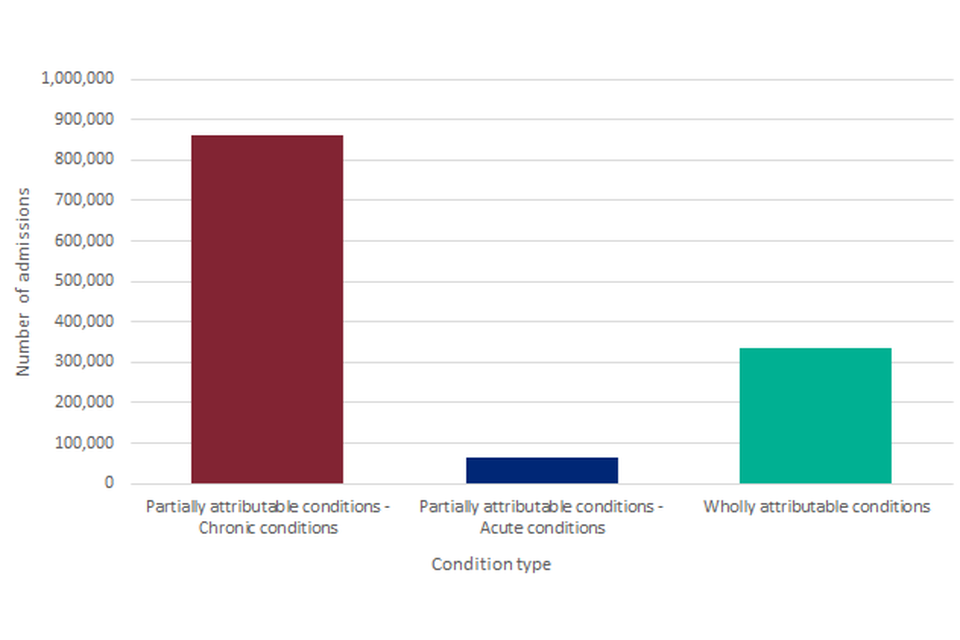
Figure 9: Number of alcohol-related admissions (Broad) by condition type, England, 2018/19
As shown in Figure 10, cardiovascular disease is the most common reason for admission. In 2018 to 2019, there were an estimated 645,070 alcohol-related hospital admissions from cardiovascular disease.
Figure 10: number of alcohol-related admissions (Broad) due to chronic conditions which are partially but not wholly caused by alcohol, England, 2018 to 2019
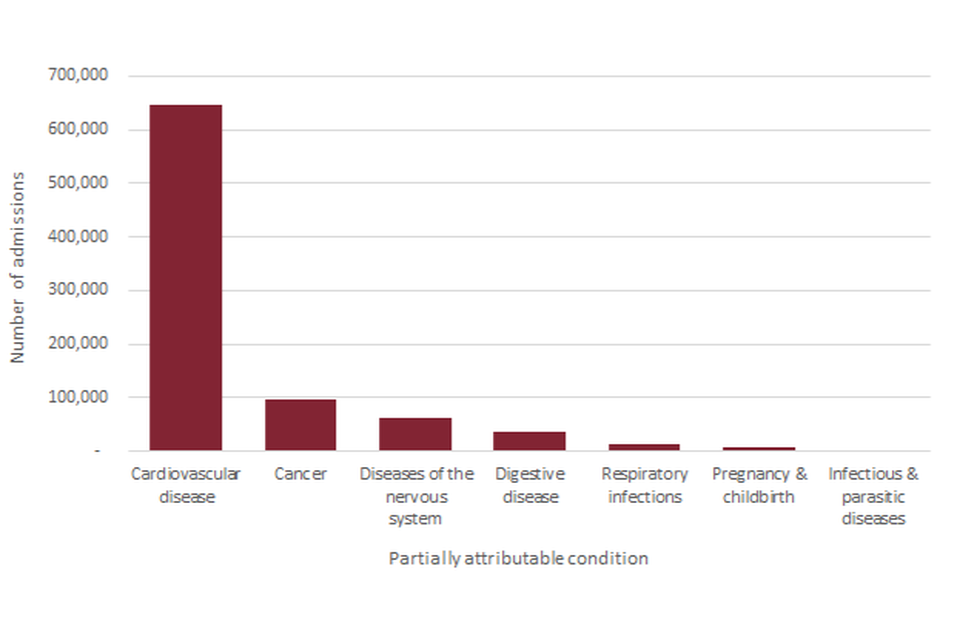
Figure 10: Number of alcohol-related admissions (Broad) due to chronic conditions which are partially but not wholly caused by alcohol, England, 2018/19
4.5 Quarterly admission episodes for alcohol-related conditions
In quarter 4 2018 to 2019 (January to March 2019) there were 317,540 hospital admissions for alcohol-related conditions on the Broad measure. This equates to an admission rate of 2,472 (per 100,000), higher than the comparative annual rate for 2018/19 (2,367 per 100,000). Each quarter of 2018 to 2019 has seen a steady increase in the rate and this is in line with the general trend for this indicator.
Figure 11: quarterly admissions for alcohol-related conditions (Broad), England
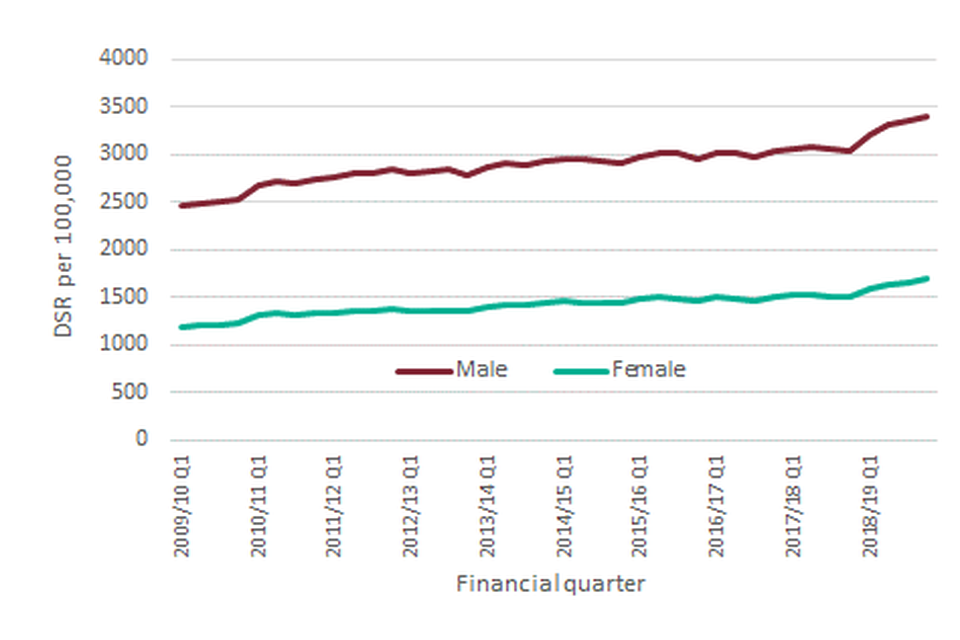
Figure 11: Quarterly admissions for alcohol-related conditions (Broad), England
In quarter 4 2018 to 2019 (January to March 2019) there were 88,130 hospital admissions for alcohol-related conditions on the Narrow measure. This equates to an admission rate of 679 (per 100,000), again higher than the comparative annual rate for 2018 to 2019 (664 per 100,000). The last 3 quarters of 2018 to 2019 demonstrate the highest rates in the quarterly trend since the start of LAPE.
Figure 12: quarterly admissions for alcohol-related conditions (Narrow), England
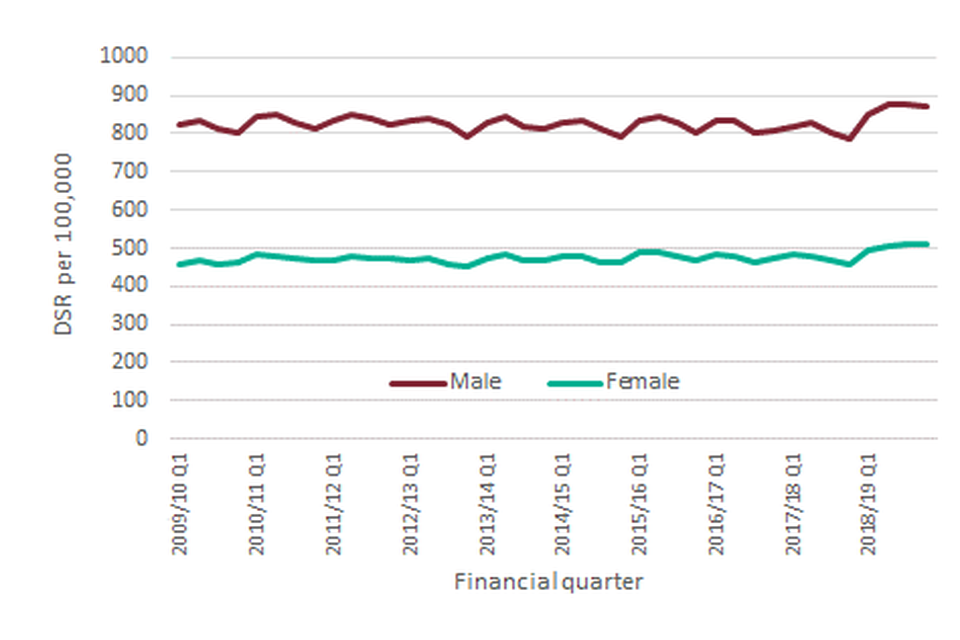
Figure 12: Quarterly admissions for alcohol-related conditions (Narrow), England
Though some local authorities show a peak in the quarterly rate around Christmas and New Year, at England level the summer months (July to September) tend to have the highest rate of alcohol-related admissions and this is true for 2018 to 2019 where we observe a rate of 683 (per 100,000) in quarter 2 for the Narrow measure. This pattern is more marked in the Narrow than it is in the Broad indicator where the steady increase is the main feature.
5. Background and further information
The Local Alcohol Profiles for England (LAPE) have been published on an annual basis since 2006. These profiles have been designed to help local government and health services assess the effect of alcohol use on their local populations. They will inform commissioning and planning decisions to tackle alcohol use and improve the health of local communities.
The LAPE data tool helps local areas assess alcohol-related harm and monitor the progress of efforts to reduce this.
Definitions and methodology for all LAPE indicators is described in our user guide.
Responsible statistician, product lead: Mark Cook For queries relating to this publication contact: lape@phe.gov.uk.