Liver disease profiles: statistical commentary, November 2019
Published 5 November 2019

© Crown copyright 2019
This publication is licensed under the terms of the Open Government Licence v3.0 except where otherwise stated. To view this licence, visit nationalarchives.gov.uk/doc/open-government-licence/version/3 or write to the Information Policy Team, The National Archives, Kew, London TW9 4DU, or email: psi@nationalarchives.gov.uk.
Where we have identified any third party copyright information you will need to obtain permission from the copyright holders concerned.
This publication is available at https://www.gov.uk/government/statistics/liver-disease-profiles-november-2019-update/liver-disease-profiles-statistical-commentary-november-2019
Liver Disease Profiles, November 2019 update
New in this update
New mortality and vaccination coverage data has been added to the Liver Disease Profiles
This update includes new data for 8 indicators in the liver disease profile:
-
Mortality from liver disease in persons, males and females aged under 75
-
Mortality from alcoholic liver disease in persons, males and females aged under 75
-
Percentage of eligible children who received 4 doses of Hepatitis B vaccine at any time by their 2nd birthday
-
Incidence rates of acute hepatitis B in all persons
-
Mortality from hepatitis B related end-stage liver disease/hepatocellular carcinoma in persons aged under 75
-
Rate of new diagnoses of confirmed chronic hepatitis C in persons aged over 1 year
-
Mortality from hepatitis C related end-stage liver disease/hepatocellular carcinoma in persons aged under 75
-
Mortality from non-alcoholic fatty liver disease (NAFLD) in persons aged under 75
Mortality data for the years 2016 to 2018 have been added for the first time. The mortality indicators have been recalculated for the new 2019 local authority configurations. Additional data back to 2001 to 2003 has also been newly added to these indicators to give a more comprehensive trend view.
Main findings
This update shows:
-
in 2016 to 2018, there were 26,558 premature deaths due to liver disease in England, a rate of 18.5 per 100,000 population under the age of 75
-
rates of liver disease across local authority areas are generally much higher in males than females, however in 7 local authority areas, the rate experienced by females is higher than males
-
rates of premature alcoholic liver disease mortality remained with same as in 2015 to 2017 where the rate remains significantly higher in males (11.9 per 100,000 population aged under 75) than females (6.1 per 100,000 population aged under 75)
-
hepatitis B vaccination coverage data showed 58 UTLA areas with 100 coverage
-
rates of premature mortality from Hepatitis B related end-stage liver disease / hepatocellular carcinoma disease are highest amongst the most deprived unitary authority areas (based on IMD 2015)
-
hepatitis C detection rate has gone down from 19.7 in 2016, to 18.4 in 2017
-
during 2016 to 2018, the rate of premature deaths from hepatitis C related end stage liver disease or liver cancer was 0.6 per 100,000 population in England (902 deaths)
-
The North West region experience rates of people dying prematurely from non-alcoholic fatty liver disease that were over 5 times higher than those experienced in the West Midlands region.
Summary
Premature mortality rate due to liver disease
This indicator has been updated with 2016 to 2018 data for males, females and persons. Data has been refreshed and presents data to the new 2019 local authority configurations. This indicator highlights the premature deaths caused by a largely preventable disease in each lower and upper tier local area.
In 2016 to 2018 the rate of premature mortality due to liver disease remained at 18.5 per 100,000 population aged under 75 in England. Though the rate has stayed the same as in 2015 to 2017, there were almost 300 more deaths in 2016 to 2018.
The rate had progressively been increasing since 2001 to 2003 when it was 15.8 per 100,000 population aged under 75 across England, accounting for almost 6,400 deaths a year and now accounts for 8850 deaths a year.
Figure 1: Mortality rate due to liver disease, per 100,000 population age under 75, England, from 2001 to 2003 to 2016 to 2018
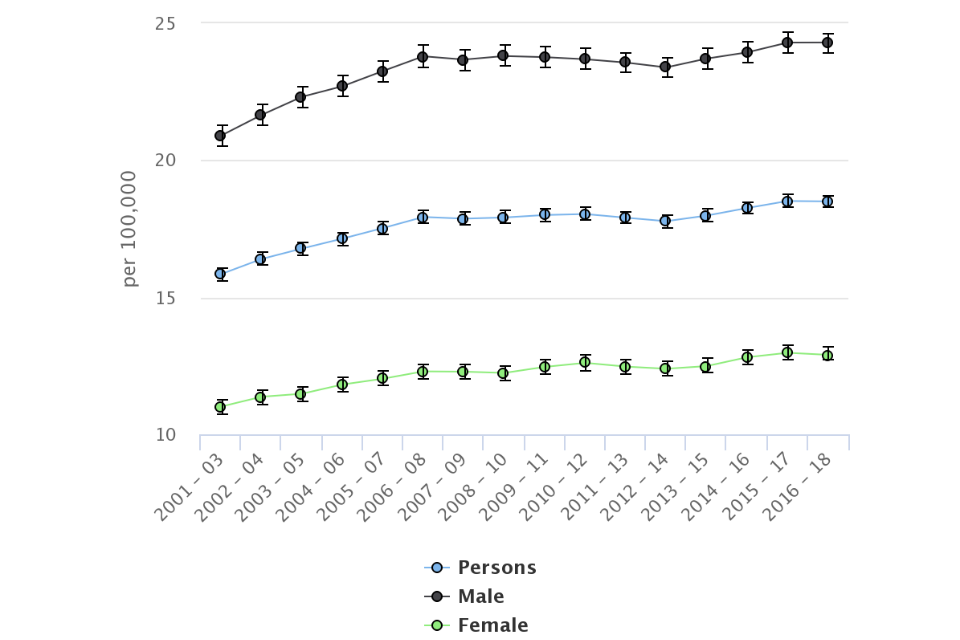
Figure 1: Mortality rate due to liver disease, per 100,000 population age under 75, England, from 2001 to 2003 to 2016 to 2018
Liver disease continues to claim more lives each year. Males, aged under 75, in 2016 to 2018, experienced a rate of 24.3 deaths per 100,000, a rate almost twice as high as females (12.9 per 100,000). Broxbourne local authority showed the widest gap with a 3.4-fold difference between the rate experienced by males compared to females. Maidstone, Dartford, Tewkesbury, South Cambridgeshire, Tamworth, Richmondshire and West Devon local authorities however showed slightly higher rates in females than males.
Across the LTLAs rates varied from the highest rate 45.1 per 100,000 population in Blackpool to 7.7 in Mid Suffolk. Birmingham had the largest count of deaths from liver disease with 560 deaths in 2016 to 2018. Areas experiencing greater levels deprivation have much higher rates of death from liver disease. Those in the most deprived districts have a rate (25.2 per 100,000 people aged over 75) that is twice that of the least deprived districts (12.6 per 100,000 people aged over 75). The trend shows that the gap between the least and most deprived groups are narrowing.
Figure 2: Mortality rate due to liver disease, per 100,000 population aged under 75, by lower tier local authority deprivation decile 2015, England, 2016 to 2018
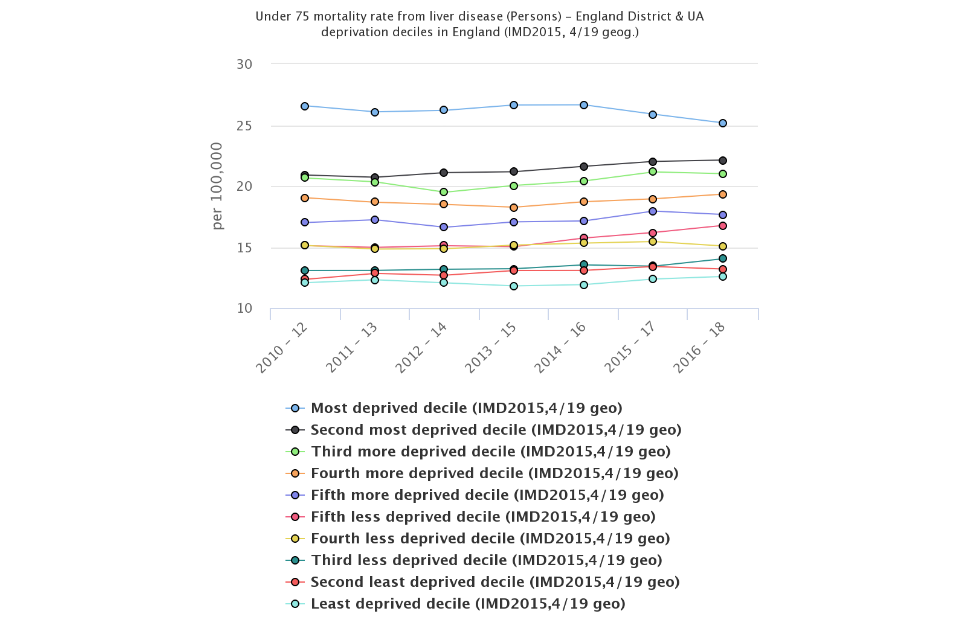
Figure 2: Mortality rate due to liver disease, per 100,000 population aged under 75, by lower tier local authority deprivation decile 2015, England, 2016 to 2018
Premature mortality due to alcoholic liver disease
This indicator has been updated and previous data refreshed to present data from the year 2001 to 2003, up to 2016 to 2018 for males, females and persons using the 2019 upper tier local authority configurations.
In England, the rate of mortality from alcoholic liver disease was 8.9 per 100,000 people, a count of 12,882 deaths.
The trend in mortality rates for alcoholic liver disease has been varied. From 2006 to 2008 the trend had been going down but in 2012 to 2014 the trend started to increase. The 2016 to 2018 rate however remains close to the 2015 to 2017 figure.
Figure 3: Mortality rate from alcoholic liver disease, per 100,000 population age under 75, England, 2001 to 2003 to 2016 to 2018
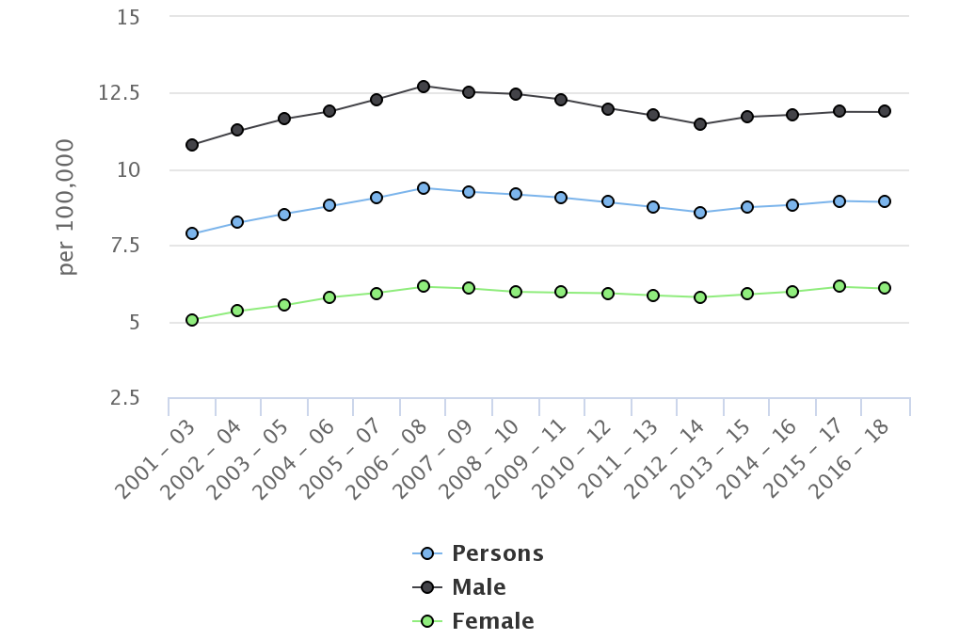
Figure 3: Mortality rate from alcoholic liver disease, per 100,000 population age under 75, England, 2001 to 2003 to 2016 to 2018
Rates of premature alcoholic liver disease mortality is significantly higher in males (11.9 per 100,000 population aged under 75) than for females (6.1 per 100,000 population aged under 75). The unitary authority with the largest difference between male and female rates was Ealing where there was a 4.6-fold difference.
Across the county and unitary authorities, rates varied from 3.7 per 100,000 population aged under 75 in Haringey to 25.4 in Blackpool (figure 4). The rate for Blackpool remains 1.4 times higher than the next highest rate, of 18.5 per 100,000 population aged under 75, experienced in Stoke-on-Trent.
Regionally the northern areas tended to have significantly higher rates than England than the southern regions.
Figure 4: Under 75 alcoholic liver disease mortality rate, per 100,000 population, upper tier local authorities, 2016 to 2018
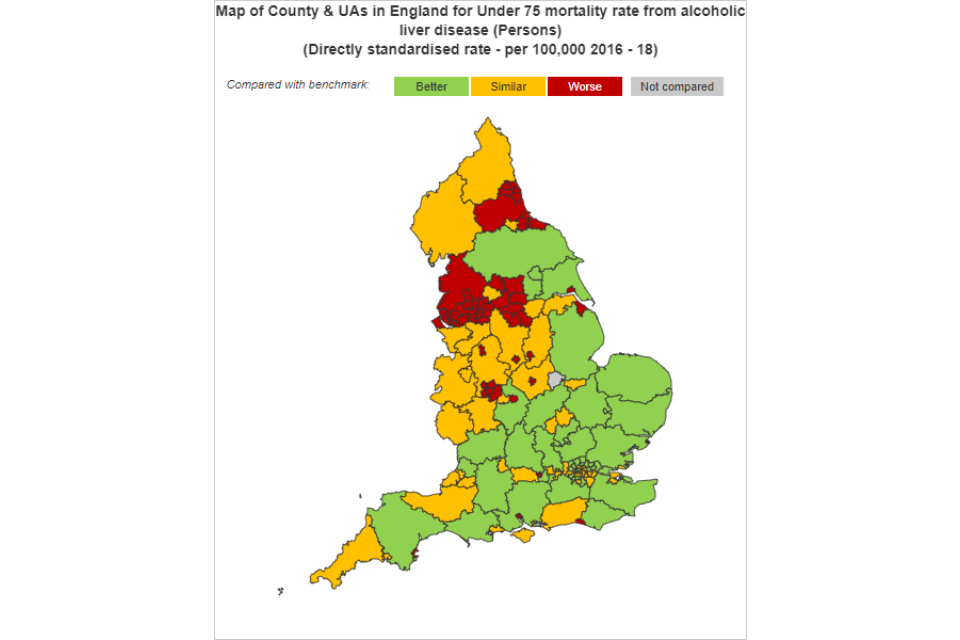
Figure 4: Under 75 alcoholic liver disease mortality rate, per 100,000 population, upper tier local authorities, 2016 to 2018
% of eligible children who received 4 doses of Hepatitis B vaccine at any time by their 2nd birthday
Hepatitis B vaccinations are given to babies born to mothers who are known to have hepatitis B infection as a preventative measure. If a person develops chronic hepatitis B, around a fifth will eventually develop liver cirrhosis and a tenth of these will get liver cancer.
In 2018/19 the median proportion of children aged 24 months who received all 4 doses of the vaccine, was 93.8%. The most deprived 2019 deprivation decile had vaccination rates much lower than the least deprived deprivation decile, 58.6% and 95.3% respectively. 58 of the 152 upper-tier local authority areas had 100% vaccination coverage. For 29 areas coverage was either 0 or unable to be reported due to missing data or data quality reasons.
Incidence rates of acute hepatitis B in all persons
In 2018 there were 381 new occurrences of acute hepatitis B, 64 fewer cases than the previous year. The England rate in 2018 is 0.69 per 100,000 people. Hammersmith and Fulham LTLA experienced the highest rate of 4.37, significantly higher than the England rate.
Premature mortality from hepatitis B related end-stage liver disease / hepatocellular carcinoma
200 premature deaths from hepatitis B related end-stage liver disease / hepatocellular carcinoma occurred from 2016 to 2018 in England, a rate of 0.13 per 100,000 population aged over 75.
Rates of mortality vary across the indices of multiple deprivation (IMD) 2015 deciles. The most deprived groups experience higher rates of mortality from hepatitis B end- stage liver disease / hepatocellular carcinoma than the less deprived areas. However the least deprived decile doesn’t experience the lowest rates. (figure 5)
Figure 5: Hepatitis B related end-stage liver disease / hepatocellular carcinoma disease mortality rate, per 100,000 population aged under 75, 2016 to 2018 by IMD 2015 county and unitary authority deciles in England.
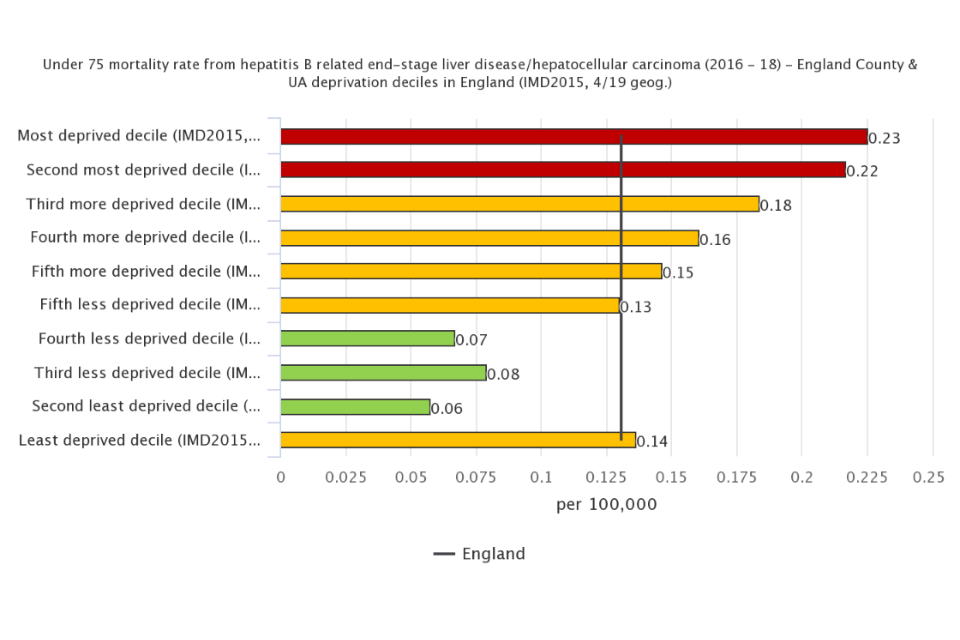
Figure 5: Hepatitis B related end-stage liver disease / hepatocellular carcinoma disease mortality rate, per 100,000 population aged under 75, 2016 to 2018 by IMD 2015 county and unitary authority deciles in England
Hepatitis C detection rate
Hepatitis C is difficult to diagnose but early detection of hepatitis C can reduce people risk of developing liver cirrhosis. The incidence rate of hepatitis C can reflect local disease burden or testing practice.
Data for 2017 shows that there were 9,853 new cases detected in England at a rate of 18.4 per 100,000 population. The 2016 rate was 19.7.
Hepatitis C detection rate explains 32% of the variation in rates of hospital admission for hepatitis C related end-stage liver disease/hepatocellular carcinoma.
Figure 6: Hepatitis C detection rate per 100,000 population aged under 75, 2016 to 2018 by Hospital admission rate for hepatitis C end-stage liver disease / hepatocellular carcinoma per 100,000 population all ages 2012/13 to 2014/15
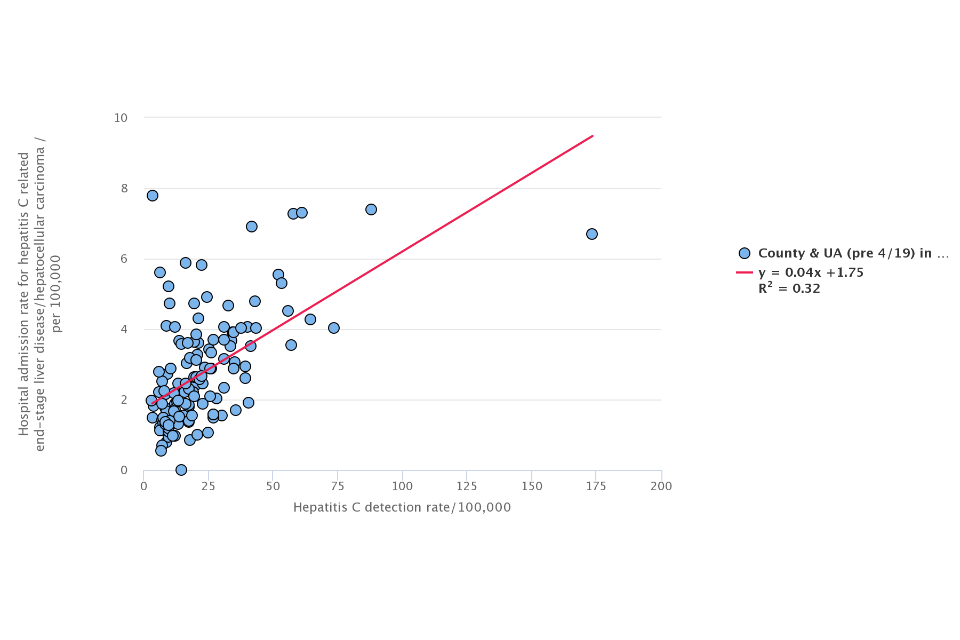
Figure 6: Hepatitis C detection rate per 100,000 population aged under 75, 2016 to 2018 by Hospital admission rate for hepatitis C end-stage liver disease / hepatocellular carcinoma per 100,000 population all ages 2012/13 to 2014/15
Premature mortality from hepatitis C related end-stage liver disease / hepatocellular carcinoma
About three quarters of people infected with acute hepatitis C develop a chronic condition that can lead to end stage liver disease or liver cancer. During 2016 to 2018, the rate of deaths in those aged under 75 from hepatitis C related end stage liver disease or liver cancer was 0.59 per 100,000 population in England (902 deaths).
Figure 7: Under 75 mortality rate from hepatitis C related end-stage liver disease/hepatocellular carcinoma, per 100,000 population, England
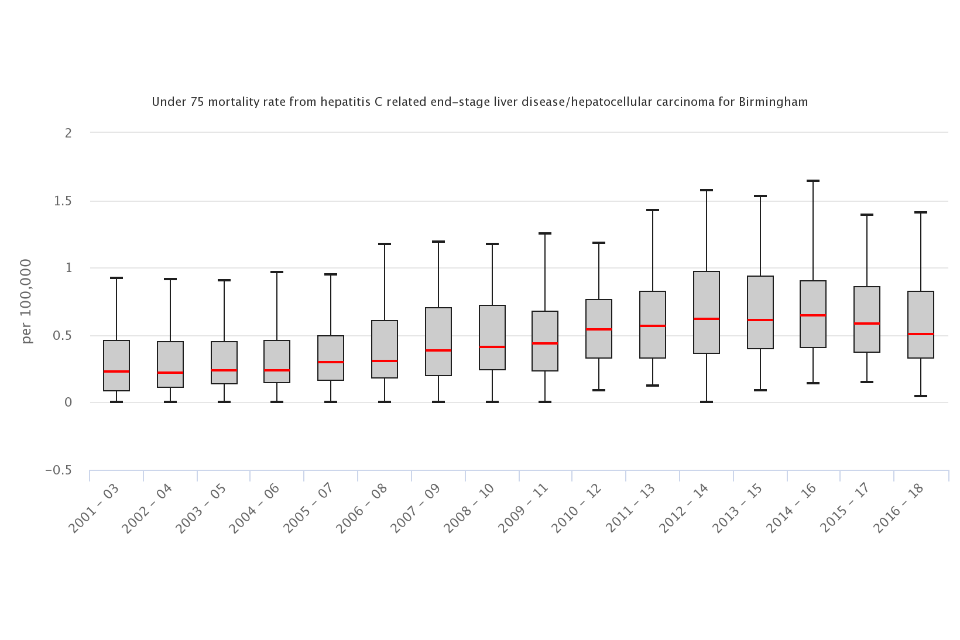
Figure 7: Under 75 mortality rate from hepatitis C related end-stage liver disease/hepatocellular carcinoma, per 100,000 population, England
Across the upper tier local authority areas, Kensington and Chelsea remained with the highest rate of premature mortality from hepatitis C related end-stage liver disease / hepatocellular carcinoma going up from 2.5 in 2015 to 2017 to 2.7 in 2016 to 2018, and per 100,000 people aged under 75. This is significantly worse than the England average.
Premature mortality due to non-alcoholic fatty liver disease
In England in 2016 to 2018, 732 people died due to non-alcoholic fatty liver disease, a rate of 0.48 per 100,000 population aged under 75.
Rates were over 5 times higher in the North West region (1.25 per 100,000 aged under 75) than the West Midlands (0.23 per 100,000 aged under 75).
Across the upper tier local authority areas, St Helens had the highest rate at 4.3 per 100,000 people aged under 75, Lancashire had the highest number of deaths at 57.
Figure 8: Under 75 non- alcoholic fatty liver disease mortality rate, per 100,000 population, upper tier local authorities in the North West region, 2016 to 2018
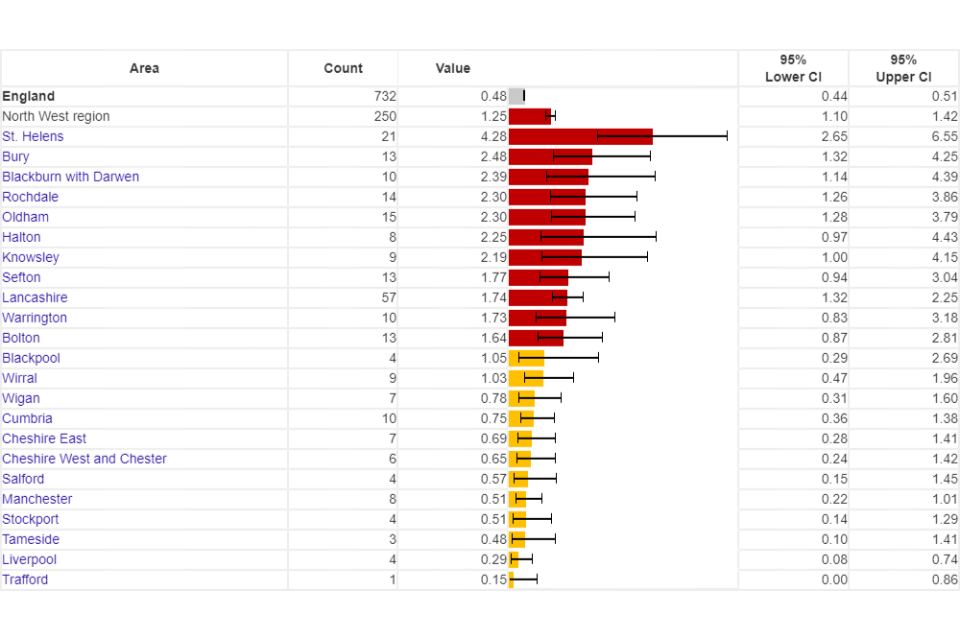
Figure 8: Under 75 non- alcoholic fatty liver disease mortality rate, per 100,000 population, upper tier local authorities in the North West region, 2016 to 2018
Background and further information
Liver disease is almost entirely preventable with the major risk factors: alcohol, obesity and hepatitis B and C accounting for up to 90% of cases.
The liver disease profiles provide an invaluable resource relating to one of the main causes of premature mortality nationally; a disease whose mortality rates are increasing in England, while decreasing in most EU countries. The local authority profiles will support the development of Joint Strategic Needs Assessments and work of health and wellbeing boards presenting local key statistics and highlighting questions to ask locally about current action to prevent liver disease.
The website contains data for upper tier local authorities, former Government Office regions, England and where available lower tier local authorities.
The profiles, aimed at primarily LAPH were developed following recommendations in March 2014 from the All-Party Parliamentary Hepatology Group (APPHG) inquiry into improving outcomes in liver disease. Recommendations the LA profiles aim to address were:
- PHE should address the worrying lack of data on all aspects of liver disease by developing a dataset to allow performance management of liver disease across CCGs, local authorities and health and wellbeing boards
- health and wellbeing boards should monitor early detection, treatment and mortality rates from liver disease; assessing progress on tackling liver disease should be made a mandatory part of the joint strategic planning process for CCGs and local authorities
Further details about the profile methodology are available within the definitions section of the online version of the liver disease profile.
Responsible statistician, product lead: Liz Rolfe, Julia Verne
For queries relating to this document, please contact: liverdisease@phe.gov.uk