Light rail and tram statistics, England: year ending March 2021
Published 23 June 2021
Applies to England

© Crown copyright 2021
This publication is licensed under the terms of the Open Government Licence v3.0 except where otherwise stated. To view this licence, visit nationalarchives.gov.uk/doc/open-government-licence/version/3 or write to the Information Policy Team, The National Archives, Kew, London TW9 4DU, or email: psi@nationalarchives.gov.uk.
Where we have identified any third party copyright information you will need to obtain permission from the copyright holders concerned.
This publication is available at https://www.gov.uk/government/statistics/light-rail-and-tram-statistics-england-year-ending-march-2021/light-rail-and-tram-statistics-england-year-ending-march-2021
About this release
This release presents the latest annual information on light rail and tram systems in England during the financial year ending March 2021. The release covers light rail and tram use, infrastructure, revenue, and passenger experience.
This publication covers 8 urban systems that are predominantly surface-running (see Table 1 for a list of systems covered). Smaller systems (for example, heritage railway and airport transit systems) are not included. London and Glasgow Underground and Edinburgh Trams are also excluded but statistics for these systems are included in the tables.
Comment on Coronavirus (COVID-19) impact
The data covered by this release is for the year ending March 2021, which coincides with the measures implemented from March 2020 onward to limit the impact of the coronavirus (COVID-19) pandemic. Light rail and tram patronage in particular decreased substantially, which is consistent with patronage across other modes. For further information see transport use during the COVID-19 pandemic statistics.
Please refer to the quality report for details regarding the effects of the restrictions on networks.
In the year ending March 2021, light rail and tram use in England decreased by 69.0% from the year ending March 2020, down to 81.7 million passenger journeys.
There were 81.7 million passenger journeys made on the 8 light rail and tram systems in England, a 69.0% decrease (181.7 million passenger journeys) compared with the previous year as a result of the nationwide movement restrictions due to the coronavirus (COVID-19) pandemic. Outside London, passenger journeys decreased by 74.5% to 30.4 million and in London by 64.4% to 51.3 million in the year ending March 2021.
Chart 1: Light rail and tram passenger journeys (millions): England, annually year ending March 1984 to year ending March 2021 - (LRT0101)
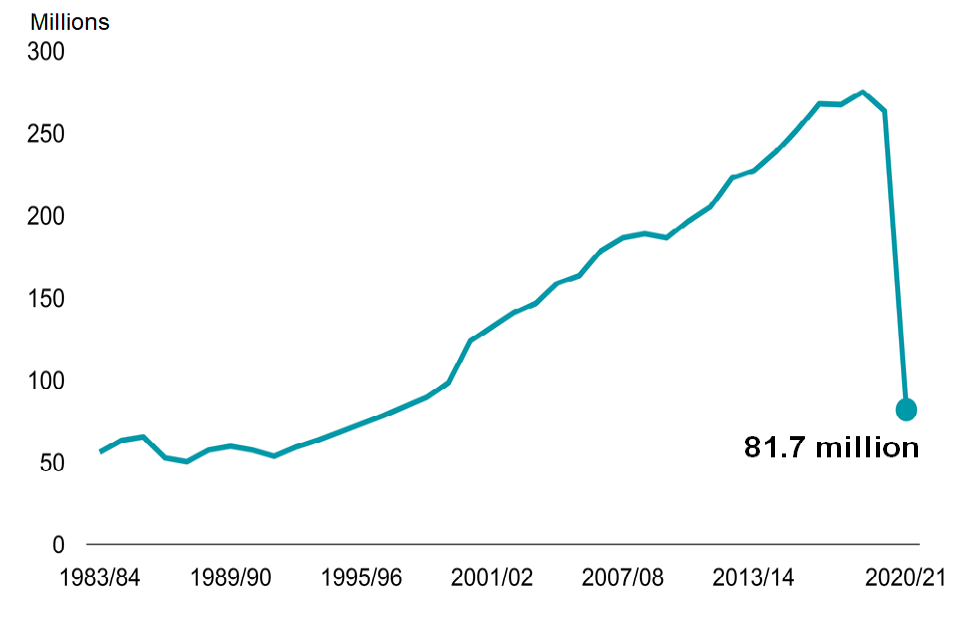
Chart 1: Light rail and tram passenger journeys (millions): England, annually year ending March 1984 to year ending March 2021.
Overview
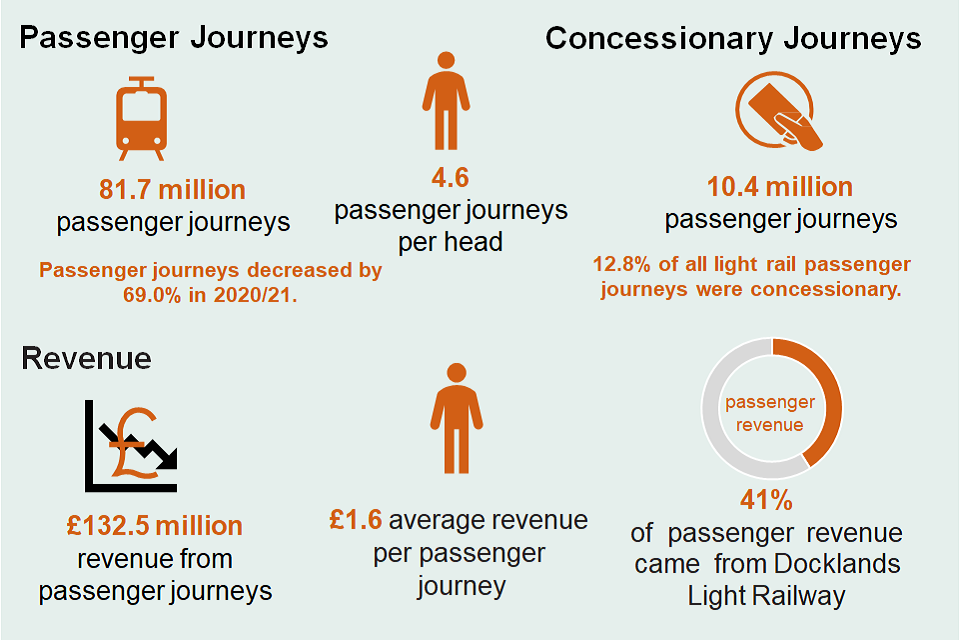
In England, year ending March 2021, 81.7 million passenger journeys, 4.6 per head; 10.4 million concessionary journeys. Gross revenue £132.5 million; average revenue per passenger journey £1.62; 41% came from Docklands Light Railway.
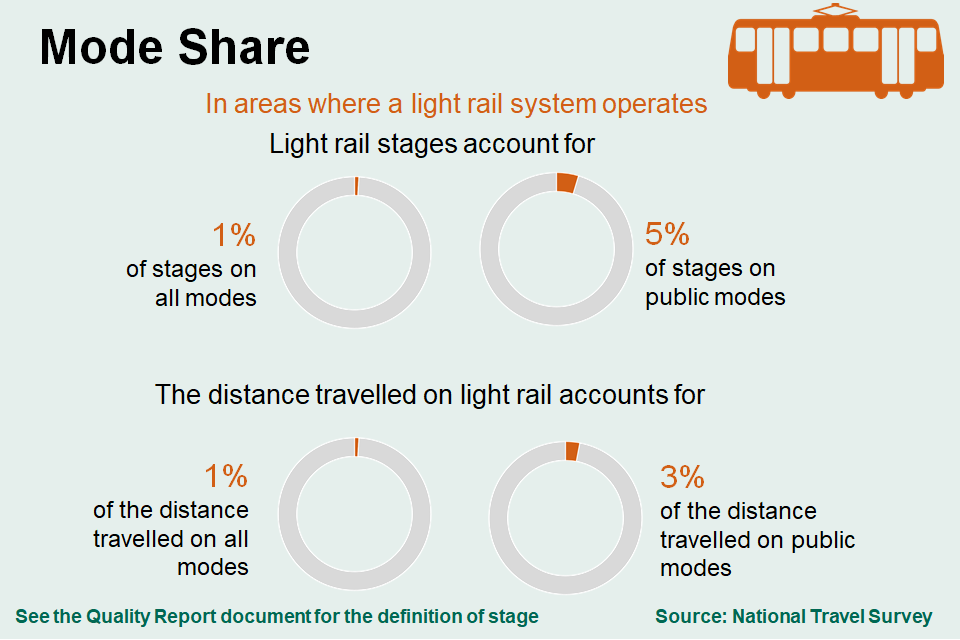
In areas of England where a system operates, light rail stages accounts for 5% of stages on public modes and 1% on all modes; light rail accounts for 3% of the distance travelled on public modes and 1% on all modes.
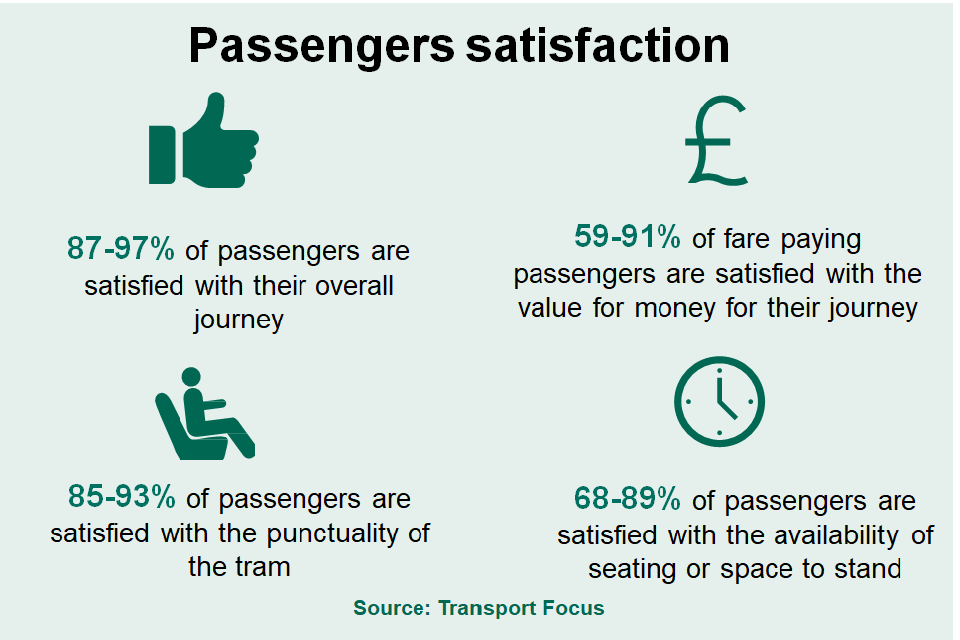
Passengers satisfaction rates - 87% to 97% with their overall journey; 59% to 91% with the value for money; 85% to 93% with trams’ punctuality; 68% to 89% availability of seating or space to stand
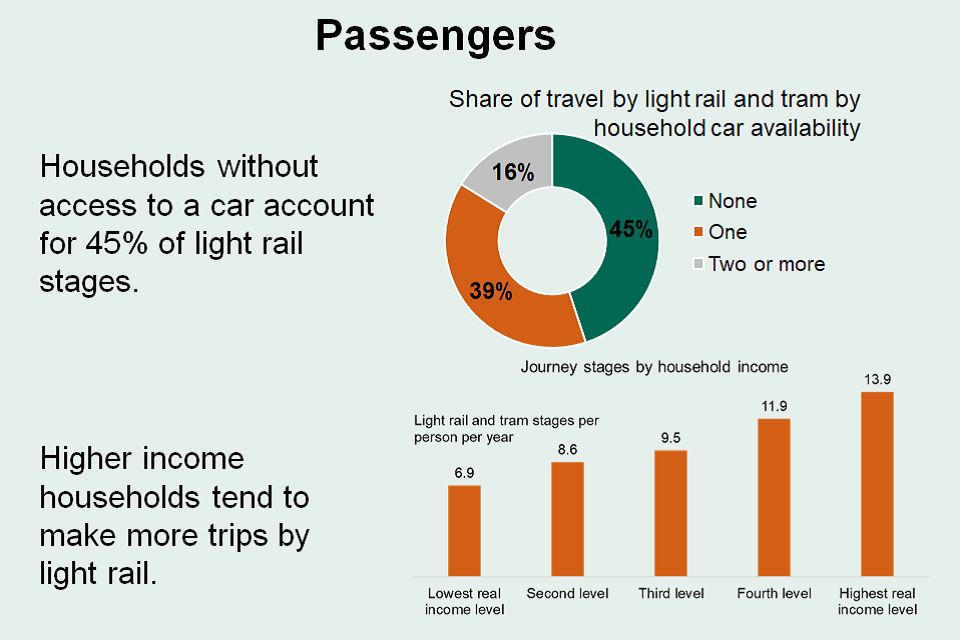
Percentage of journey stages made by household car access: 45% with no car; 39% with one car; 16% with 2 or more cars.
Summary figures
Passenger journeys decreased on all of the 8 light rail systems by between 57.4% (London Tramlink) and 81.8% (Nottingham Trams). Vehicle miles also decreased for all systems, by between 5.1% (London Tramlink) to 58.5% (Blackpool Tramway).
Vehicle mileage decreased at a lower rate than passenger journeys as government provided Light Rail Revenue and Recovery Grant (LRRRG) funding throughout the COVID-19 pandemic to ensure essential service provision for example for NHS staff and other key workers and those attending vaccinations was maintained.
Details of factors impacting on annual figures including the COVID-19 pandemic, planned closures, weather related closures and technical equipment failures can be found in the quality report.
Table 1: Summary of the latest annual light rail and tram figures (year ending March 2021) compared with the previous year (year ending March 2020)
| Passenger | Journeys | Vehicle | miles | Passenger revenue £ | (change in year ending March 2021 prices) | |||
|---|---|---|---|---|---|---|---|---|
| England | 81.7 | -69.0% | 19.4 | -12.9% | 132.5 | -67.2% | ||
| London systems | 51.3 | -64.4% | 5.1 | -11.9% | 65.9 | -67.9% | ||
| Docklands Light Railway | 39.7 | -66.0% | 3.2 | -15.4% | 54.3 | -69.9% | ||
| London Tramlink | 11.6 | -57.4% | 1.9 | -5.1% | 11.5 | -52.6% | ||
| England outside London systems | 30.4 | -74.5% | 14.3 | -13.2% | 66.6 | -66.5% | ||
| Nottingham Trams | 3.4 | -81.8% | 1.8 | -7.2% | 5.4 | -76.5% | ||
| West Midland Metro | 3.4 | -58.3% | 1.1 | -9.8% | 5.8 | -52.1% | ||
| Sheffield Supertram | 2.8 | -73.1% | 1.1 | -30.2% | 6.4 | -56.6% | ||
| Tyne and Wear Metro | 9.4 | -71.6% | 2.6 | -9.8% | 20.4 | -61.8% | ||
| Manchester Metrolink | 10.3 | -76.7% | 7.5 | -5.5% | 26.8 | -69.7% | ||
| Blackpool Tramway | 1.1 | -76.6% | 0.3 | -58.5% | 1.9 | -74.2% |
The average light rail and tram journey was 4.0 miles in England in the year ending March 2021. In London, average journey length was shorter at 3.2 miles, compared to 5.4 miles in England outside of London. These figures fallen slightly compared to the previous year.
The impact of Coronavirus (COVID-19)
The COVID-19 pandemic has had a marked impact on everyday life, including on transport. The chart shows the impact of the pandemic throughout the year on the number of light rail and tram passenger journeys.
The first national lockdown commenced on 23 March 2020 and during the “Stay Home” period in late March and April 2020, only essential workers were allowed to go to their place of work, and travel outside of the home was severely limited.
There was a steep fall in travel on light rail and tram with passenger journeys decreasing on average to 7% in April 2020 and returning to around 49% of pre-pandemic levels in September as restrictions started to ease in summer 2020.
However, the number of passenger journeys declined again in November and early 2021 following the further government measures, resulting in levels of around 28% pre-pandemic levels by the end of the financial year.
Chart 2: Light rail and tram patronage in England, March 2020 to March 2021
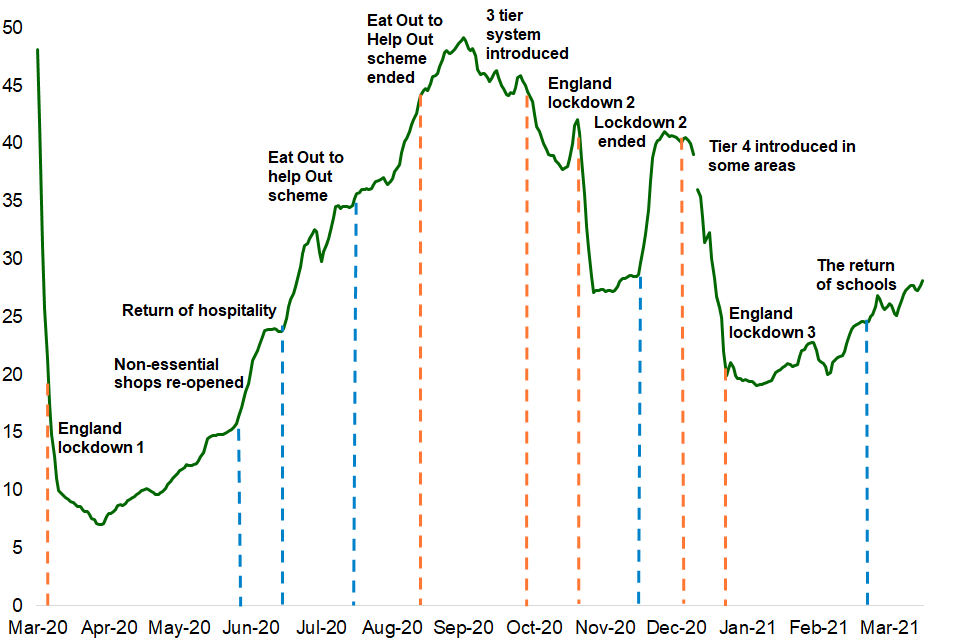
Chart 2: Light rail and tram patronage in England, March 2020 to 2021
Infrastructure
Between the year ending March 2020 and the year ending March 2021, there was an additional 0.2 route miles for Manchester Metrolink and 0.2 route miles fewer for West Midland Metro. The number of carriages and stations stayed the same on all the light rail and tram systems.
Table 2: System summary (year ending March 2021)
| Length of system (miles) | Number of stops | Number of tram vehicles | Average journey length (miles) | |
|---|---|---|---|---|
| England | 219 | 410 | 511 | 4.0 |
| London systems | 41 | 84 | 184 | 3.2 |
| Docklands Light Railway | 24 | 45 | 149 | 3.2 |
| London Tramlink | 17 | 39 | 35 | 3.2 |
| England outside London systems | 178 | 326 | 327 | 5.4 |
| Nottingham Trams | 20 | 50 | 37 | 4.1 |
| West Midland Metro | 14 | 28 | 21 | 6.5 |
| Sheffield Supertram | 21 | 50 | 32 | 4.0 |
| Tyne and Wear Metro | 48 | 60 | 89 | 5.3 |
| Manchester Metrolink | 64 | 99 | 120 | 6.5 |
| Blackpool Tramway | 11 | 39 | 28 | 0.2 |
Map 1: Location of each light rail and tram system in England, year ending March 2021
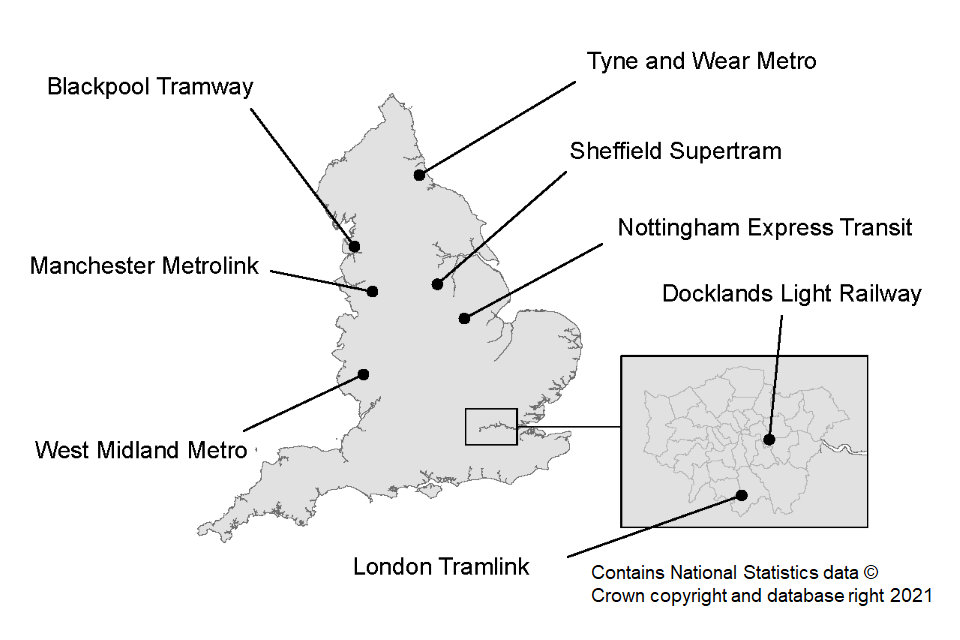
Map 1: Location of each light rail and tram system in England, year ending March 2021
Passenger journeys
In England, in the year ending March 2021, passenger journeys on light rail and tram systems decreased to 81.7 million, a decrease of 69% (181.7 million passenger journeys) when compared with the previous year (Chart 1).
Chart 3: Light rail and tram passenger journeys (millions) by system, England year ending March 2021 - (LRT0101)
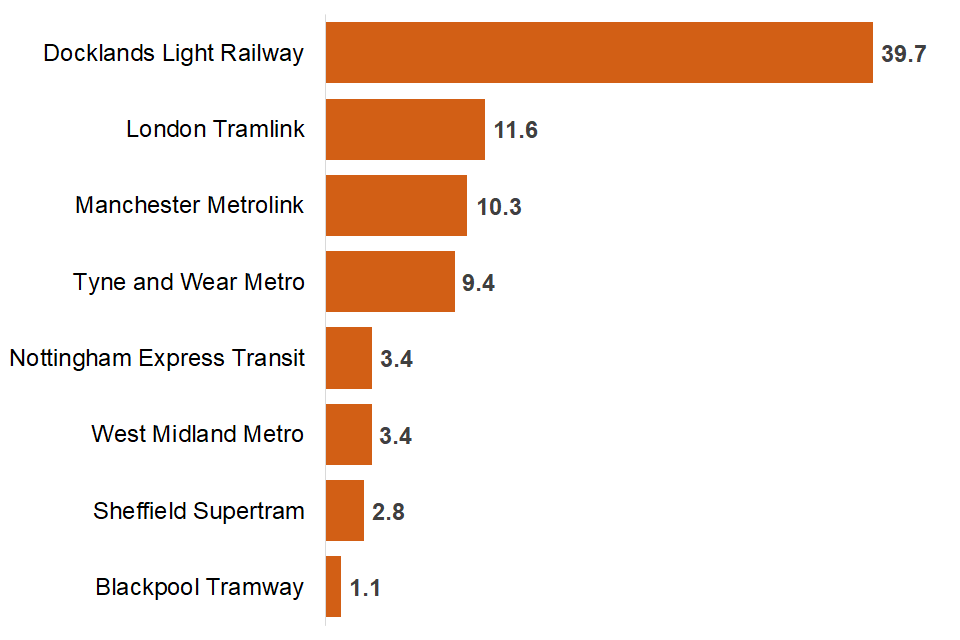
Passenger journeys in millions by system: Docklands Light Railway 39.7, London Tramlink 11.6, Nottingham Express Transit 3.4, West Midlands Metro 3.4, Sheffield Supertram 2.8, Tyne and Wear Metro 9.4, Manchester Metrolink 10.3, Blackpool Tramway 1.1
The average number of light rail and tram journeys per head was 4.6 in the year ending March 2021 compared with 14.9 journeys per head in the year ending March 2020, a 69.2% decrease.
Chart 4: Light rail and tram passenger journeys per head: London and England outside London, annually from year ending March 2010 - (LRT0109)
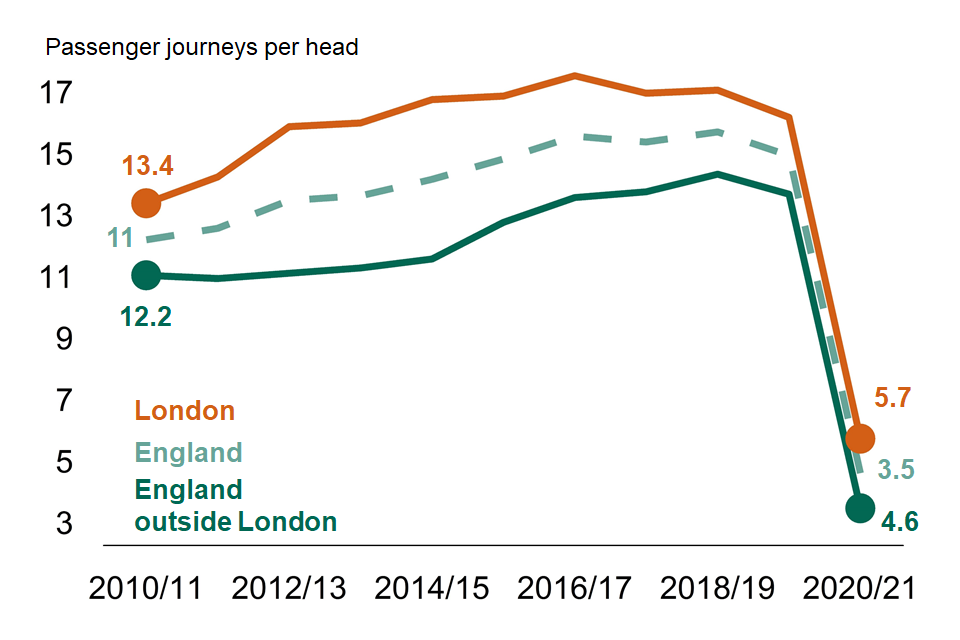
Light rail and tram passenger journeys per head: London and England outside London, annually from year ending March 2010.
Concessionary journeys
In England, in the year ending March 2021, there were 10.4 million concessionary journeys on light rail and tram systems. This is a decrease of 69.2% when compared to the year ending March 2020 figure of 33.8 million.
12.8% of all light rail and tram passenger journeys in England were concessionary, the same as last year. This varies by system from 8% on Blackpool and DLR to 26% on Sheffield Supertram.
Concessionary travel on light rail and trams represents a relatively small proportion of passenger journeys when compared with local bus passenger journeys in England (33%).
Chart 5: Light rail and tram concessionary journeys (millions) by system, England year ending March 2021 - (LRT0101)
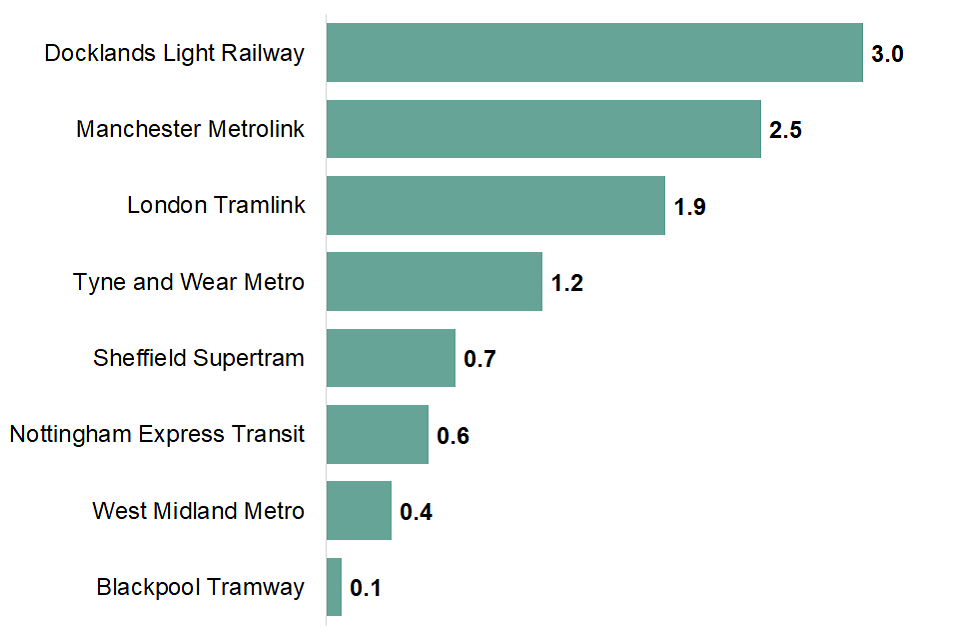
Concessionary journeys in millions by system: Docklands Light Railway 3, London Tramlink 1.9, Nottingham Express Transit 0.6, West Midlands Metro 0.4, Sheffield Supertram 0.7, Tyne and Wear Metro 1.2, Manchester Metrolink 2.5, Blackpool Tramway 0.1
Vehicle mileage
In England, vehicle mileage decreased by 12.9% to 19.4 million miles in the year ending March 2021 compared to the year ending March 2020 (22.3 million miles).
Vehicle miles have fallen less than passenger journeys, reflecting government support to maintain transport services enabling essential journeys such as those made by NHS staff, other key workers, and those attending vaccinations.
Chart 6: Light rail and tram passenger journeys and vehicle miles index: England, annually from year ending March 2011 - (LRT0101) and (LRT0106)
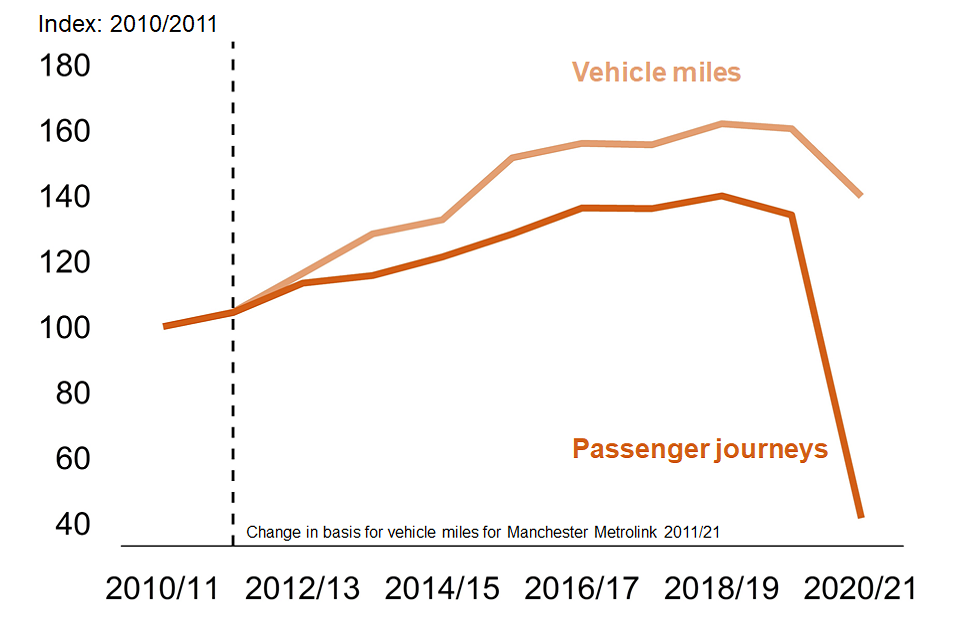
Chart 6: Light rail and tram passenger journeys and vehicle miles index: England, annually from year ending March 2011
In London, vehicle mileage was 5.1 million miles in the year ending March 2021, down 11.9% from the previous year’s figure of 5.7 million miles.
In England outside London, vehicle mileage decreased by 13.2% from 16.5 million miles in the year ending March 2020 to 14.3 million miles in the year ending March 2021.
Chart 7: Light rail and tram vehicle mileage (millions) by system, England (year ending March 2021)
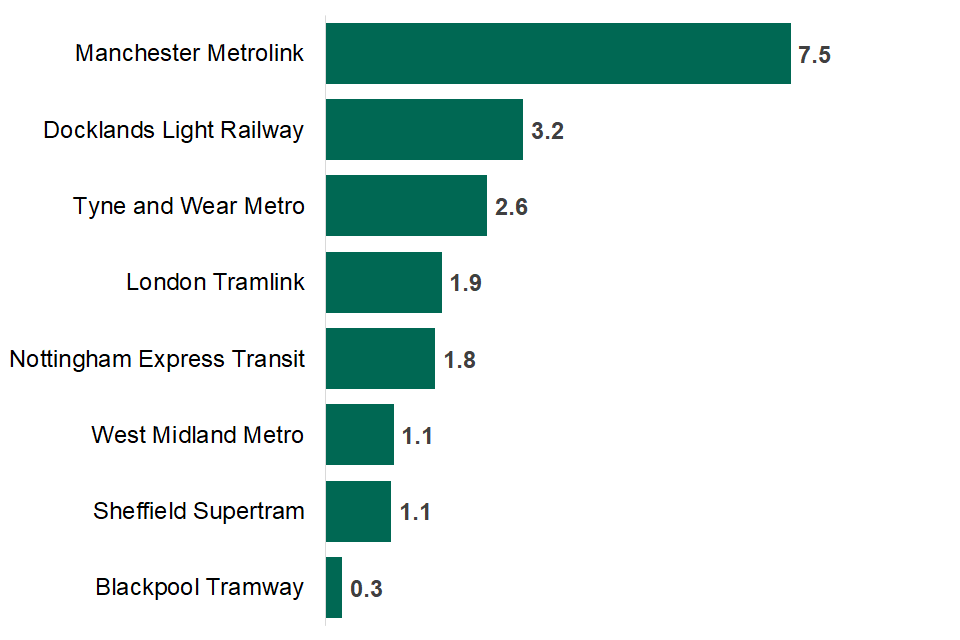
Docklands Light Railway 3.2, London Tramlink 1.9, Nottingham Express Transit 1.8, West Midlands Metro 1.1, Sheffield Supertram 1.1, Tyne and Wear Metro 2.6, Manchester Metrolink 7.5, Blackpool Tramway 0.3
Revenue
Light rail and tram revenue has decreased by 64.9% (in actual prices) from the previous year to £132.5 million in the year ending March 2021. Concessionary revenue decreased by -1.7% (in actual prices) from the previous year to £31.3 million (Chart 8).
Although concessionary reimbursement payments from Travel Concession Authorities were not mandated, most local authorities chose to maintain reimbursement payments at pre-pandemic levels. These payments, along with the LRRRG funding from the Department for Transport, worked together to help ensure the continued operation of light rail services across the country.
Chart 8: Light rail and tram non-concessionary and concessionary revenue index: England, annually from year ending March 2011, at actual prices - (LRT0301a) and (LRT0302a)
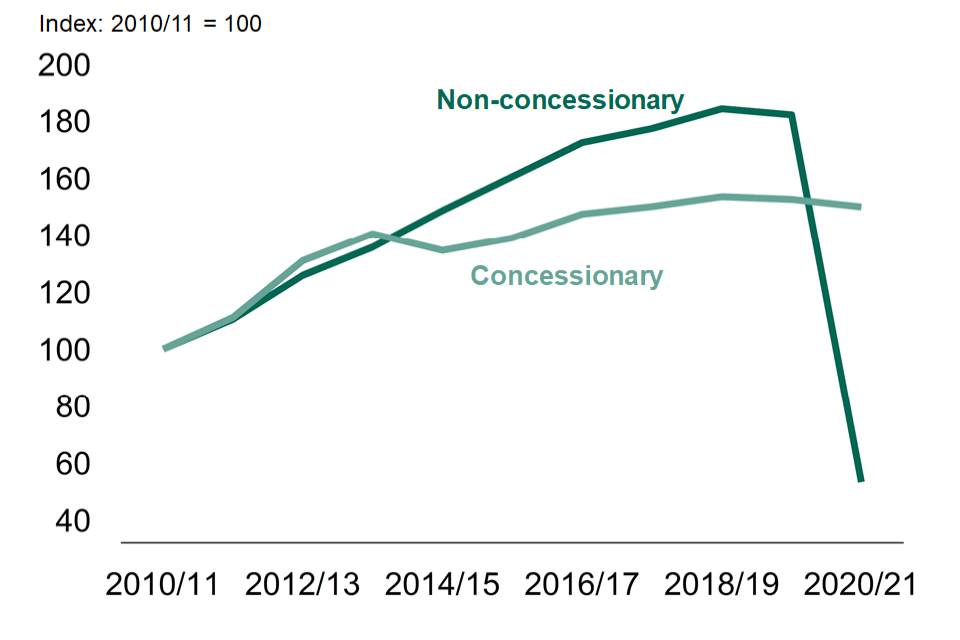
Chart 8: Light rail and tram non-concessionary and concessionary revenue index: England, annually from year ending March 2011, at actual prices.
Light rail and tram passengers, England 2012 to 2019
The National Travel Survey (NTS) gathers data on personal travel behaviour by households in England and can be used to analyse users of light rail and tram systems in areas where such systems exist. Detailed statistics can be found in Table (LRT0401).
The data refer to an 8-year average for 2012 to 2019. Therefore, these travel patterns relate to an earlier year than the other statistics in this release and to a period before the coronavirus restrictions were in place.
Purpose of trip
Commuting, leisure and shopping were the most common purposes for journeys using light rail systems.
In England, 18.6 miles were travelled per person per year for commuting purposes, 10.4 miles for leisure and 7.3 miles for shopping.
Light rail systems are used more for commuting in London than systems in England outside London (54% of stages compared with 30%).
Chart 9: Purpose share of light rail and tram, England 2012 to 2019 - (LRT0401a)
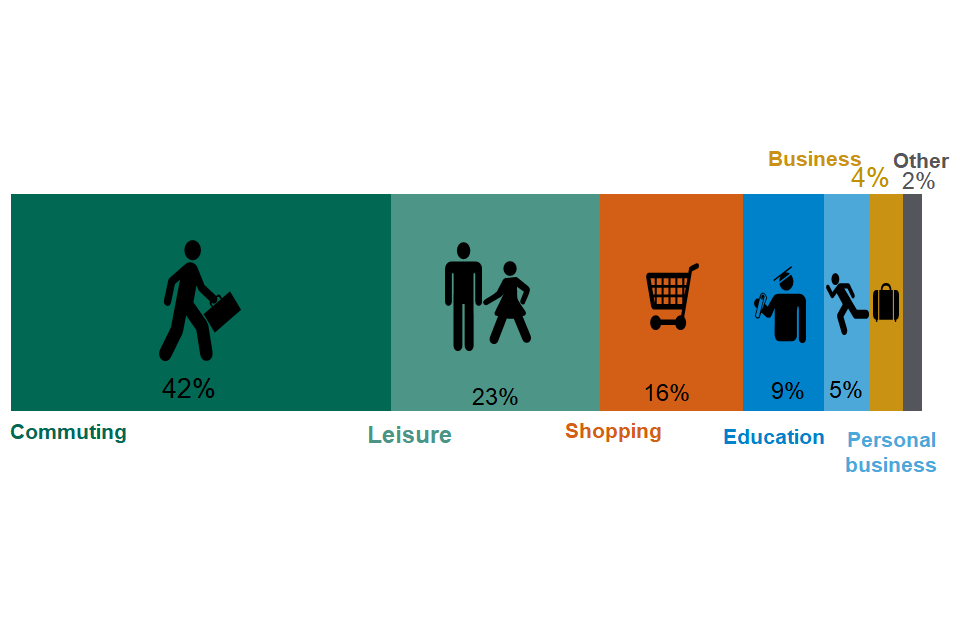
Light rail and tram proportion by purpose; 42% for commuting, 23% for leisure, 16% for shopping, 9% for education, 5% for personal business, 4% for business and 2% for other purposes.
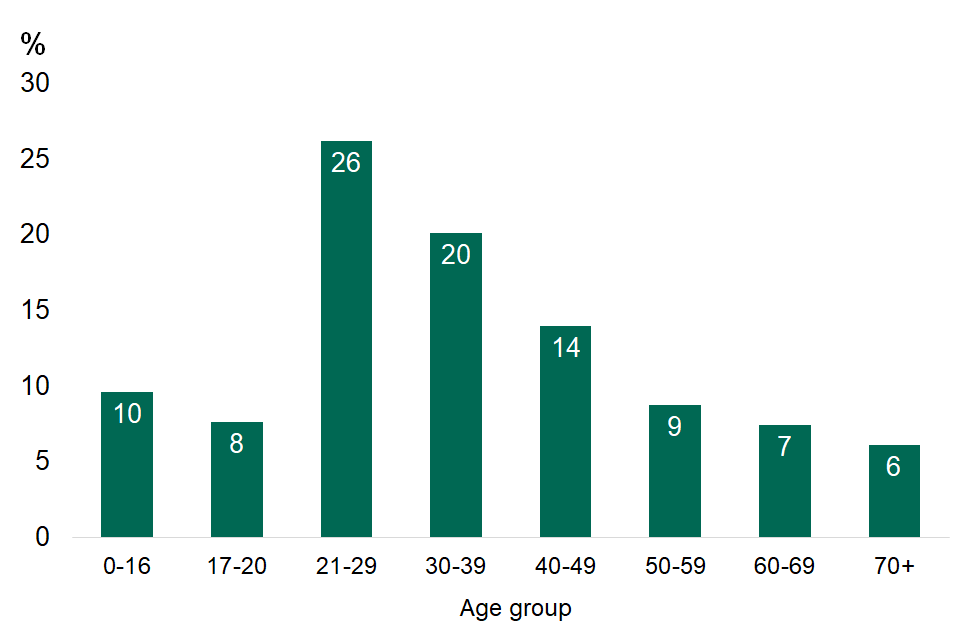
Age and gender
Adults in the 21 to 29 age group made up the largest proportion of all light rail and tram stages (26%), whereas those aged 70 and over account for just 6%.
Chart 10: Light rail and tram stages, distance by age: England, year ending March 2019 - (LRT0401b)
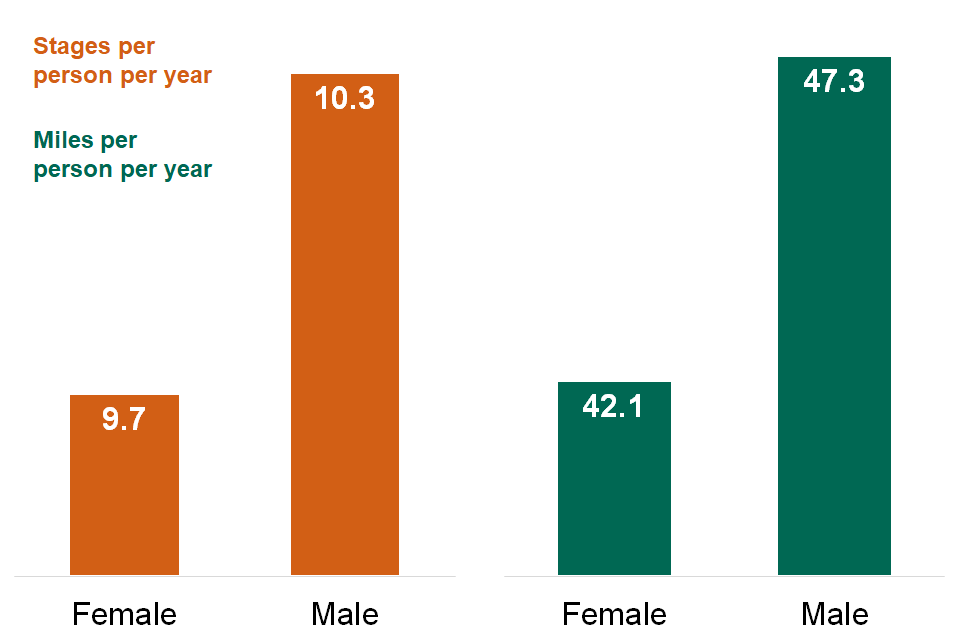
In 2019, on average men made 10.3 light rail stages per person per year, women made 9.7; men travelled 47.3 miles on light rail per person per year, women travelled 42.1 miles
In 2019, on average men made more light rail and tram stages than women (10.3 stages per person per year compared with 9.7 per person per year respectively).
Chart 11: Light rail and tram stages, distance by gender: England, year ending March 2019 - (LRT0401c)
Age group proportion of light rail stages; 10% for 0 to 16 year group, 8% for 17 to 20 age group, 20% for 30 to 39 age group, 14% for 40 to 49 age group, 9% for 50 to 59 age groups, 7% for 60 to 69 age group, 6% for 70 or more age group
Distance travelled
People in areas with light rail and tram systems outside London tend to travel longer distances than those in London when using light rail and tram systems, with 48% of stages being over 5 miles compared to 31% for people in London.
Chart 12: Percentage of light rail and tram stages by stage distance, London, and England outside London - (LRT0401g)
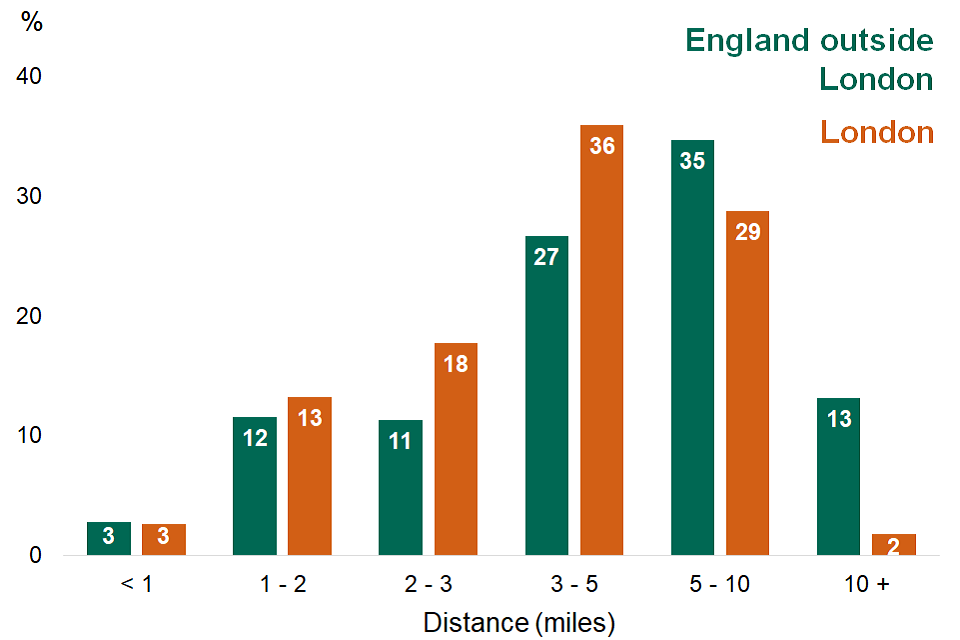
Chart 12: Percentage of light rail and tram stages by stage distance, London, and England outside London.
Time spent
On average people in London spent less time travelling by light rail and tram (194 minutes per person per year) than those in areas with systems areas elsewhere in England (237 minutes per year).
Comparison to other modes
In areas where a system operates, light rail and tram use accounts for around 5% of public transport stages, and around 1% of stages on all modes per person per year.
Light rail and tram use accounts for around 3% of the distance travelled by passengers on public transport, around 4% of time spent on public transport, in areas of England where a system operates.
Passenger satisfaction, 2018 and 2019
Table 3 has been revised since it was originally published to correct an error whereby labels for operators had been swapped (Blackpool Tramway, West Midlands Metro, Sheffield Supertram and Manchester Metrolink) instead of (West Midlands Metro, Sheffield Supertram, Manchester Metrolink and Blackpool Tramway), resulting in satisfaction rates being displayed under the wrong system name. The table now shows the correct system names with their corresponding satisfaction rates.
Transport Focus surveyed passenger experience across Manchester Metrolink and Sheffield Supertram in the winter of 2019. In 2018, Blackpool Tramway and Midland Metro were also surveyed. Table 3 shows the most recent passenger satisfaction data for each of these networks.
Overall satisfaction was between 87% to 97%. Satisfaction remained high across these systems.
Table 3: Summary of passenger satisfaction on specified light rail and tram systems in 2018 and 2019, and the change compared with the previous year.
| Latest data | Overall journey satisfaction | Value for money | Punctuality | |
|---|---|---|---|---|
| Blackpool Tramway | 2018 | 97% | 91% | 93% |
| West Midlands Metro | 2018 | 87% | 71% | 87% |
| Sheffield Supertram | 2019 | 96% | 76% | 89% |
| Manchester Metrolink | 2019 | 87% | 59% | 85% |
Across the last few years, the key factors found to have made light rail and tram journeys great are:
- value for money
- on-tram environment and comfort
- timeliness
- boarding and alighting the tram
- cleanliness and condition of the tram
- smoothness and speed of the tram
Light rail and tram safety
The Office of Rail and Road publish information on passenger injuries on trams, metros, and other non-Network Rail networks in Great Britain. In the year ending March 2020, there were 28 injuries, compared to 45 injuries in the year ending March 2019. This is the lowest number of injuries since the first data published in the year ending March 2006.
The data refer to the year ending March 2020 and therefore the impact of the COVID-19 pandemic measures are considered to be minimal.
Background information
These statistics were designated as National Statistics in February 2013.
National Statistics are produced to high professional standards set out in the Code of Practice for Statistics.
They undergo regular quality assurance reviews to ensure they meet customer needs. Details of ministers and officials who receive pre-release access to these statistics up to 24 hours before release are available.
Further information on data quality, including the methods used to compile these statistics, users and background information about the systems covered can be found in the quality report.
Further information
Responsible statistician: Pat Kilbey
Author: Fouz Saeed
Media: 020 7944 3066
Public: 020 7082 6602
Email: Bus Statistics
Next update
The next light rail and tram statistics release is due to be published in summer 2022.
We are trialling this compact HTML format for our light rail and trams release and we would like to hear your comments. If you have any feedback on our use of this format, please email Bus Statistics.
To hear more about DfT statistics publications as they are released, follow us on Twitter via our @DfTstats account.