Legal aid statistics England and Wales bulletin Jan to Mar 2021
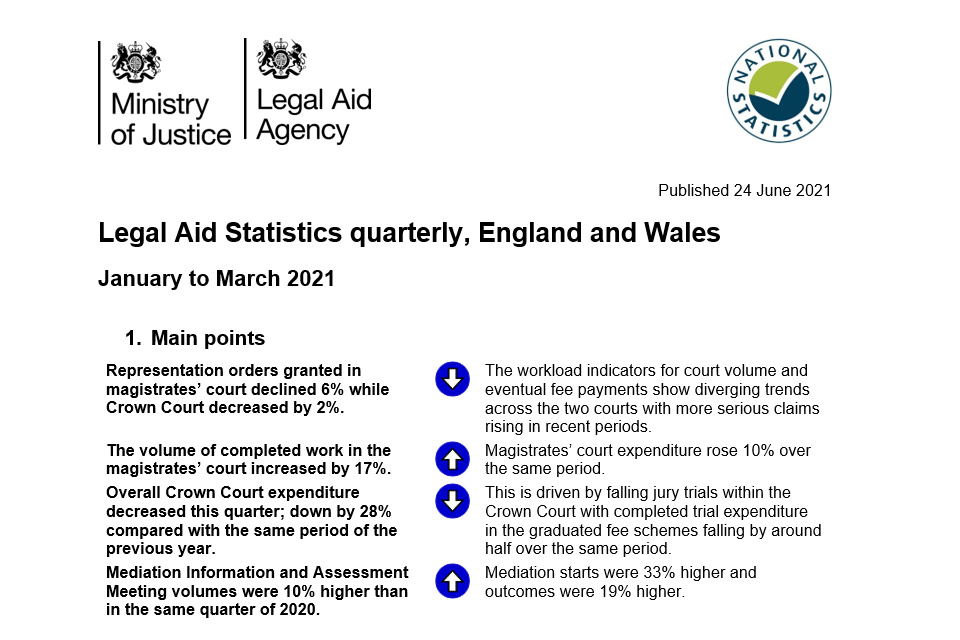
Published 24 June 2021
Applies to England and Wales

© Crown copyright 2021
This publication is licensed under the terms of the Open Government Licence v3.0 except where otherwise stated. To view this licence, visit nationalarchives.gov.uk/doc/open-government-licence/version/3 or write to the Information Policy Team, The National Archives, Kew, London TW9 4DU, or email: psi@nationalarchives.gov.uk.
Where we have identified any third party copyright information you will need to obtain permission from the copyright holders concerned.
This publication is available at https://www.gov.uk/government/statistics/legal-aid-statistics-january-to-march-2021/legal-aid-statistics-england-and-wales-bulletin-jan-to-mar-2021
We are seeking user feedback on the use of HTML for the publication of statistical bulletins. Please send any comments to: statistics@justice.gov.uk.
1. Main Points
Figures for this latest quarter continue to be impacted by the COVID-19 pandemic with courts and other parts of the justice system running a reduced service.
| Representation orders granted in magistrates’ court declined 6% while Crown Court decreased by 2%. | ⬊ | The workload indicators for court volume and eventual fee payments show diverging trends across the two courts with more serious claims rising in recent periods. | ||
| The volume of completed work in the magistrates’ court increased by 17%. | ⬈ | Magistrates’ court expenditure rose 10% over the same period. | ||
| Overall Crown Court expenditure decreased this quarter; down by 28% compared with the same period of the previous year. | ⬊ | This is driven by falling jury trials within the Crown Court with completed trial expenditure in the graduated fee schemes falling by around half over the same period. | ||
| Mediation Information and Assessment Meeting volumes were 10% higher than in the same quarter of 2020. | ⬈ | Mediation starts were 33% higher and outcomes were 19% higher. | ||
| Applications for civil representation supported by evidence of domestic violence or child abuse increased by 5%. | ⬈ | The volume of these granted decreased by 2% compared to the same period of 2020. The proportion of these granted is around 80%. | ||
| 913 applications for Exceptional Case Funding were received in the last quarter. | ⬊ | This is a 7% decrease from the same quarter last year. |
This edition comprises the first release of official statistics for the three-month period from January to March 2021 and the latest statement of all figures for previous periods.
For technical detail, please refer to the User guide to legal aid statistics.
2. Statistician’s Comment
This publication shows that completed workload and the associated expenditure has fallen year on year but has increased over the more recent quarters, due to COVID-19, across the criminal legal aid and civil legal aid schemes.
Criminal legal aid expenditure decreased compared to the same quarter last year in schemes that support the court system, including the magistrates’ and Crown Court. The incoming workload for representation at the courts has almost returned to levels seen in the previous year. Complex trial cases ongoing at the Crown Court are not completing at the same rate as pre-covid due to social distancing measures, and reduced capacity in the courts is impacting upon closed claim expenditure.
Civil legal aid volumes and expenditure show a mixed picture compared to the same quarter last year, but there are increases across some schemes overall since last quarter. Civil representation applications remain slightly lower than last year, and legal help starts and claims remain much lower than last year. Applications for civil representation domestic violence cases have seen the biggest increase since last year, however this is not reflected in the DVCA gateway which remains lower than expected. Mediation workload has increased and now exceeds levels seen previously, and HPCDS volumes are increasing, although they are still well below expected levels.
Section 9 presents provisional figures for April 2021 based on management information. The provisional April 2021 figures show a reversal in the recovery from the impact of COVID-19 in terms of work starting in criminal legal aid, with court representation applications down 15% in the Crown Courts and 8% in magistrates’ courts compared to the average of the previous quarter. Within civil legal aid, both legal help starts and civil representation applications fell in April 2021 compared to the average of the previous quarter. It was expected that criminal and civil legal aid volumes would return to, and even temporarily exceed, historic trend levels and more recent falls could be due to this return to normal levels or impact from further lockdowns.
3. Things you need to know
To understand trends in legal aid as a whole, it is best to begin by looking at annual expenditure figures and then look at trends in both workload and expenditure for each category of legal aid. Summarising activity across the legal aid system meaningfully within a single number is difficult because of the diversity of services included. Expenditure on legal aid is measured differently for different purposes. The three most often-used measures, shown in Figure 1, are:
-
Closed-case expenditure is the measure used for expenditure figures throughout these legal aid statistics. It represents the total value of payments made to legal aid providers in relation to pieces of work that are completed in the period. This basis is comparable to volumes of completed work to which it relates, and to the same fine level of detail. This does not include income received or expenditure in relation to debt write-offs, or interim payments made by the LAA throughout the year for work in progress.
-
RDEL (Resource Departmental Expenditure Limits) nominal is the main budgeting measure used by government to control current spending, both to set budgets for future years and report on how much has been spent. It represents the value of work carried out in the period better than the closed-case measure but cannot be broken down to such a fine level of detail. This measure does incorporate income and expenditure in relation to debt. Nominal here means not adjusted for inflation.
-
RDEL real is the RDEL measure adjusted for inflation to make the value of spending in previous years directly comparable with the specified year.
These measures show a large reduction in legal aid expenditure from around 2010-11, mostly due to changes to the scope of civil legal aid introduced by the Legal Aid, Sentencing and Punishment of Offenders (LASPO) Act from 2013-14, reductions in criminal legal aid workloads and reductions in the fees payable to legal aid providers. Figures for 2020-21 RDEL released once laid before parliament.
Figure 1: Overall annual legal aid expenditure, by closed-case and RDEL nominal and real terms measures (£m), 2005-06 to 2020-21
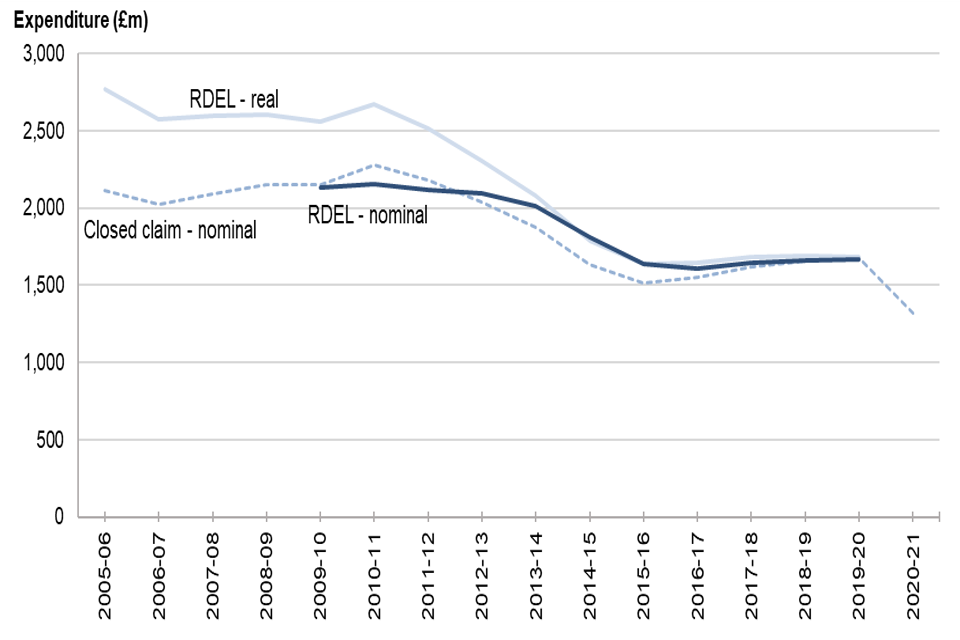
Figure 1: Overall annual legal aid expenditure, by closed-case and RDEL nominal and real terms measures (£m), 2005-06 to 2020-21
A yearly breakdown of the overall annual legal aid expenditure can be found in table 1.0
4. Criminal legal aid
Overall Crown Court expenditure decreased this quarter; down by 28% in January to March 2021 compared with the same period of the previous year. This is driven by a falling volume in the category of completed trials within the Crown Court due to the ongoing pandemic, with completed trial expenditure in the graduated fee schemes falling by around a half over the same period.
Criminal legal aid can be categorised into Crime Lower and Crime Higher.
Crime Lower (covered in tables 2.1 and 2.2) includes police station advice, magistrates’ court and prison law. Table 2.1 provides the Crime Lower workload whereas table 2.2 gives the Crime Lower expenditure.
Crime Higher (covered in tables 4.1 to 4.4) covers work in the Crown and Higher Courts.
Figure 2: Crime overview, closed case volumes and expenditure for January to March 2021, and comparison with January to March 2020
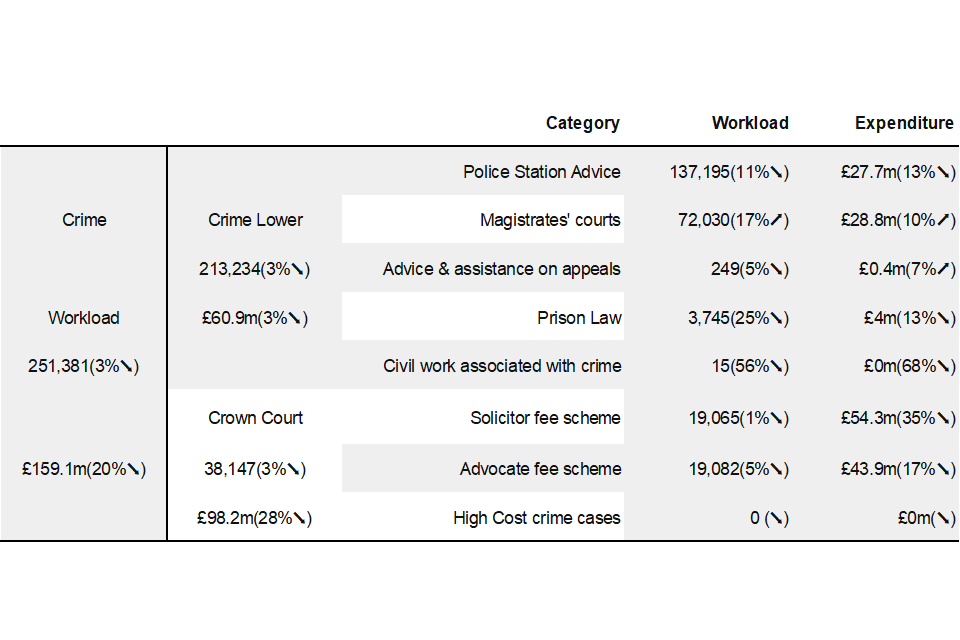
Figure 2: Crime overview, closed case volumes and expenditure for January to March 2021, and comparison with January to March 2020
Although Crown Court work comprises a relatively small portion of criminal legal aid in terms of volume, it usually accounts for around two-thirds of all criminal legal aid expenditure. However, due to the impact on court hearings and the lack of courtroom availability for jury trials this has fallen to around a half of all criminal legal aid expenditure.
Advice relating to the police station makes up the largest portion of workload, but a much smaller proportion of expenditure.
Figure 3a: Workload in criminal legal aid, April to June 2011 to January to March 2021
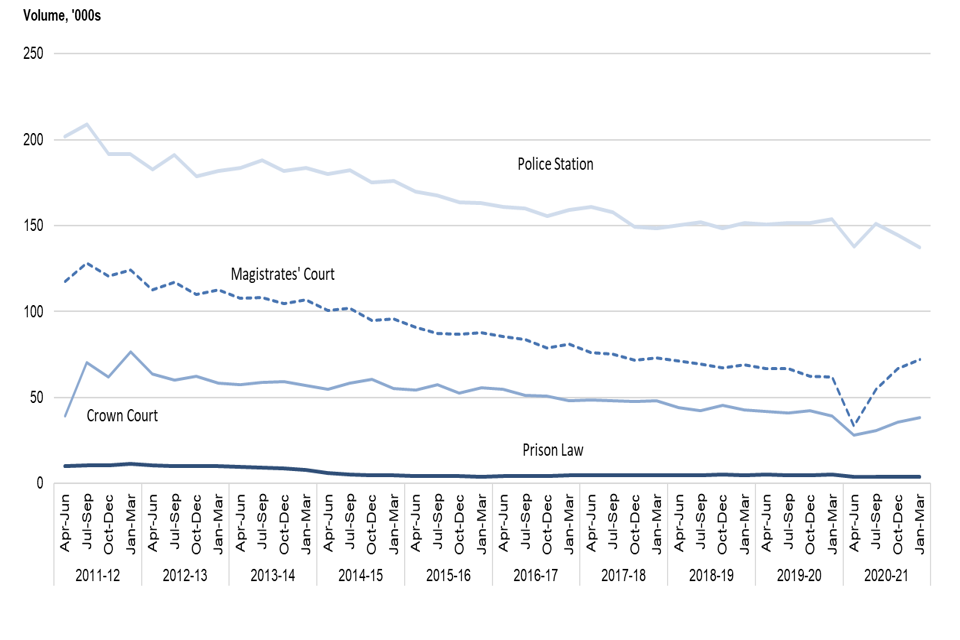
Figure 3a: Workload in criminal legal aid, April to June 2011 to January to March 2021
Figure 3b: Expenditure in criminal legal aid, April to June 2011 to January to March 2021
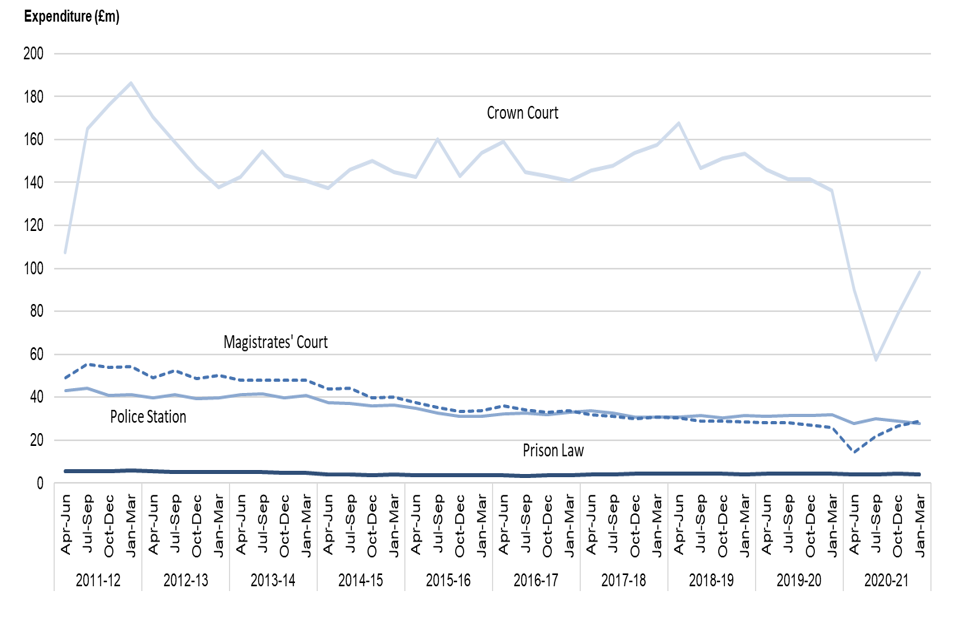
Figure 3b: Expenditure in criminal legal aid, April to June 2011 to January to March 2021
Note: Advice and assistance on appeals and civil work associated with crime are excluded from these figures.
4.1 Police station advice
This category made up almost two thirds of the Crime Lower workload between January and March 2021 but less than half of the expenditure. The workload (covered in table 2.1) in this period has decreased by 11% compared to the previous year, with expenditure (covered in table 2.2) decreasing by 13% (£4.3m). The decrease in police station advice workload since 2013-14 is also seen in arrest statistics for England and Wales[footnote 1] , which has had a similar decline historically.
The majority of the police station advice workload (88% in January and March 2021) consists of suspects receiving legal help with a solicitor in attendance at the police station, with the rest mainly consisting of legal advice over the telephone.
4.2 Applications and grants for representation in the criminal courts
While figures should be interpreted with caution as they may be revised in subsequent quarters as cases move into the Crown court, the number of orders granted for legally-aided representation in the magistrates’ court decreased by 6% this quarter when compared to the same quarter of the previous year. This continues the downward trend of the last 3 years, which has been largely driven by Summary Only cases.
The overall number of receipts[footnote 2] in the magistrates’ courts (covered in tables 3.1) including those not involving legal aid showed a larger decrease (22% down) over the same period with the largest fall (34%) in summary non-motoring offences. The proportion of these applications that are granted remains stable at around 95%.
Orders granted for legally-aided representation in the Crown Court (covered in tables 3.2) also decreased by, to a lesser degree; 2% this quarter compared to last year, comparing to a 1% increase in all Crown Court receipts[footnote 3]. Within the legal aid figure, orders relating to either-way offences decreased by 1%, while those relating to indictable offences increased by 2%. The proportion of Crown Court applications granted remains at almost 100%.
4.3 Magistrates’ court completed work
Legally-aided representation in the magistrates’ courts comprised almost one-third of the workload and almost half of expenditure in Crime Lower between January and March 2021. The volume of completed work (covered in table 2.1) in the magistrates’ courts increased by 17% this quarter when compared to the same period of the previous year. Expenditure (covered in table 2.2) also increased by 10%, reversing the usual trend seen within this predominantly fixed fee claim area.
There are two reasons for this smaller increase in expenditure in comparison to the larger increase seen in volumes and both are due to more work being carried out in less complex fixed fee areas. The first, via the accelerated Criminal legal aid reforms since October 2020, cover payment for work on sending cases to the Crown Court. This new category shown in the tables accompanying this bulletin had almost 10,000 claims costing £2.2m completed this quarter and are expected to increase further. Secondly, there has been rise in the number of sessions being held via the court duty solicitor scheme. This allows a person that has already been charged with an offence to consult with and be represented by a solicitor at the magistrates’ court on their first appearance if they do not have, or have not contacted, their own solicitor.
4.4 Crown Court completed work
Completed work volumes (covered in table 4.1) within the litigator (solicitor) fee scheme decreased by 1% in January to March 2021 compared to the same period of the previous year, this recovery in workload is from extra resource within the HMCTS estate and completion of shorter less complex jury trials from the outstanding backlogs. In the advocate fee scheme, completed claims decreased by 5% compared to the same period last year.
Figure 4a: Workload in the Crown Court, April to June 2011 to January to March 2021
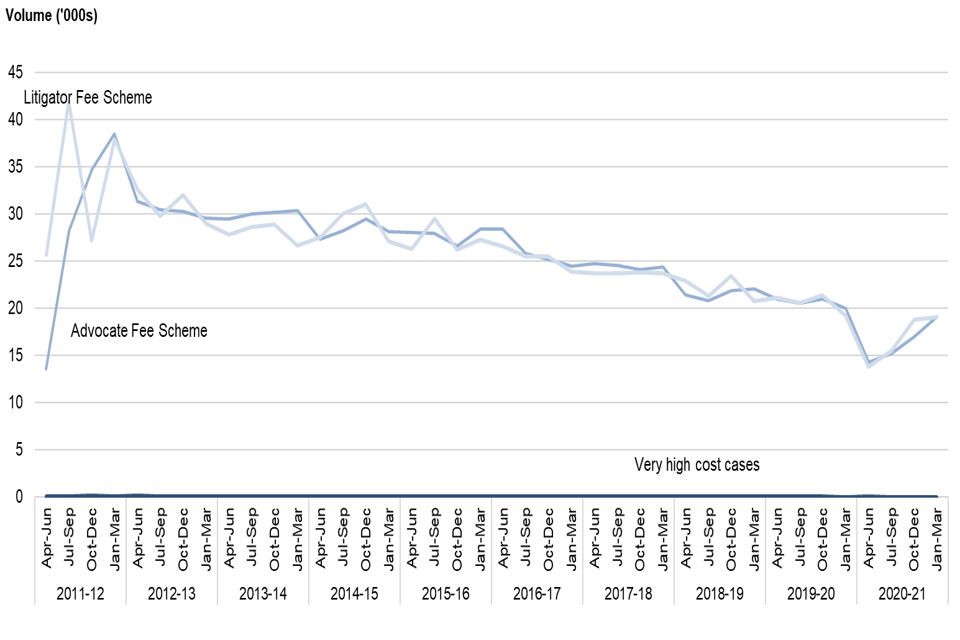
Figure 4a: Workload in the Crown Court, April to June 2011 to January to March 2021
In the litigator fee scheme (covered in table 4.2), expenditure decreased by 35% in January to March 2021 compared to the same period of the previous year. In the advocate fee scheme (covered in table 4.3), the value of payments decreased by 17% compared to the same period of the previous year. Figures for expenditure on work completed in the Crown Court should be interpreted with caution as they may be revised in subsequent quarters as claims are assessed further on appeal and further payments added to the value of some completed claims.
The Very High-Cost Case (VHCC) scheme (covered in table 4.4) covers those Crown Court cases which, if the case were to proceed to trial, would likely last more than 60 days. These cases can span several years and, while they may involve small numbers of defendants, the associated expenditure is high in comparison. There were no defendants represented in the VHCC contracts that concluded in the January to March 2021 quarter. Expenditure on this work over the duration of the contracts (i.e. on the closed-case basis) was therefore also £0m. While workload comprises a tiny proportion of legal aid in the Crown Court overall, the VHCC scheme claims are individually large with over 15% of all expenditure ten years ago coming from VHCC. This has reduced considerably due to reforms with much smaller volumes of cases being processed in this way.
Figure 4b: Expenditure in the Crown Court, April to June 2011 to January to March 2021
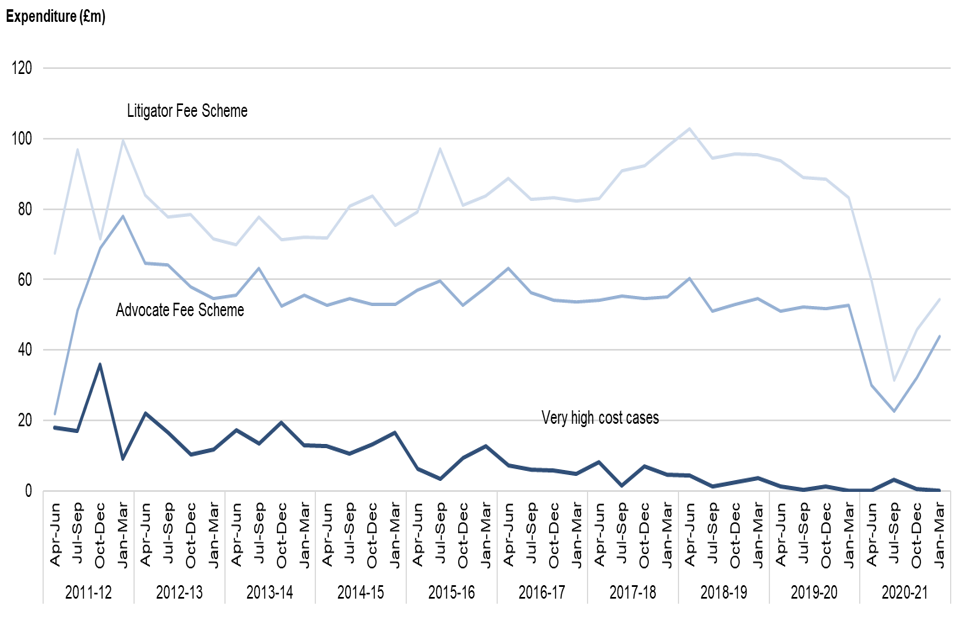
Figure 4b: Expenditure in the Crown Court, April to June 2011 to January to March 2021
The large falls in completed expenditure are a consequence of the large fall in the number of jury trials completing in the Crown Court, as all expenditure across the case will be in the final main bill. Figure 4c below, looking at the litigator fee scheme in isolation but equally applicable to both schemes, shows the impact of falling trials on expenditure – these types of cases are more likely to be impacted as they need more courtroom space and distancing measures and are likely to include witnesses and members of the public in the jury pool. Trial completed expenditure has been more adversely affected than guilty pleas and cracked trials, where a defendant changes their plea before the trial, with litigator fee expenditure much lower. Previously it was more than £60m and it is still only around half of this. A lack of available resources has led to fewer jury trials with a subsequent increase in trials awaiting completion of 53%[footnote 4].
Figure 4c: Litigator Fee Scheme Crown Court workload and expenditure by claim type, April to June 2017 to January to March 2021
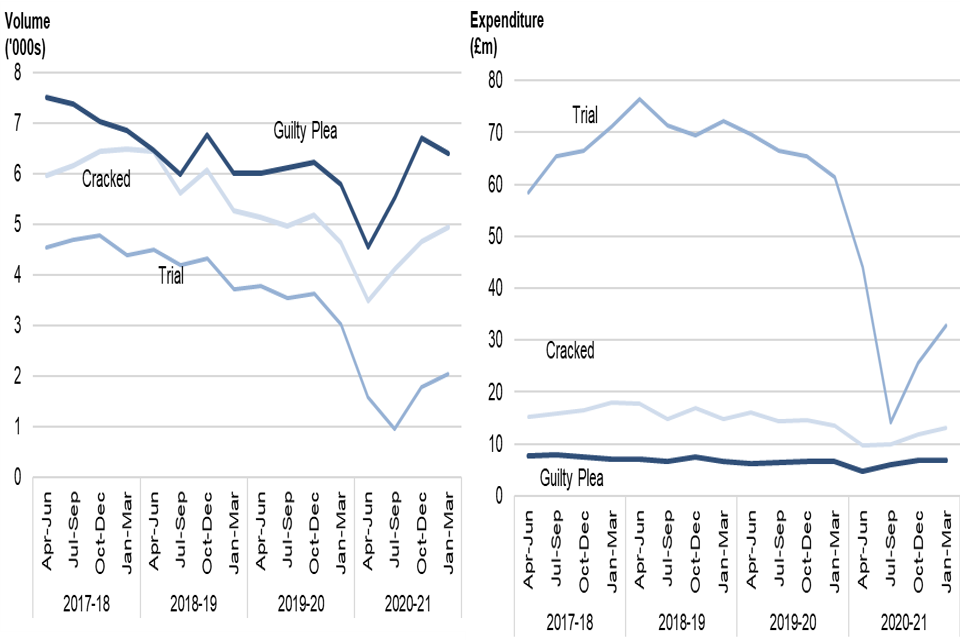
Figure 4c: Litigator Fee Scheme Crown Court workload and expenditure by claim type, April to June 2017 to January to March 2021
4.5 Prison Law
Workload (covered in table 2.1) this quarter decreased by 25% compared with the same period in the previous year, driven by advocacy at prison disciplinary hearings which decreased by 86% compared to last year (see figure 5). This category previously made up over one-third of prison law workload, but this has fallen to less than 10% during this period. This large fall contrasts with increases in workload in both other categories in prison law. Expenditure (covered in table 2.2) on prison law fell by 13% following the overall trend of the quarter (see Figure 5b). This was in part driven by the large fall in prison disciplinary hearings but is due to free standing and advice which fell by 17% when compared to the same quarter last year.
Figure 5a: Prison Law completed workload, April to June 2011 to January to March 2021
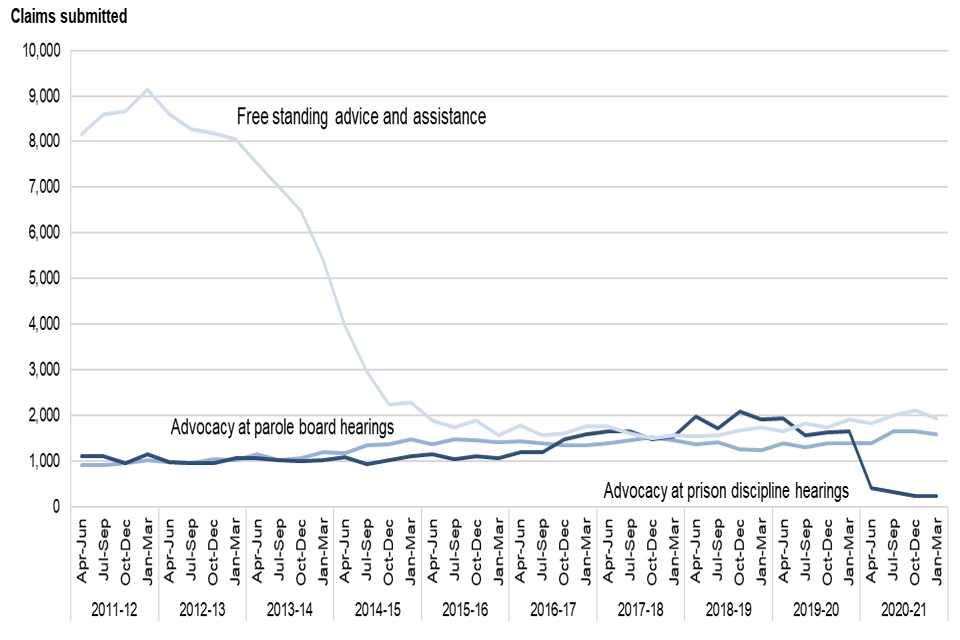
Figure 5a: Prison Law completed workload, April to June 2011 to January to March 2021
Prison Law completed expenditure, April to June 2011 to January to March 2021
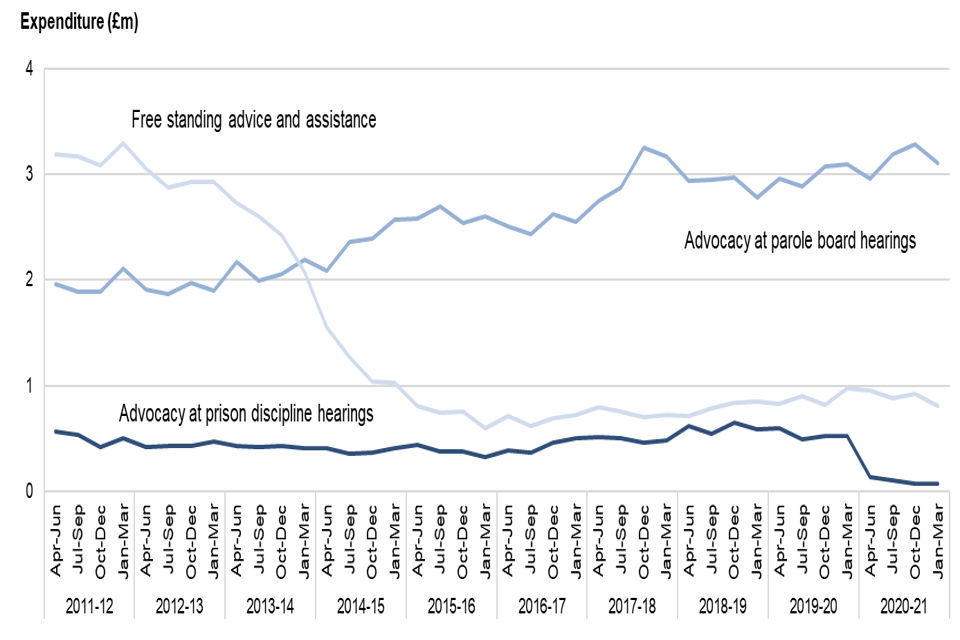
Figure 5b: Prison Law completed expenditure, April to June 2011 to January to March 2021
*New categories not shown: ‘advocacy assistance at sentence reviews’ and ‘advocacy assistance at Parole Board reconsideration hearings’
5. 5. Central Funds
In 2020-2021 the total expenditure for Central Funds was £32m. This is 41% lower than the previous year.
This area includes arrangements to meet costs in a variety of scenarios that are not covered by the main criminal legal aid schemes. Some aspects of these are administered by the Legal Aid Agency (LAA) and others by Her Majesty’s Courts and Tribunals Service. In 2020-2021 the total expenditure for Central Funds was £32m (Figure 6). This is 41% lower than the previous year and largely driven by the reduction in court hearings during the financial year.
Figure 6: Central Funds expenditure, 2015-2016 to 2020-2021
| Financial Year | Defence Costs Orders | Interpreter and translation | Vulnerable Witness (s.38) | Other* | Total |
|---|---|---|---|---|---|
| 2015-16 | 14.08 | 10.74 | 11.72 | 13.06 | 49.6 |
| 2016-17 | 10.28 | 11.09 | 14.75 | 9.23 | 45.35 |
| 2017-18 | 9.37 | 12.53 | 14.72 | 11.16 | 47.78 |
| 2018-19 | 8.43 | 12.62 | 16.17 | 12.35 | 49.57 |
| 2019-20 | 7.18 | 12.86 | 14.85 | 19.43 | 54.32 |
| 2020-21 | 4.50 | 9.40 | 9.10 | 9.12 | 32.12 |
*Other includes intermediaries, private prosecutions and costs of attending magistrates’ court for witnesses, experts and defendants
A large category of expenditure (£4.5m in 2020-2021 relates to the reimbursement of defendants who have been acquitted after privately funding their defence lawyers. The process for assessing and authorising reimbursement of costs from central funds in this scenario is normally triggered when a judge grants a Defence Cost Order (DCO) for legal aid at magistrates’, Crown or higher courts.
Another sizeable area of Central Funds expenditure (£9.1m in 2020-2021) covers the costs of lawyers required where a defendant is unrepresented but where the court decides that the defendant must not themselves be allowed to cross-examine a vulnerable witness, with cases involving domestic violence being typical. This situation is covered by the terms of section 38 of the Youth Justice and Criminal Evidence Act 1999. The costs of interpreters and translators in court comprise another area of Central Funds expenditure (£9.4m in 2020-2021). The remainder of Central Funds expenditure goes to meet the costs of court intermediaries (£4.1m in 2020-2021) and successful private prosecutions (£4.4m in 2020-2021) and towards meeting some of the reasonable costs of attending magistrates’ court for witnesses, experts and defendants (£0.6m in 2020-2021).
6. Civil legal aid
Overall civil legal aid expenditure returned to pre-pandemic levels in the latest quarter.
This was driven by increases in expenditure in civil representation closed cases. Legal help expenditure remains well below expected levels, having fallen by 20% compared to the same period last year. Mediation assessments and outcomes continue to rise.
Civil legal aid can be categorised by area of law into family and non-family. The category of family legal aid covers all work on both private and public family law and includes work associated with the Children Act, domestic abuse, financial provision and family mediation. Non-family legal aid encompasses all work related to immigration, mental health, housing and other non-family law.
Figure 7: Civil overview, closed case volumes and expenditure for January to March 2021, and comparison with January to March 2020
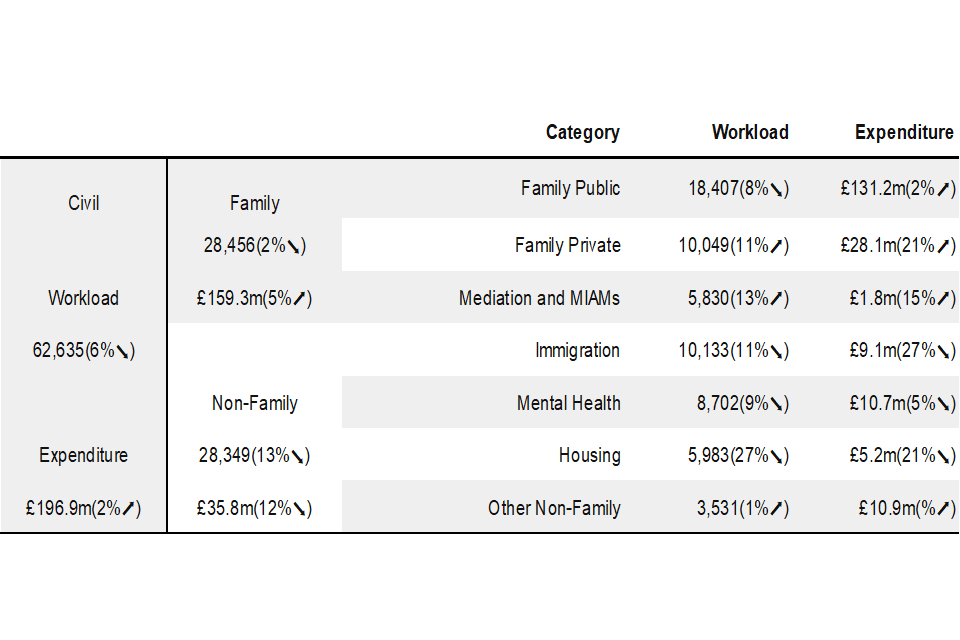
Figure 7: Civil overview, closed case volumes and expenditure for January to March 2021, and comparison with January to March 2020
Although workload for family and non-family law cases are similar, non-family comprises a relatively small proportion of civil legal aid expenditure. Public family legal aid makes up two thirds of family legal aid work and over 80% of expenditure.
6.1 Inquests
Inquest data is available quarterly in our detailed civil data file. Legal help is available for advice and assistance in the run-up to an inquest involving a member of the individual’s family –this can cover preparatory work associated with the inquest, such as submissions to the coroner setting out questions the family wishes the coroner to raise. Legal aid for representation at an inquest is only available through Exceptional Case Funding (ECF). Figure 8 shows that inquests had been increasing in both legal help and civil representation between 2013-14 and 2019-20. In 2020-21 legally aided inquests fell by 15% compared to the same period the previous year, with a 40% decrease in associated costs. This reflects decreases seen across civil legal aid schemes in the last year, particularly within legal help.
Figure 8: Inquests, closed case volumes and costs met by the LAA for 2013-2014 to 2020-21
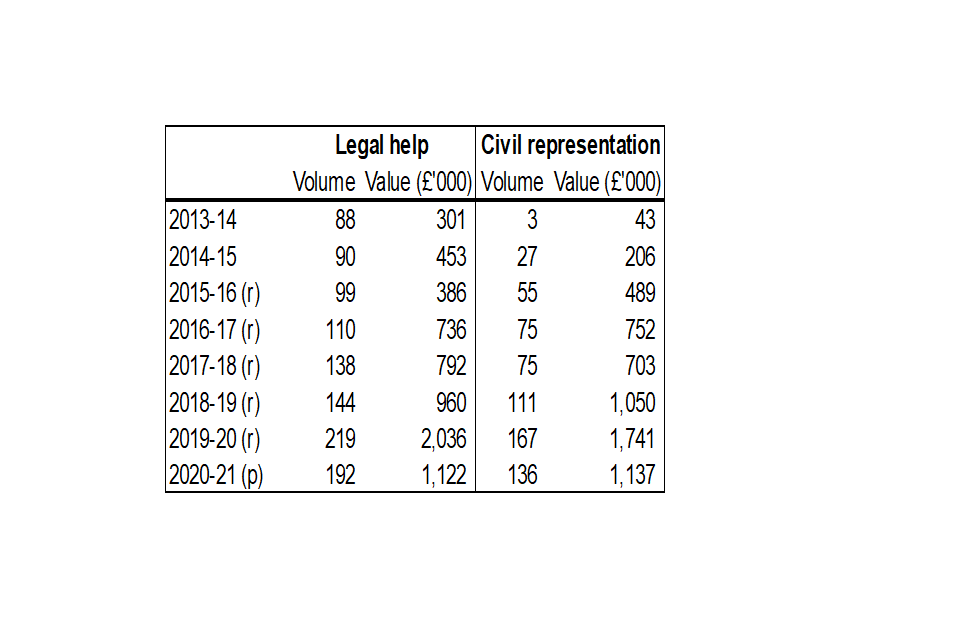
Figure 8: Inquests, closed case volumes and costs met by the LAA for 2013-2014 to 2020-21
(r) Revised from previous published figures (p) Data in the most recent period is provisional and is likely to change in the next release
6.2 Legal help and controlled legal representation
In the last quarter, there was an 8% decrease in legal help new matter starts (covered in table 5.1) than in the same period of 2020. The volume of completed claims (covered in table 5.2) decreased by 12% and expenditure (covered in table 5.3) decreased by 19% in January to March 2021 compared to the same period in 2020 (Figures 9a and 9b). The implementation of the LASPO Act in April 2013 resulted in large reductions in legal help workload, with the overall trend falling to less than one-third of pre-LASPO levels.
Figure 9a: Completed workload in legal help and controlled legal representation, April to June 2011 to January to March 2021
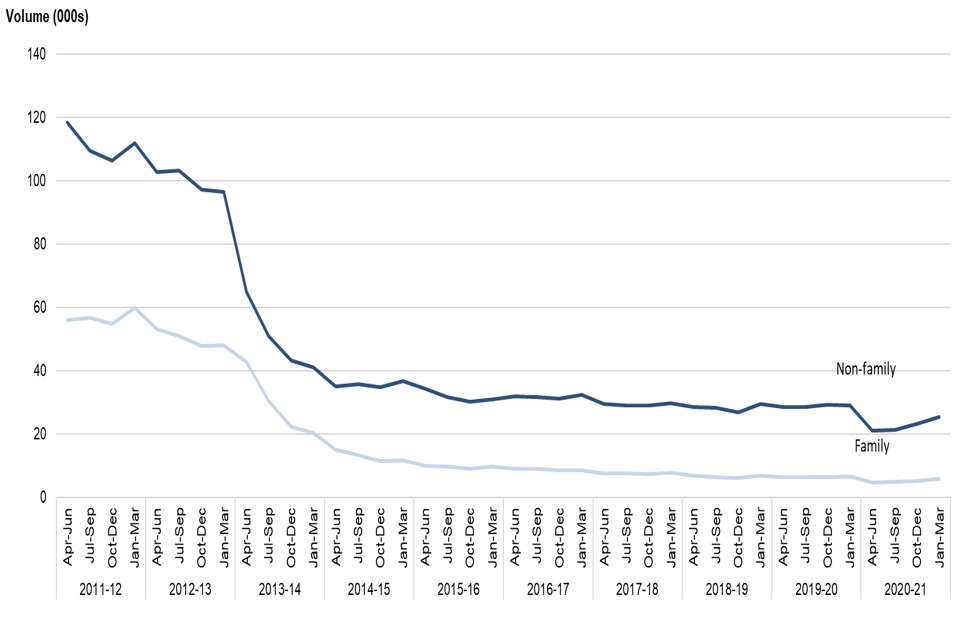
Figure 9a: Completed workload in legal help and controlled legal representation, April to June 2011 to January to March 2021
Figure 9b: Completed workload expenditure in legal help and controlled legal representation, April to June 2011 to January to March 2021
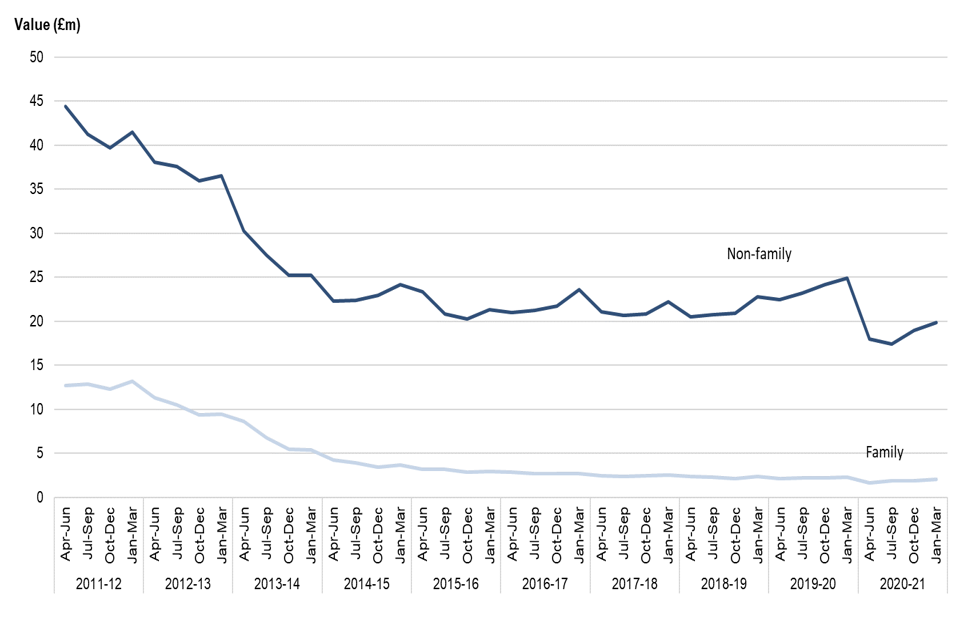
Figure 9b: Completed workload expenditure in legal help and controlled legal representation, April to June 2011 to January to March 2021
6.3 Family legal help
In January to March 2021 family legal help starts (covered in table 5.1) increased by 1% compared to the same quarter last year. Completed claims (covered in table 5.2) decreased by 10% and expenditure (covered in table 5.3) decreased by 11%. There was a steep decline immediately following the implementation of LASPO Act in April 2013, with a more gradual decline over the last 2 to 3 years.
Family mediation involves an independent and impartial professionally accredited mediator discussing problems with a divorcing or separating couple in an attempt to reach agreement without using the courts. A Mediation Information and Assessment Meeting (MIAMs) is an initial meeting between one or both parties and a mediator to see if family mediation could be used to resolve the issue. MIAMs (covered in table 7.1) increased by 10% in the last quarter compared to the previous year and currently stand at just over a third of pre-LASPO levels (Figure 10). Family mediation starts (covered along with outcomes in table 7.2) increased by 33% and total outcomes increased by 19%, of which 62% were successful agreements, and are now sitting at around two thirds of pre-LASPO levels.
Figure 10: Family mediation assessments, starts and agreements, April to June 2011 to January to March 2021
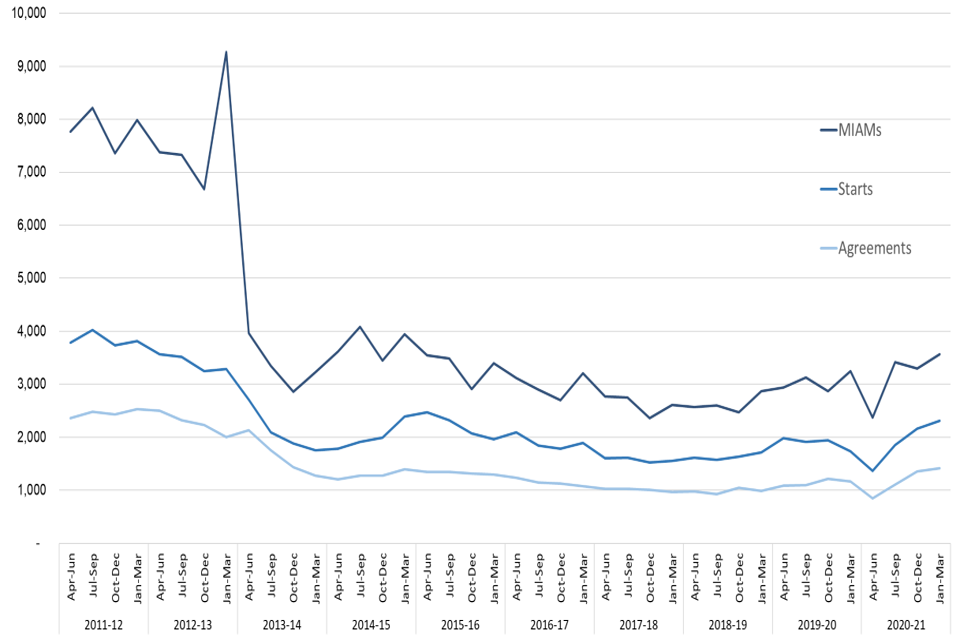
Figure 10: Family mediation assessments, starts and agreements, April to June 2011 to January to March 2021
6.4 Non-family legal help and controlled legal representation
Controlled legal representation relates to representation at tribunal, but unlike civil representation, the decision on whether to grant legal aid is delegated to providers. Legal help and controlled legal representation make up over 95% of both immigration and mental health legal aid cases.
The LASPO Act 2013 made changes to the scope of legal aid for immigration law, but some areas remained in scope. Workload that remains in the immigration category consists largely of asylum-related work. Having fallen by 40% over the 5 years to 2013-14, new matter starts (covered in table 5.1) in immigration decreased by 20% in January to March 2021 compared to the same quarter of the previous year. Completed claims (covered in table 5.2) in immigration decreased by 12% in the last quarter compared to the previous year and expenditure (covered in table 5.3) decreased by 28%.
Within mental health, most funding is spent on providing assistance to sectioned clients appealing the terms of their detention before a mental health tribunal. Mental health new matter starts (covered in table 5.1) decreased by 3% when comparing the latest quarter to the previous year. Completed claims (covered in table 5.2) decreased by 10% and expenditure (covered in table 5.3) decreased by 16% over the same period.
Over 80% of legal aid housing work volume is made up of legal help. The volume of legally-aided housing work halved between July to September 2012 and July to September 2013. The trend then fluctuated for around 18 months but since 2014 it has been falling. In January to March 2021 there was a 16% decrease in housing work starts (covered in table 5.1) compared to the same quarter the previous year. There were also decreases in completed claims (25%) and expenditure (18%). Claims and expenditure are covered in tables 5.2 and 5.3 respectively.
6.5 Civil representation
The number of civil representation certificates (covered in table 6.2) granted in the last quarter decreased by 8% compared to the same period of the previous year. The number of certificates completed (covered in table 6.3) decreased by 2%, and the associated expenditure (covered in table 6.5) increased by 5% over the same period (Figures 11a and 11b). Civil representation workloads fell following the implementation of the LASPO Act in April 2013 but by a smaller proportion than legal help and controlled legal representation.
Figure 11a: Completed workload in civil representation, April to June 2011 to January to March 2021
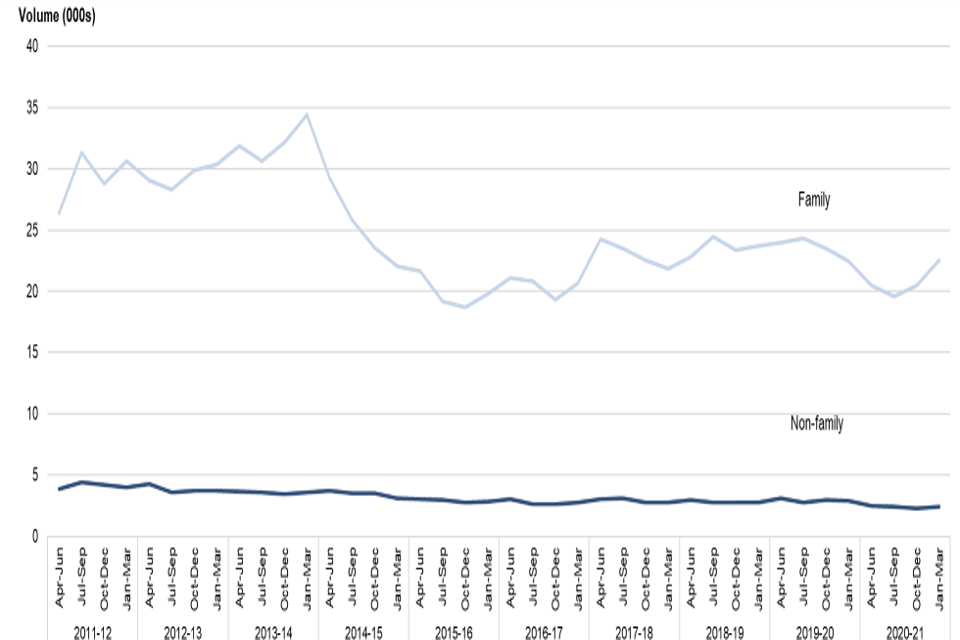
Figure 11a: Completed workload in civil representation, April to June 2011 to January to March 2021
Figure 11b: Completed workload expenditure in civil representation, April to June 2011 to January to March 2021
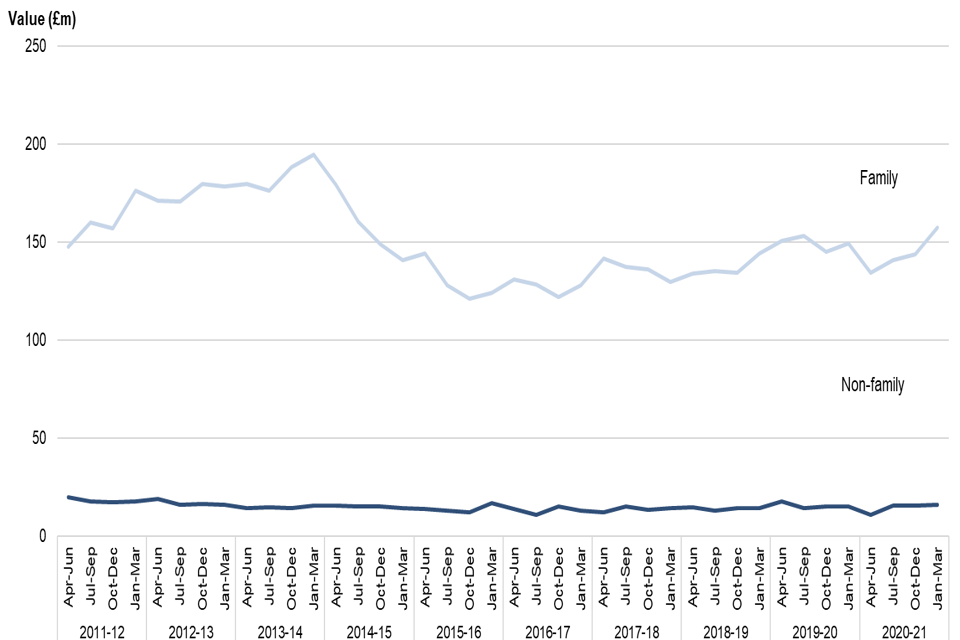
Figure 11b: Completed workload expenditure in civil representation, April to June 2011 to January to March 2021
6.6 Non-Family Civil Representation
Non-family certificates completed make up 12% of the total civil representation workload and 9% of the expenditure. There are only a small number of immigration and mental health cases in civil representation as most work in these areas consists of controlled legal representation. The majority of certificates completed in this category are for housing work. In the latest period completed certificates (covered in table 6.3) decreased by 34% compared to the same period of the previous year.
6.7 Family civil representation
Certificates granted (covered in table 6.2) for family work decreased by 5% in January to March 2021 compared to the previous year. Certificates completed (covered in table 6.3) remained unchanged compared to the same quarter the previous year. The associated expenditure (covered in table 6.5) has increased by 5% compared to the same quarter the previous year.
While civil representation for public family law remains available, the LASPO Act removed legal aid for most private family law including issues such as contact or divorce. However, legal aid remains available for such cases where there is a risk of domestic violence or child abuse. In January to March 2021, applications for civil representation supported by evidence of domestic violence or child abuse (covered in table 6.8) increased by 5% compared to the same period of the previous year. The total number of these granted (also covered in table 6.3) decreased by 2% over the same period (Figure 12). The proportion of applications granted remained steady at around 70% from the inception of this type of application until the end of 2015, before increasing to around 80%. The provisional figure for the latest quarter is 85%.
Figure 12: Applications received and certificates granted via the domestic violence and child abuse gateway, April to June 2013 to January to March 2021
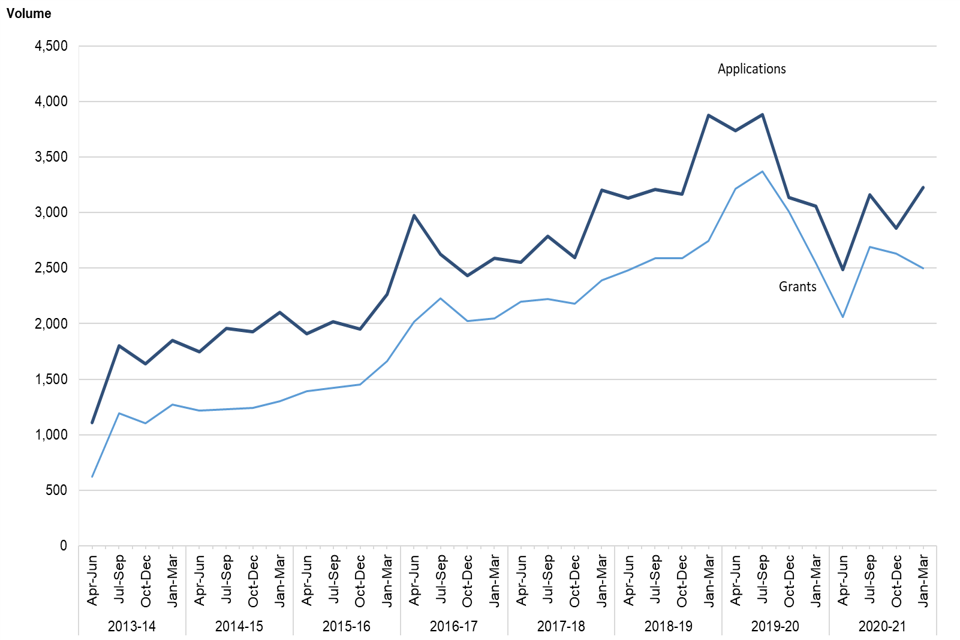
Figure 12: Applications received, and total certificates granted via the domestic violence and child abuse gateway, April to June 2013 to January to March 2021
6.8 Judicial reviews
Of all civil representation applications granted, around 3,000 a year relate to judicial review; 690 in the last quarter. The number granted in January to March 2021 decreased by 5% compared with the same quarter in 2020. Almost two thirds of judicial reviews were for public law and 14% were for immigration cases. Judicial review data is available in the detailed csv accompanying this bulletin.
6.9 Exceptional Case Funding (ECF)
The Exceptional Case Funding (ECF) scheme was introduced as part of LASPO. An ECF application for civil legal services is made where a case falls outside the scope of civil legal aid but the client or conducting solicitor believes failure to provide funding would be a breach of the Human Rights Act 1998.
There were 913 applications (covered along with its current status, details and determination or outcome is provided in table 8.1) for ECF received from January to March 2021. This is a 7% decrease from the same quarter last year. 861 (94%) of these were new applications. Among the ECF applications received between January and March 2021, immigration (68%), inquest (9%), and family (14%) remained the most requested categories of law (Figure 13). A breakdown of ECF applications and grants by category of law is provided in table 8.2
Figure 13: Volume of ECF applications received, April to June 2014 to January to March 2021
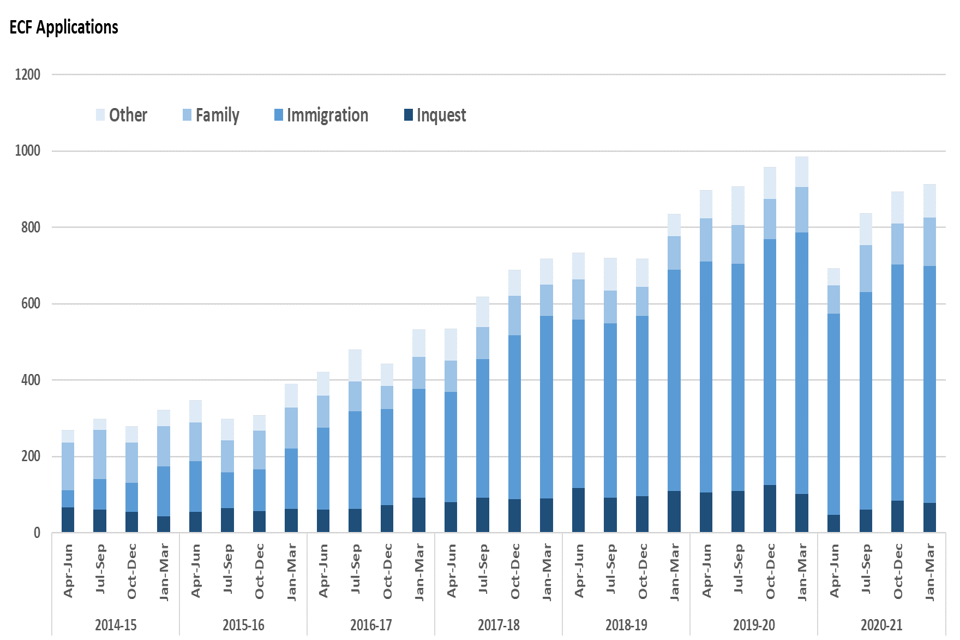
Figure 13: Volume of ECF applications received, January to March 2018 to January to March 2021
Of the 913 ECF applications (covered in table 8.1) received between January and March 2021, 95% (863) had been determined by the LAA as of 01 June 2021. 78% (669) of these were granted, 13% (111) were refused and 7% (63) rejected (Figure 14).
Figure 12: Volume of ECF determinations by outcome, April to June 2015 to January to March 2021
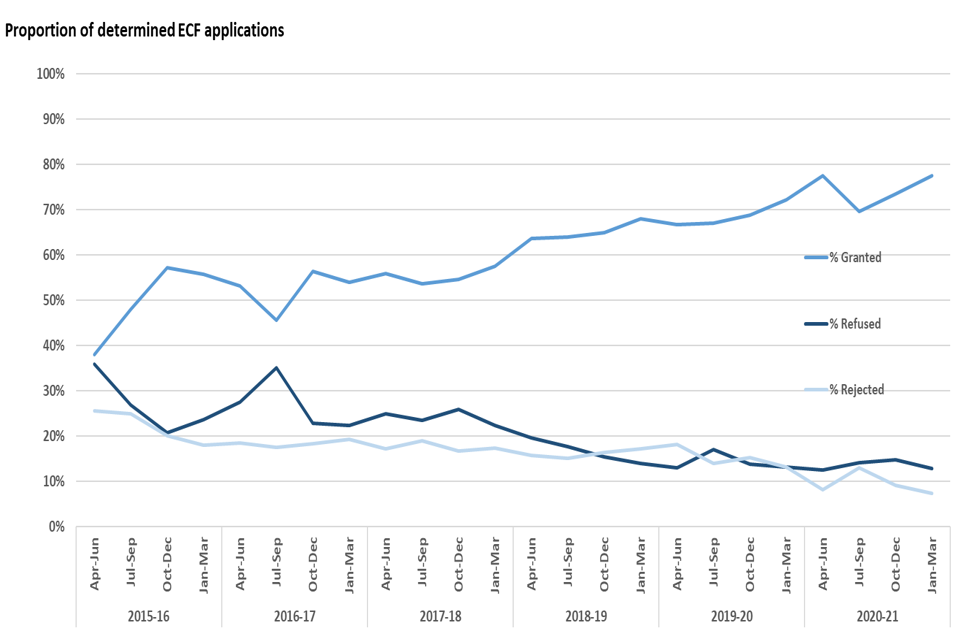
Figure 14: Proportion of ECF determinations by outcome, April to June 2015 to January to March 2021
7. Client Diversity
In general, the proportions of legal aid work by sex, disability status, ethnicity and age band of the client in 2020-21 are consistent with 2019-20.
A diversity data file is published alongside this year-end bulletin. This breaks down legal aid work by the sex, disability status, ethnicity and age band of the client and, for criminal legal aid, the applicant. In this chapter, this data is compared with the national breakdown from the 2011 census data from the Office for National Statistics[footnote 5]. More detail on disclosure control, methodology and data quality can be found in the User Guide[footnote 6] to legal aid statistics. In general, the diversity of legal aid clients compared to 2019-20 is unchanged. This stability in proportions over time can be seen in Table 11.1.
Sex
The profile of criminal legal aid clients in 2020-21 differs from the population average with a much greater proportion of males in the former (Figure 15). This reflects the picture across the criminal justice system as a whole[^7] and is consistent over time. However, the proportion of females varies with the type of work being claimed for. In 2020-21, 14% of magistrates’ court representation work and 15% of police station advice involved females, whereas only 3% of prison law work was for females.
Figure 15: Proportion of legal aid clients by sex, 2020-21
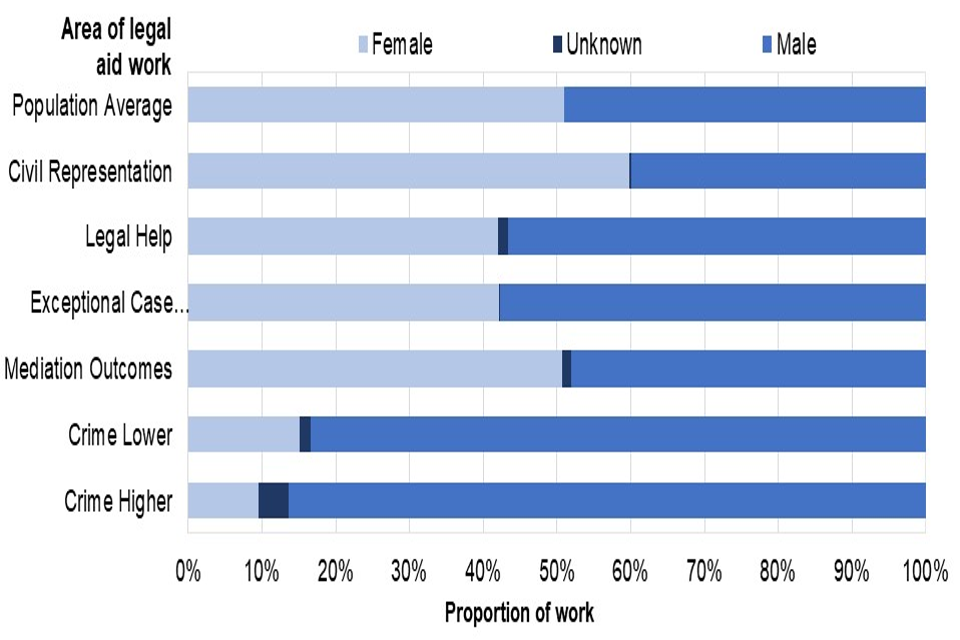
Figure 15: Proportion of legal aid clients by sex, 2020-21
The profile of civil legal aid clients in 2020-21 broadly matches the general population, with some variation by scheme. There is a greater proportion of female clients in civil representation (61%), and a slightly smaller proportion in legal help (41%) and ECF (45%). The proportion of female legal help clients has fallen by 13 percentage points since 2012-2013, driven mainly by immigration where the proportion of females has decreased from one third to one quarter. Overall, the proportions of male and female civil representation clients have remained level over the last few years. Within this, the proportion of males in the domestic violence category has fallen from 18% in 2010-2011 to 5% in 2020-21.
Disability
It is difficult to draw firm conclusions for most categories of legal aid on this characteristic because of the relatively high proportion of unknowns. Crime Higher has the lowest proportion of unknowns, although no detail about the type of disability is recorded (as with Crime Lower). A higher proportion of legally aided Crown Court defendants have a disability (28%) than the population average (18%).
Figures show that a higher proportion of legal help clients have disabilities (32%) than the general population (18%), although this difference is likely to be larger due to the high proportion of unknowns. This may be partly because mental health controlled legal representation work is included within legal help. In 2020-21, almost two thirds of the legal help closed case mental health work claims had the client recorded as having a mental health condition.
Ethnicity
It is difficult to draw firm conclusions from some of the ethnicity data because of the high proportion for which ethnicity is unknown in most areas. Nevertheless, the proportion of legal help and ECF clients reporting as Black/Asian/Minority Ethnic (BAME) is much larger than in the general population. This may reflect the fact that controlled legal representation (CLR) for immigration is included within legal help and the majority of ECF grants are for immigration work.
Figure 16: Proportion of legal help and ECF clients by broad ethnic category, 2020-21
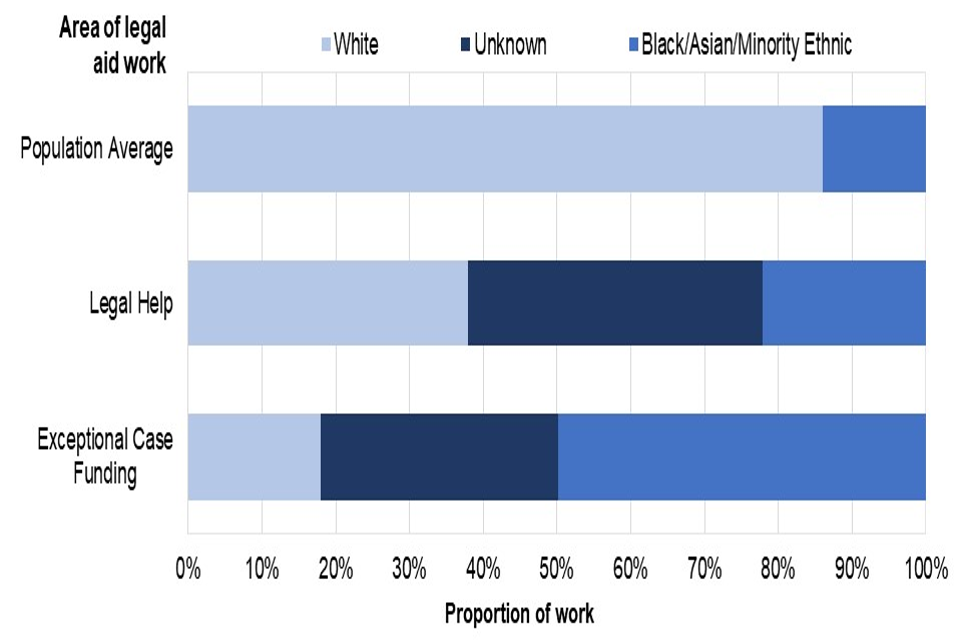
Figure 16: Proportion of legal help and ECF clients by broad ethnic category, 2020-21
Age
Generally, the age profile of legal aid clients is much less evenly spread than the population average, with a higher proportion of working age clients and a smaller proportion of over 55s. A much greater proportion of criminal legal aid clients are from young adult age groups (aged 18-24 and 25-34) than in the general population.
Civil representation has the greatest relative proportion of clients under the age of 18, who make up over one third of certificates completed in 2020-21. Within this, other public law children act proceedings and special children act proceedings both had high proportions of clients under 18; 66% and 47% respectively in 2020-21. Civil representation also has the smallest proportion of clients aged 45 and above; 13% compared to 23% for legal help. The overall age profile of clients in 2020-21 is similar to previous years, although there has been an increase in the proportion of those under 18 in civil representation, up from 16% in 2008-2009 to 35% in 2020-21.
8. Legal aid providers
Over the last 5 years there has been a fall in the number of provider offices completing legal aid work.
Over the past year, as expected, both civil work (down 8%) and criminal work (down 8%) provider numbers have fallen further during the year but recent quarters show an increase.
Legal aid services in England and Wales are delivered through solicitor firms, Not-for-profit organisations, telephone operators and barristers, most of whom are contracted by the LAA to do legal aid work. This chapter presents the number of providers who have completed work and received associated payments from the LAA in any given quarter or financial year.
A provider may consist of a large firm with several offices around the country or a single office location at which one or more individuals are based. For more information on data sources, quality and usage please see the User guide to legal aid statistics.
The timing with which a completed piece of work and the total payment, or expenditure, associated with it are reported are based on the point at which the main final payment for that piece of work was authorised by the LAA, not the timing of cash transactions. Figures for a given period may include the value of work conducted in earlier periods and the expenditure represents the total legal aid fee payments for each item of completed work.
These figures are not equivalent to providers’ profits, earnings or take-home pay. Figures are based on the provider office location and not the location of the client. A provider may serve clients from other geographic areas as well as that in which the office is located. As this data reflects only the location of the provider office it cannot be used as a reliable indicator of the distribution of the clients or benefits of legal aid, or to infer a precise picture of coverage of legal aid services.
Volume of providers
Across civil legal aid, the number of provider offices completing work has fallen by a fifth over the last 5 years and decreased by 8% in the last year. There was a more gradual downward trend for criminal work, although with the last year there is now a 20% fall in the number of provider offices over the last 5 years, and an 8% decrease over the last year.
Figure 17: Number of provider offices completing civil legal aid work, 2013-14 to 2020-21
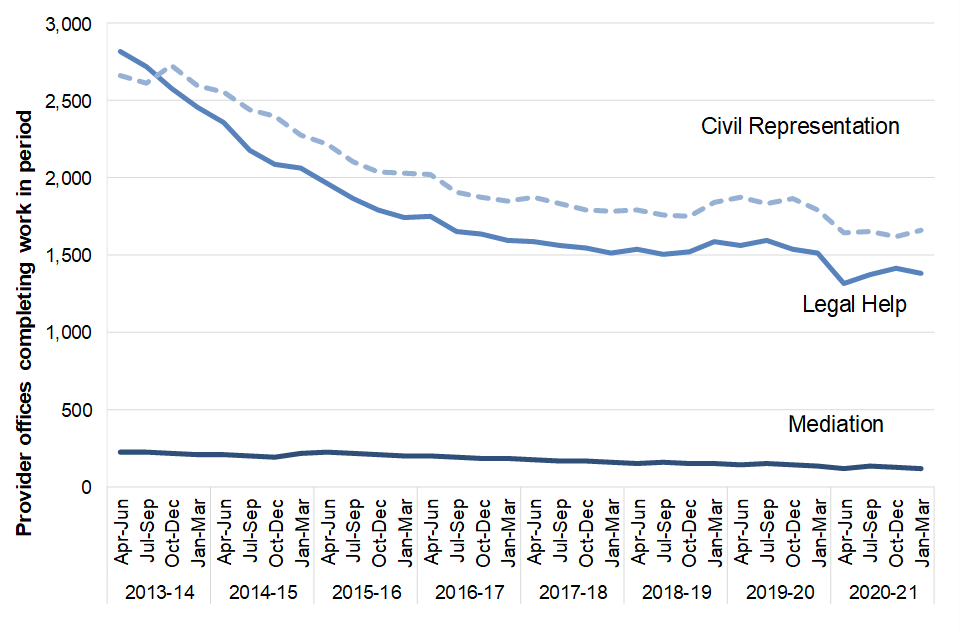
Figure 17: Number of provider offices completing civil legal aid work, 2013-2014 to 2020-2021
Figure 18: Number of provider offices completing criminal legal aid work, 2013-14 to 2020-21
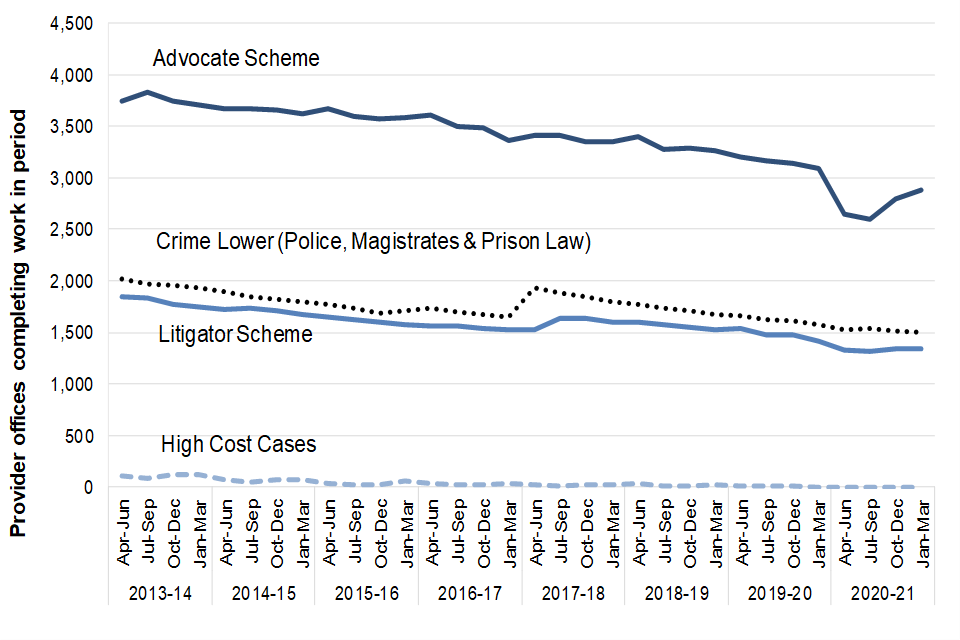
Figure 17: Number of provider offices completing criminal legal aid work, 2013-2014 to 2020-2021
9. Early assessment of the impact of COVID-19 on legal aid activity up to end of April 2021
The majority of information in this National Statistics release covers activity up to the end of March 2021. To address growing public interest and provide the most timely information available on the impact of the COVID-19 pandemic on legal aid, management information up to the end of April 2021 has been analysed. Monthly figures from April 2020 to April 2021 are published in the accompanying tables (Table 12_1).
This section presents headline activity figures for criminal and civil legal aid. No information has been included on expenditure as these figures are subject to greater revision. The methodology is the same as that included in the main National Statistics release. However, quality assurance of the underlying management information has not been undertaken to the same level of checks needed to meet National Statistics standards. Figures should therefore be treated as preliminary and indicative.
This analysis should be treated as provisional information providing a high-level estimate of legal aid volumes in April 2021. As application and starts volumes begin to return to expected levels, some or all of this section may be removed in future releases. Ongoing monitoring of volumes will continue, and management information will be published where beneficial to users.
Mediation data is no longer included in this section due to data quality issues arising from early extraction of data; large discrepancies have been found between management information and subsequent published quarterly data. Mediation volumes are now exceeding levels seen prior to COVID-19 and latest management information is therefore of limited value.
9.1 Criminal legal aid
Police station attendance
- Provisional figures[footnote 5] show that there has been no change in police station attendance in April 2021 (40,064) compared to the monthly average between January and March 2021 (39,966 per month)
Applications received for representation in Crown Courts
- Provisional figures show that there has been a 15% decrease in applications received for representation in the Crown Courts in April 2021 (6,626) compared to the monthly average between January and March 2021 (7,773 per month)
Applications received for representation in magistrates’ courts
- Provisional figures show that there has been an 8% fall in applications received for representation in the magistrates’ courts in April 2021 (14,646) compared to the monthly average between January and March 2021 (15,868 per month)
9.2 Civil legal aid
Legal help
- Provisional figures[footnote 6] show that there was an 8% decrease in legal help new matter starts in April 2021 (8,400) compared to the monthly average between January and March 2021 (9,100 per month). Family starts decreased by 14% and non-family starts decreased by 6% over the period.
Housing Possession Court Duty Scheme
- Following a six-month period with no starts between April and September 2020, HPCDS resumed in October 2020. There was an average of 518 starts per month between January and March 2021 and there were 554 starts in April 2021.
Civil representation applications
- Civil representation applications have fallen by 7% in April 2021 (9,200) compared to the monthly average between January and March 2021 (9,900 a month). Family applications decreased by 7% and non-family by 10% over the period.
10. Further information
This publication presents quarterly data trends and those figures published annually, including those on providers of legal aid, diversity, central funds and legal aid in the higher courts.
Our statisticians regularly review the content of publications. Development of new and improved statistical outputs is usually dependent on reallocating existing resources. As part of our continual review and prioritisation, we welcome user feedback on existing outputs including content, breadth, frequency and methodology. Please send any comments you have on this publication including suggestions for further developments or reductions in content.
10.1 National Statistics status
National Statistics status means that official statistics meet the highest standards of trustworthiness, quality and public value. All official statistics should comply with all aspects of the Code of Practice for Official Statistics.
They are awarded National Statistics status following an assessment by the Authority’s regulatory arm. The Authority considers whether the statistics meet the highest standards of Code compliance, including the value they add to public decisions and debate.
It is the Ministry of Justice’s responsibility to maintain compliance with the standards expected for National Statistics. If we become concerned about whether these statistics are still meeting the appropriate standards, we will discuss any concerns with the Authority promptly. National Statistics status can be removed at any point when the highest standards are not maintained, and reinstated when standards are restored.
11. Contact
Press enquiries should be directed to the Ministry of Justice press office: Tel: 020 3334 3536 Email: newsdesk@justice.gsi.gov.uk
Other enquiries about these statistics should be directed to the Justice Statistics Analytical Services division of the Ministry of Justice:
Carly Gray,
Ministry of Justice, 102 Petty France, London, SW1H 9AJ
Tel: 07784 275495
Email: statistics@justice.gov.uk
12. Tables
-
A set of ‘Tables’, which give further detail and full time-series for each area.
-
More detailed data and Civil detail data: Detailed files to enable independent analysis, provided in .ods (OpenDocument Spreadsheet) format.
13. Help
-
User Guide to legal aid statistics: This provides comprehensive information about data sources as well as key legislative changes.
-
Index of data in Legal aid statistics: A guide to the data published in the .ods files, lists of available data from Legal Aid systems and guidance on how to work with the data.
-
Quality Statement: This provides detail on how legal aid statistics meet user needs
14. Web tool
- Data visualisation tool A web-based tool allowing the user to view and customize charts and tables based on the published statistics.
Next update: 30 Sep 2021
URL: https://www.gov.uk/government/collections/legal-aid-statistics
© Crown copyright Produced by the Ministry of Justice
Alternative formats are available on request from statistics.enquiries@justice.gov.uk
15. Print version in pdf
Legal aid statistics England and Wales bulletin Jan to Mar 2021
-
https://www.gov.uk/government/collections/police-powers-and-procedures-england-and-wales ↩
-
https://www.gov.uk/government/collections/criminal-court-statistics, Table M1 ↩
-
https://www.gov.uk/government/collections/criminal-court-statistics, Table C1 ↩
-
https://www.gov.uk/government/collections/criminal-court-statistics, Table C1 ↩
-
Figures do not include attendance (armed forces) or immigration matters. Monthly figures are therefore not directly comparable with the corresponding figures in Table 2_1 ↩ ↩2
-
Figures do not include telephone operator service activity. Monthly figures are therefore not directly comparable with the corresponding figures in Table 5_1 ↩ ↩2