Land use and land use change statistics – technical notes
Published 24 August 2023
Applies to England

© Crown copyright 2023
This publication is licensed under the terms of the Open Government Licence v3.0 except where otherwise stated. To view this licence, visit nationalarchives.gov.uk/doc/open-government-licence/version/3 or write to the Information Policy Team, The National Archives, Kew, London TW9 4DU, or email: psi@nationalarchives.gov.uk.
Where we have identified any third party copyright information you will need to obtain permission from the copyright holders concerned.
This publication is available at https://www.gov.uk/government/statistics/land-use-change-hectarage-2019-to-2022/land-use-and-land-use-change-statistics-technical-notes
1. Official Statistics Status
The Land Use Change statistics are designated as National Statistics, whereas the Land Use in England statistics are official statistics.
2. Data collection
Data are provided by Ordnance Survey (OS).
3. Data quality
3.1 Things to note on this release
3.2 Assessment of data quality
In 2015, the UK Statistics Authority (UKSA) published a regulatory standard for the quality assurance of administrative data. To assess the quality of the data provided for this release, the department has followed that standard.
The standard is supported with an Administrative Data Quality Assurance Toolkit which provides useful guidance on the practices that can be adopted to assure the quality of the data they utilise.
The Land Use in England and Land Use Change statistical releases are produced by DLUHC based on data provided under contract by Ordnance Survey. Assessments of the level of risk for both releases based on the Quality Assurance Toolkit are below. The assessment was initially carried out for the Land Use Change statistics publication and then extended to include Land Use in England, which uses some of the same underlying data.
Table 1: Quality Assurance of Administrative Data risk matrix
| Risk/Profile Matrix Statistical Series | Administrative Source | Data Quality Concern | Public Interest | Matrix Classification |
|---|---|---|---|---|
| Land Use statistics | The Ordnance Survey land use layer, produced using data from Ordnance Survey’s AddressBase Premium, OS MasterMap Sites Layer, OS MasterMap Topography Layer, and OS Open Greenspace products. | Low | Medium | Low Risk [A1] |
| Land Use Change statistics | Residential address use changes from the Ordnance Survey’s AddressBase Premium and OS MasterMap Topography Layer. Hectarage changes Ordnance Survey’s AddressBase Premium, OS MasterMap Sites Layer, OS MasterMap Topography Layer, and OS Open Greenspace products. | Low | Medium | Low Risk [A1] |
The publication of Land Use statistics can be considered as medium profile, as there is mainstream media interest, with moderate economic and/or political sensitivity.
The data quality concern is considered low, given that the data are obtained under contract from Ordnance Survey, who produce the data using some of their main mapping products. After receiving the datasets, departmental statisticians perform further detailed validation and checks, spotting, obtaining advice from Ordnance Survey and correcting any errors.
Overall, the Land Use in England and Land Use Change statistics have both been assessed as A1: Low Risk. A full outline of the statistical production process and quality assurance carried out is provided in the flow chart in Figure 1.
Figure 1: Quality assurance flow diagram for Land Use in England
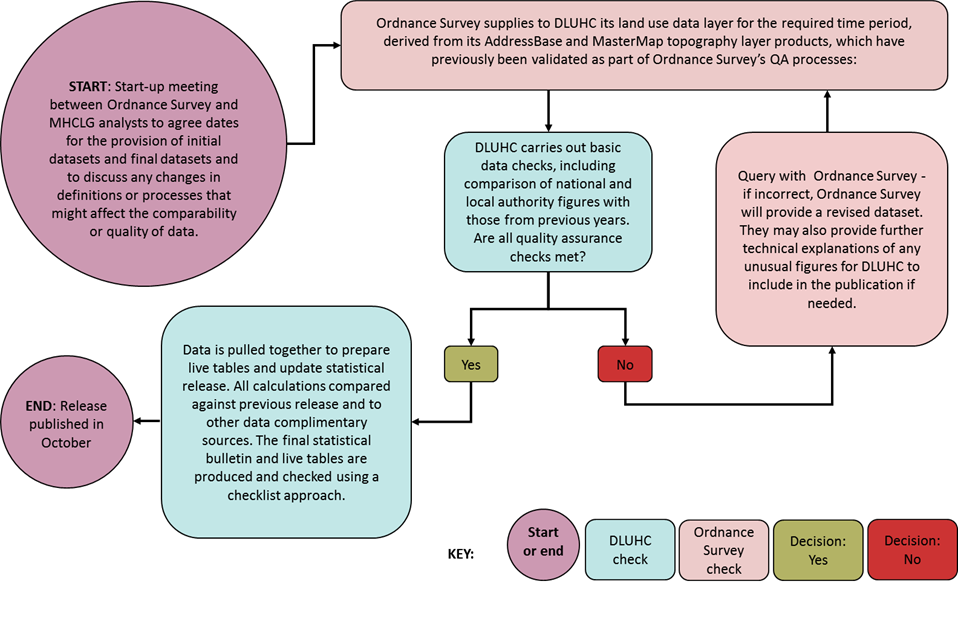
Note on Figure 1: the process for Land Use Change statistics is very similar to that shown for Land Use in England, but uses different data sources, as shown in Table 1, above.
3.3 Operational context and administrative data collection
For Land Use in England, the data provided under contract to the department by Ordnance Survey which is specifically created to deliver DLUHC’s Land Use and Land Use Change Statistics. The data is taken from Ordnance Survey’s land use layer, which is routinely updated using their administrative processes. In particular, it is derived from Ordnance Survey’s AddressBase Premium, OS MasterMap Sites Layer, OS MasterMap Topography Layer, and OS Open Greenspace products. Topographical changes are recorded by an image analysis (c.80,000 km of aerial imagery is captured per year), field surveying and data enhancement/ cartography of boundaries or descriptive terms. Major developments and landscape changes are monitored every six months. Rural areas, urban improvement and minor changes are monitored by aerial photography, with areas revisited for image capture on a three-year cycle.
For the Land Use Change statistics:
-
Residential address-use changes are captured by OS’s AddressBase product within six months of the change occurring at most, as local authorities routinely update an online land gazetteer from council tax, electoral registration and/or planning or building control records; and
-
the hectarage data component is produced by calculating the year on year difference in land use snapshots for three consecutive years. Where more than one change in use has occured on a parcel of land the initial use and final use is recorded. The land use snapshot is derived from AddressBase product, Open Greenspace and the MasterMap Topography and Sites layers. Topographical changes are recorded by a four-step process of remote sensing, field surveying, aerial image capture (c.80,000 km aerial imagery per year) and data enhancement/cartography of boundaries or descriptive terms. Major developments and landscape changes are monitored every six months. Rural areas, urban improvement and minor changes are monitored by aerial photography, with areas revisited for image capture on a three-year cycle.
After receiving the relevant datasets, the department aggregates the data to local authority and national level and performs analysis against boundary files of the Green Belt and areas of high flood risk. The department’s statisticians compare the aggregated data against previous and current data for comparable local authority areas and national trends.
3.4 Communication with data supply partners
Close working links are maintained between Departmental statisticians and the relevant technical team within Ordnance Survey, both in advance of the scheduled annual publication of the statistics and through the year as queries arise in response to ad hoc data queries received. Special importance is attached to any changes between years to the definition of land use categories and to any technical changes, such as improvements in the speed or accuracy of collecting data on changes in land use. This helps to establish whether ‘reverse engineering’ or similar steps are needed to try to disentangle real-world changes in land use from the effects of the technical changes in respect of changes in other years.
3.5 QA principles, standards and checks by data suppliers
The Ordnance Survey’s data products that were used to derive the Land Use in England and Land Use Change data are subject to numerous quality assurance tests to meet the required quality criteria before their publication.
These products are then used in the Land Use in England and Land Use change Statistics methodologies, with the Ordnance Survey going through several stages to produce the final figures in each case.
Before the Department formally receives the Land Use in England and Land Use Change data, Ordnance Survey has also checked that they meet the required performance criteria and worked with the Department’s statisticians to test, develop and improve the outputs’ validity.
3.6 Producers’ QA investigations and documentation
The individual land use and residential address changes provided by Ordnance Survey are checked by Departmental statisticians for records displaying potential anomalies, such as unusually high or low densities, or identified sites of residential changes with homes not yet built. Such anomalous entries are then queried with Ordnance Survey and if necessary amended. The records which have passed this stage are then reconfigured within the Department’s database.
3.7 Quality assurance:
The department has previously published a quality assurance statement alongside the publication of the Land Use in England and Land Use Change Statistics. The Land use change statistics: quality assurance assessment gives a full overview of the quality assurance procedures in place. It has been produced in conjunction with the UK Statistics Authority’s guidance on using administrative data.
3.8 Assessment by the Office for Statistics Regulation (OSR)
During 2020, the OSR carried out a review of the compliance of the Land Use Change Statistics against the Code of Practice for Statistics and concluded that they should continue to be designated as National Statistics. As part of this work, it also reviewed the Department’s official statistics on Land Use in England and found several positive examples in the way that both sets of statistics are produced and presented.
Further details are given in Mark Pont’s letter to Sandra Tudor of 18 December 2020.
4. Definitions
The definitions below have been provided by Ordnance Survey. They relate to the 28 land use groups and categories listed in Table A1, as below and as also included in the Land Use and Land Use Change statistical releases.
Table A1: Land use and land use change classification table
Developed land
| Group | Category | Code |
|---|---|---|
| Community services | Community buildings | C |
| Community services | Leisure (indoor) | L |
| Defence buildings | Defence buildings | D |
| Industry and commerce | Industry | I |
| Industry and commerce | Offices | J |
| Industry and commerce | Retail | K |
| Industry and commerce | Storage and warehousing | S |
| Minerals and landfill | Minerals and mining | M |
| Minerals and landfill | Landfill and waste disposal | Y |
| Other developed use | Unidentified building | ~B |
| Other developed use | Unidentified general manmade surface | ~M |
| Other developed use | Unidentified structure | ~S |
| Other developed use | Unknown surface type with no classification | ~U |
| Residential | Communal accommodation | Q |
| Residential | Residential | R |
| Transport and utilities | Highways and roads | H |
| Transport and utilities | Transport (other) | T |
| Transport and utilities | Utilities | U |
Non-developed land
| Group | Category | Code |
|---|---|---|
| Agriculture | Agricultural land | A |
| Agriculture | Agricultural buildings | B |
| Forestry, open land and water | Forestry and woodland | F |
| Forestry, open land and water | Rough grassland | G |
| Forestry, open land and water | Natural land | N |
| Forestry, open land and water | Water | W |
| Outdoor recreation | Outdoor recreation | O |
| Residential gardens | Residential gardens | RG |
| Undeveloped land | Undeveloped land | X |
Vacant land
| Group | Category | Code |
|---|---|---|
| Vacant land | Vacant land | V |
4.1 Previously developed land
Residential
Residential (R): Houses, flats, sheltered accommodation where residences have separate front entrances and adjoining garages, gardens, estate roads and pathways
Institutional and Communal Accommodation (Q): Buildings that provide communal accommodation including residential institutions that are not classified as Community Buildings (C) or Leisure and Recreational Buildings (L). Included are hotels, hostels, old people’s homes, children’s homes, monasteries and convents, etc.
Transport and Utilities
Highways and Road Transport (H): Roads as through routes, including distributor roads in housing estates, bus stations and public car parks. (Note – Roads in housing or industrial estates that are primarily a means of access to properties are classified as Residential (R) or Industry (I) as appropriate. Car parks not open to the public are classified with the buildings or activities they serve).
Transport (other) (T): Non-highway transport routes and places, e.g. railways, airports and dockland, including all installations within the perimeter of the establishment, e.g. warehouses, dry docks, wharves, internal roads etc. (Note – Canals and rivers are classified as Water (W). Warehousing and industrial sites built on former dockland are classified as Storage and Warehousing (S) or Industry (I) as appropriate).
Utilities (U): Facilities for post and telecommunications, the production and distribution of gas and electricity, the treatment and disposal of sewage, and cemeteries and crematoria. It includes power stations, water works, gas works, refuse disposal places (except those in Landfill Waste Disposal (Y)), TV masts and electricity substations etc.
Industry and Commerce
Industry (I): Works, refineries, shipbuilding yards, mills and other industrial sites. (Note – Where these are part of a public utility, e.g. gas works or water works, they are classified as Utilities (U)).
Offices (J): Local and central government offices, banks, building societies and other offices etc.
Retailing (K): Shops, garages, public houses, restaurants, post offices etc. Storage and Warehousing (S) Depots, scrap and timber yards, warehousing etc.
Community Services
Community Buildings (C): Health, educational, community and religious buildings and police stations, prisons, fire stations, etc.
Leisure and Recreational Buildings (L): Buildings associated with leisure and recreation such as museums, cinemas, theatres, bowling alleys, sports halls, holiday camps, amusement arcades, etc and buildings associated with outdoor recreation.
Vacant Land[footnote 1]
Vacant Land previously developed (V): Land that was previously developed and is now vacant which could be developed without further demolition or treatment. For example, cleared sites with no fixed structures or building foundations. Includes cleared sites used as temporary car parks or playgrounds, provided no work has been done to facilitate their temporary use and there are no permanent fixtures or structures.
Minerals and Landfill
Minerals (M): Areas of surface mineral working including spoil tips together with all buildings and installations for surface and underground mineral workings.
Landfill Waste Disposal (Y): Rubbish tips and former mineral workings which are used for land being reclaimed by the tipping of domestic and industrial waste and land being reclaimed by infill. (Note – Waste transfer stations, incinerators and household waste sites where these are used purely for transit or processing are classified as Utilities (U)).
Defence buildings
Defence buildings (D): Defence establishment land, barracks, buildings, airfields and firing ranges which are shown as such on the OS map. (Note – Married quarters are classified as Residential (R)). Although this classification was simply called ‘Defence’ before the 2018 Land Use in England publication, only building features can be classified as in this way the land use data, such as barracks and administration offices. This is because a defence classification is mainly indicated by the address data used within the land use analysis. It is not indicated by the large-scale topographic data used. Large areas such as firing ranges and military airfields, cannot therefore be identified in practice by the current process.
Other developed use
Unidentified building (~B): Buildings where no other classification is available
Unidentified general manmade surface (not roadside) (~M): Hard standing; usually a car park, paved area, tarmac or other similar construct
Unidentified structure (~S): Manmade structures where no other classification is available
Unknown surface type with no classification (~U): Applied to features where no other classification is available
4.2 Non-previously developed land
Agriculture
Agricultural Land (A): Areas of crops, grassland, hop fields and fruit bushes etc, corresponding to “white” areas without symbol or annotations on the OS map. Orchards and nurseries shown by annotations on the OS map.
Agricultural Buildings (B): Buildings and hard surface areas and farm roads found on farm holdings. (Note – farmhouses are classified as Residential (R) and farm shops are classified as Retailing (K)).
Forestry, Open Land and Water
Forestry/Woodland (F): Areas marked with woodland annotations on the OS map including woodland on farm holdings and woodland used for recreation.
Rough Grassland and Bracken (G): Areas of rough grassland and bracken shown by annotation or symbol on the OS map and areas of scrub, with no other woodland classification, occurring outside areas of forestry and woodland. This category includes such land used for recreation.
Natural and Semi-natural Land (N): Land which is not being cultivated or grazed and which has never been used for development, including scree, cliff, dunes, marsh and beach and land reclaimed from the sea or estuaries which has not yet been grazed or developed. This category includes such land used for recreation.
Water (W): Water features including lakes, canals, reservoirs etc whether man made or occurring naturally and including those used for recreation. (Note – Water filled gravel pits where extraction is still taking place are included in Minerals (M)).
Outdoor Recreation
Outdoor Recreation (O): Outdoor recreation areas such as playing fields and sports grounds, including those in schools and industrial sites, football pitches, golf courses, country parks and allotment gardens. (Note – Buildings, such as stables, clubhouses and pavilions, associated with Outdoor Recreation are classified as Leisure and Recreational Buildings (L). If an area is designated as a nature reserve, the land use grouping is unaffected – any changes within these areas are classified in the normal way).
Residential gardens
Residential gardens (RG): Residential gardens of any type, regardless of surface.
Undeveloped land
Urban Land not previously developed (X): Land in built-up areas which has not been developed previously and which is not currently used for agriculture which is shown on the OS map as a ‘white’ area without annotation. In practice, this often includes flowerbeds and other types of bare earth or grass. (Note – If it was not in a built-up area (or if it was being used for agriculture), such land would be classified as Agricultural Land (A)).
5. Notes
-
These land use statistics are estimates.
-
Land use is not a snapshot on a single day because the data are derived from a range of products, each having its own publication date. These dates are spread out over a number of weeks, but chosen to centre around April 2021.
-
Vacant land is identified by Ordnance Survey as unclassified land, bounded by hoardings etc., around the perimeter. It is also yet to be attributed to an address. It is not possible within the summary statistics presented here (such as in Tables P400 to P405) to define whether the vacant land is of a developed or non-developed land use type.
-
Residential land area is limited to the on the ground footprint.
-
Where an area is recorded as having a mixed use - e.g. flats (residential) above shops (commercial), the land is assigned to the ‘main’ use, often based on floor area or the number of addresses for each land use category.
-
The method used to overlay the land use data with other spatial data files has been improved since statistics were published previously, for 2018. Where two geometric areas intersect each other, only that part of a parcel of land that is included within both areas is included within the relevant breakdown. Previously, the whole area of any such parcel of land was included within the relevant breakdown.
-
The Green Belt analysis is based on annually updated data sets of digitised boundaries provided to DLUHC by local authorities. Land can only be removed from the Green Belt through the local planning process.
-
Land use change statistics are a rich source of information which show how land use has changed in England. The information includes the nature of the changes, the areas of land affected and the locations of the changes. These changes are recorded to and from the same set of 28 as used for the Land Use in England statistics. Two different elements of land use change statistics are usually published: i) residential address change; and ii) change in hectarage (amounts of land).
-
Details of officials who receive pre-release access to Land Use in England and Land Use Change Statistics up to 24 hours before release can be found within the pre-release access list.
6. Revisions policy
The revisions policy has been developed in accordance with the UK Statistics Authority’s Code of Practice for Statistics. It is the revisions policy of the Department for Levelling Up, Housing and Communities (formerly Ministry of Housing, Communities and Local Government).
It defines two types of revision that the policy covers, as follow:
6.1 Non-scheduled revisions
Where a substantial error has occurred as a result of the compilation, imputation or dissemination process, the statistical release, live tables and other accompanying releases will be updated with a correction notice as soon as is practical.
6.2 Scheduled revisions
The Land Use in England and Land Use Change Statistics publications are produced from static versions of Ordnance Survey products and as such are not subject to any scheduled revisions.
7. Other information
7.1 Uses of the data
Land Use in England data are used to monitor the amount of land falling within each of 28 land use categories.
Land Use Change – residential address change data are used to monitor the location and density of new residential dwellings and the previous land use on which these dwellings were created.
Land Use Change – hectarage data provide information on the amount of land changing use from previous use to its new use. These changes are recorded to and from the set of 28 land use categories.
7.2 Related statistics
The Department for Levelling Up, Housing and Communities is part of a cross-government working group, including devolved administrations and the Office of National Statistics, working to improve the trustworthiness quality and value of housing and planning statistics across the UK. This working group has published action plan to make the planned improvements on house building statistics clear and transparent to users.
Details of this work and how you can provide feedback are available via the Government Statistical Service website
Related statistics are detailed in Table 2. Further information can be found in the separate statistical release for each source.
Table 2: Land Use in England and Land Use Change Statistics and related statistics
| Publication | What do the statistics show | Frequency | Where do the data come from? | What are these figures most appropriate for |
|---|---|---|---|---|
| Land Use Statistics | Summaries of developed and non-developed land uses and land use within designated Green Belt | Annual | A snapshot of land use taken from Ordnance Survey’s Address Base and Mastermap Topography products. | Examining how different land uses are distributed across England. |
| Land Use Change Statistics | The amounts and location of land changing use in England | Annual | Two underlying data sets from Ordnance Survey: i) residential address- based change; and ii) land use-based change | Monitoring development such as changes to residential use. They also provide information on the percentage of new dwellings built on previously developed land and non-previously developed land, the percentage of housing development in flood risk areas, on agricultural land and in the Green Belt and the density (dwellings per hectare) of new housing |
| English Local Authority Green Belt statistics | Information on designated Green Belt land in England by local authority. Digital boundary files (shapefiles) are also available | Annual | Annual Green Belt (AGB) returns from local authorities | Monitoring the size and location of designated Green Belt land, including recent changes |
| Generalised Land Use Statistics | Land types within England in 2005 | No plans to update | Ordnance Survey Mastermap land categories: nine simplified land categories and an additional ‘unclassified’ category. | Examining land use within England in 2015: figures available for each Census ward. |
| Land value estimates for policy appraisal | Residential land value estimates by local authority and average industrial and agricultural values for England | Annual | From a Valuation Office Agency model | Provided specifically for the purpose of policy appraisal |
| DLUHC Housing supply: net additional dwellings | Total housing supply that comprises all new build, conversions, change of use, other gains/losses and demolitions | Annual (November) | Comes from local authorities outside London (Housing Flows Reconciliation Return) and for London boroughs is provided by Greater London Authority (London Development Database) | Provides an accurate assessment of annual change in all housing stock and is the most comprehensive estimate of supply. |
| DLUHC Housing supply: Indicators of new supply | Estimates of new build starts and completions and statistics of other indicators. | Quarterly (Mar, Jun, Sep, Dec) | Building control officers at: National House Building Council; Local Authorities; Approved Inspectors | This is a ‘leading indicator’ of house building, available soon (< 2 months) after quarter end. |
| DLUHC: local authority registers of brownfield land | Brownfield sites available for housing | Updated by local authorities on an ongoing basis | Local authority brownfield registers | Identifying land potentially available for housing 2018 data, beta version |
| DEFRA: Agriculture in the UK | Agricultural land use | Annual | Primarily from the June Surveys of Agriculture carried out in the four UK countries each year | Table 2.1 in Chapter 2 (Structure of industry) is a breakdown of agricultural land use in the UK. |
8. User engagement
Users are encouraged to provide feedback on how these statistics are used and how well they meet user needs. Comments on any issues relating to this statistical release are welcomed and encouraged. Responses should be addressed to the “Public enquiries” contact given in the ‘Enquiries’ section below.
Please refer to the Department’s engagement strategy to see how we meet the needs of statistics users.
On 31 May 2019, the Department published a consultation paper on proposed changes to its land use change statistics. Following the closing date for responses on 31 July 2019, the Department analysed the responses received and published its response on 16 July 2020. See the consultation paper and the response.
In summary, the Department announced its intention to implement the main proposals to continue to publish statistics on land use annually, in addition to maintaining annual updates on the number of addresses changing from and to a residential use, but decreasing the frequency of publication of hectarage change estimates to three-yearly intervals.
In the light of further engagement with our data suppliers, Ordnance Survey, on data collection and methodology, the Department is considering whether it is better to publish statistics on land use every three years, rather than annually. The Department would welcome users’ views on this, and any other aspect of the statistics. Users can comment by emailing planning.statistics@levellingup.gov.uk.
-
Although a Derelict Land (Z) category previously existed, it was dropped as part of the methodology changes that took effect from 2013-14 for the land use change statistics. ↩