Incorporated companies in the UK October to December 2021
Published 27 January 2022

© Crown copyright 2022
This publication is licensed under the terms of the Open Government Licence v3.0 except where otherwise stated. To view this licence, visit nationalarchives.gov.uk/doc/open-government-licence/version/3 or write to the Information Policy Team, The National Archives, Kew, London TW9 4DU, or email: psi@nationalarchives.gov.uk.
Where we have identified any third party copyright information you will need to obtain permission from the copyright holders concerned.
This publication is available at https://www.gov.uk/government/statistics/incorporated-companies-in-the-uk-october-to-december-2021/incorporated-companies-in-the-uk-october-to-december-2021
1. Introduction
This release provides information about the population of companies in the UK. A company is defined as a specific legal form of business formed under the Companies Act 2006. Companies are registered at Companies House regardless of whether they go on to trade actively. Further information on companies and the Companies Act 2006 is provided in the document Definitions to accompany statistical releases.
The statistics in this release include the total number of registered companies, the number of newly incorporated companies and the number of companies that were dissolved. The release focusses on the headline messages for the UK. Figures for the constituent countries are contained in the supplementary tables that accompany this release. The supplementary tables also contain separate figures for public companies and limited liability partnerships.
2. Key points
-
At the end of December 2021, there were 4,837,908 companies on the total register and 4,452,910 on the effective register.
-
During the fourth quarter of 2021, the total register increased by 21,085 companies (0.4%), and the effective register increased by 16,715 companies (0.4%).
-
Between October and December 2021, there were 178,837 new incorporations and 159,596 dissolutions in the UK.
-
The number of incorporations in the fourth quarter of 2021 decreased by 22,983 (11.4%) compared with the same quarter of 2020, but increased by 22,887 (14.7%) compared with the same quarter of 2019.
-
The number of dissolutions in the fourth quarter of 2021 decreased by 2,241 (1.4%) compared with the fourth quarter of 2020, but increased by 37,971 (31.2%) compared with the same quarter of 2019. Given the disruption to the strike off process, as a result of the coronavirus (COVID-19) outbreak and national lockdown measures, it’s difficult to make like for like comparisons to previous years. Refer to the key events for more details.
-
The number of companies in the course of removal increased by 27,563 (10.7%) compared with the same period last year, and by 85,125 (42.4%) compared with the same quarter of 2019. Compared with the third quarter of 2021, the number of companies in the course of removal increased by 3,053 (1.1%). Given the disruption to the strike off process, as a result of the COVID-19 outbreak and national lockdown measures, it’s difficult to make like for like comparisons to previous years. Refer to the key events for more details.
3. Key events
-
In response to the COVID-19 outbreak and national lockdown measures introduced in March 2020, a set of easements were announced by Companies House on 16 April 2020. They included the temporary pause of the strike off process (voluntary and compulsory) to give businesses affected by the COVID-19 outbreak and national lockdown measures the time they needed to update their records filed with Companies House and help them avoid being struck off the register. The impact of this announcement was that compulsory dissolutions from 2 April 2020 onwards were temporarily paused, as was the final stage of voluntary dissolutions.
-
On 10 September 2020 the voluntary strike off process resumed via a phased release through the remainder of September and into October. This removed companies that applied to be struck off before July 2020, including some companies that filed for dissolution before the first UK wide COVID-19 lockdown began in March 2020. The release of paused compulsory dissolutions began on 10 October 2020.
-
In response to the ongoing COVID-19 pandemic, there was a second pause of the voluntary and compulsory strike off processes on 21 January 2021. Companies House temporarily paused the strike off processes so that companies and creditors would not be adversely affected by processing delays. The strike off process resumed via a phased release on 8th March 2021.
-
As part of the Corporate Insolvency and Governance Act, companies were granted automatic extensions to their filing deadlines, which may have affected the volume of dissolutions in 2020 and 2021.
4. Incorporated companies
At the end of December 2021, there were 4,837,908 companies on the total register – which includes those in the course of removal and liquidation (384,998).
Compared with the end of September 2021, the size of the total register increased by 21,085 companies (0.4%) by the end of December 2021. Growth was observed in England and Wales (0.5%) and Northern Ireland (0.8%). The total register size in Scotland decreased slightly (0.1%) in the same period.
By the end of December 2021, the size of the total register increased by 163,236 companies (3.5%) compared with the end of December 2020.
At the end of December 2021, the number of companies on the effective register – which excludes those in the course of removal or liquidation – was 4,452,910.
Compared with the end of September 2021, the size of the effective register increased by 16,715 companies (0.4%). Growth was observed in all constituent countries in line with the long-term trend: England and Wales (0.4%), Scotland (0.01%) and Northern Ireland (0.4%).
By the end of December 2021, the effective register increased by 132,048 companies (3.1%) compared with the end of December 2020.
The size of both the total and effective registers increased at a consistent rate from the first quarter of 2012 to the second quarter of 2020. However, between the second quarter of 2020 and the second quarter of 2021 the rate of growth of the total register size significantly increased: the rate of growth of incorporations increased during this period, along with a decrease in the number of dissolutions.
Chart 1: UK total and effective register sizes, 2012 quarter 1 to 2021 quarter 4
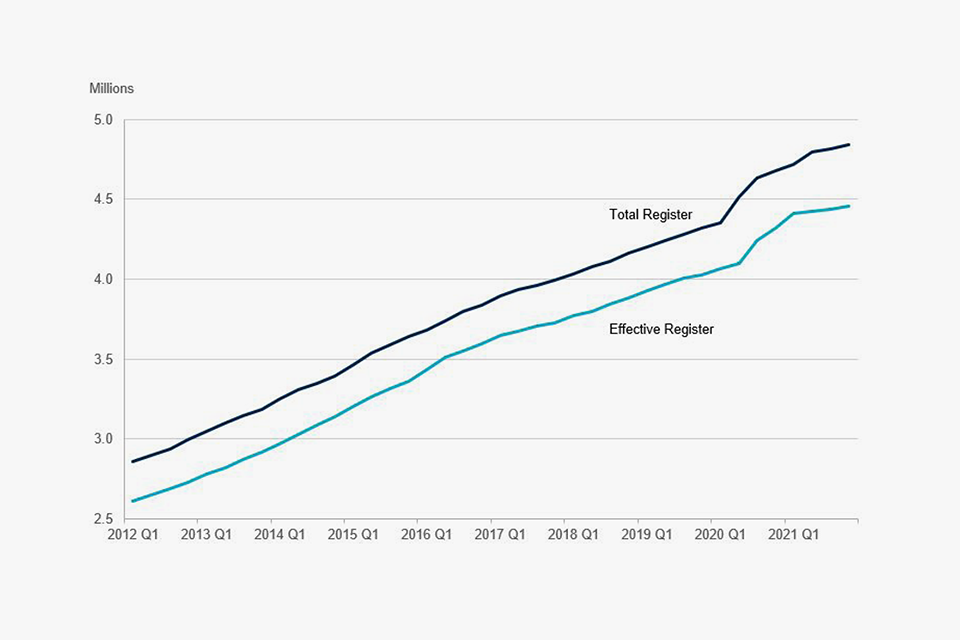
Source: Incorporated companies in the UK, October to December 2021, Companies House
Between October and December 2021, there were 178,837 incorporations and 159,596 dissolutions in the UK.
The number of incorporations during the fourth quarter of 2021 decreased by 22,983 (11.4%) compared with the same quarter of 2020, but increased by 22,887 (14.7%) compared with the same quarter of 2019.
The number of incorporations has continued to increase over time. For instance, there were 62,160 more incorporations in the fourth quarter of 2021 compared with the fourth quarter of 2012: this represents an average annual growth rate of 4.9% over the 9 years.
The number of dissolutions during the fourth quarter of 2021 decreased by 2,241 (1.4%) compared with the same quarter of 2020, although figures for 2020 are affected by the pause to strike off activity between 2 April 2020 and 10 September 2020. Compared with the same quarter in 2019, dissolutions increased by 37,971 (31.2%).
The number of dissolutions has generally increased over time, with the exception of the pause to strike off that was a result of the COVID-19 outbreak and national lockdown measures. There were 97,573 more dissolutions in the fourth quarter of 2021 than in the fourth quarter of 2012, which represents an average annual growth rate of 11.1%. However, it’s difficult to make comparisons due to the disruptions to the strike off process which are affecting seasonal trends.
At the end of December 2021, the number of companies in the course of removal increased by 27,563 (10.7%) compared with the same period last year, and by 85,125 (42.4%) compared with the same quarter of 2019. Compared with the third quarter of 2021, the number of companies in the course of removal increased by 3,053 (1.1%). Given the disruption to the strike off process, as a result of the COVID-19 pandemic, it’s difficult to make like for like comparisons to previous years.
Chart 2: UK total incorporations and dissolutions, 2012 quarter 1 to 2021 quarter 4
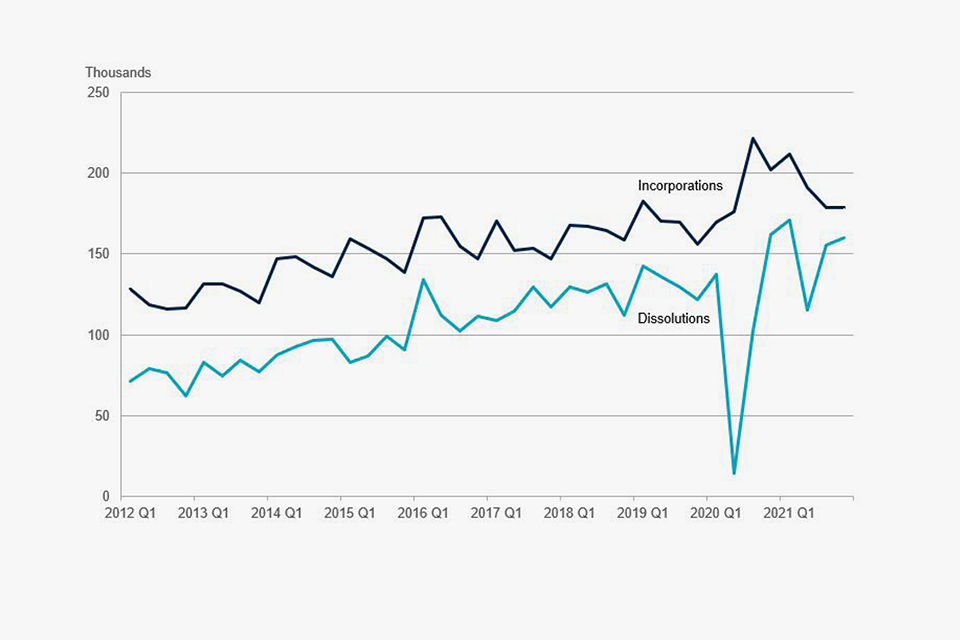
Source: Incorporated companies in the UK, October to December 2021, Companies House
A full breakdown of figures for England and Wales, Scotland, Northern Ireland and the UK as a whole is provided in the Excel workbook that accompanies this release. Figures are provided on both a quarterly and annual basis from 2011.
5. Other statistics in this release
In addition to the tables covering register activity for all companies, a range of other statistics are included in the tables that accompany this release. These tables provide information at the individual country level and for the UK as a whole. The tables cover the following:
- register activity for public companies
- register activity for limited liability partnerships (LLPs)
- company insolvencies and liquidations
- removals from the register
6. Background notes
This section provides a range of information designed to provide the user with more information about the statistics.
Definitions
A separate document Definitions to accompany statistical releases is available, providing definitions for the main terms used in Companies House official statistics publications.
Quality
Information relating to the quality of the statistics is provided in a separate quality document. This document provides information on the quality of Companies House’s official statistics, to enable users to judge whether the data is of sufficient quality for their intended use. The information is structured in terms of the quality dimensions of the European Statistical System. The document also provides information on how these statistics relate to selected other business statistics.
Coverage
This release provides information on the size of the company population and the changes that have occurred within the quarter. The release includes statistics for the UK, England and Wales, Northern Ireland, and Scotland. The statistics cover companies, which are specific legal forms of businesses that are registered at Companies House. They do not include information on sole proprietorship businesses, partnerships, or charities.
Use and users
Companies House statistics are used extensively by government, the public, public bodies and businesses. For example, they are used by:
- government in understanding the likely impact of policy changes and monitoring the impact of economic changes on companies
- businesses in understanding their market share and planning marketing strategies
- banks in developing an understanding of their customer base
- foreign firms in making UK location decisions
- academics to inform research into businesses at local and national level
- a range of public bodies in decision making and evaluating business-related policies
Consultation
Results of the most recent consultation on these official statistics are published.
Revisions to these statistics
Revisions to these statistics will be mainly due to changes in methodologies and source data. The statistics are derived from administrative data, and changes to the underlying methods will cause revisions. These include changes in statistical methods, definitions, classifications, and geographic coverage.
Although Companies House has robust procedures in place to minimise errors in the methods used to create these statistics, errors may occasionally occur. If errors are found after the publication, their impact will be assessed. If the changes are significant, a correction will be issued as soon as possible. Minor corrections will be included in the next planned release.
Any misleading or incorrect figures will be amended and a footnote added to indicate that the figures have been corrected. The nature and reason for the correction will be explained.
Date of next release
Annual statistics for the financial year 2021 to 2022 will be published on 30 June 2022.
Statistics for the period 1 January to 31 March 2022 will be published on 28 April 2022.
The publication dates have been announced on the GOV.UK release calendar.