Summary of latest statistics
Published 24 May 2018

© Crown copyright 2018
This publication is licensed under the terms of the Open Government Licence v3.0 except where otherwise stated. To view this licence, visit nationalarchives.gov.uk/doc/open-government-licence/version/3 or write to the Information Policy Team, The National Archives, Kew, London TW9 4DU, or email: psi@nationalarchives.gov.uk.
Where we have identified any third party copyright information you will need to obtain permission from the copyright holders concerned.
This publication is available at https://www.gov.uk/government/statistics/immigration-statistics-year-ending-march-2018/summary-of-latest-statistics
Back to ‘Immigration Statistics, year ending March 2018’ content page.
This is not the latest release. View latest release.
1. How many people come to the UK each year?
There were 137.9 million passenger arrivals in the year ending March 2018, including returning UK residents, an increase of 6.0 million compared to the previous year: a record number. This increase was divided between:
- 3.1 million more arrivals by British, other EEA and Swiss nationals (up 3% to 118.0 million)
- 2.9 million more by non-EEA nationals (up 17% to 19.9 million)
These numbers represent the number of occasions when a person entered the UK, not the number of distinct individuals.
The majority of non-EEA visitors do not require a visa. For other visitors and for other purposes, there were over 2.7 million visas granted in the year ending March 2018. Of these, nearly 2.1 million (77%) were to visit and 8% were for study.
Entry clearance visa applications and outcomes, by visa type, year ending March 2018
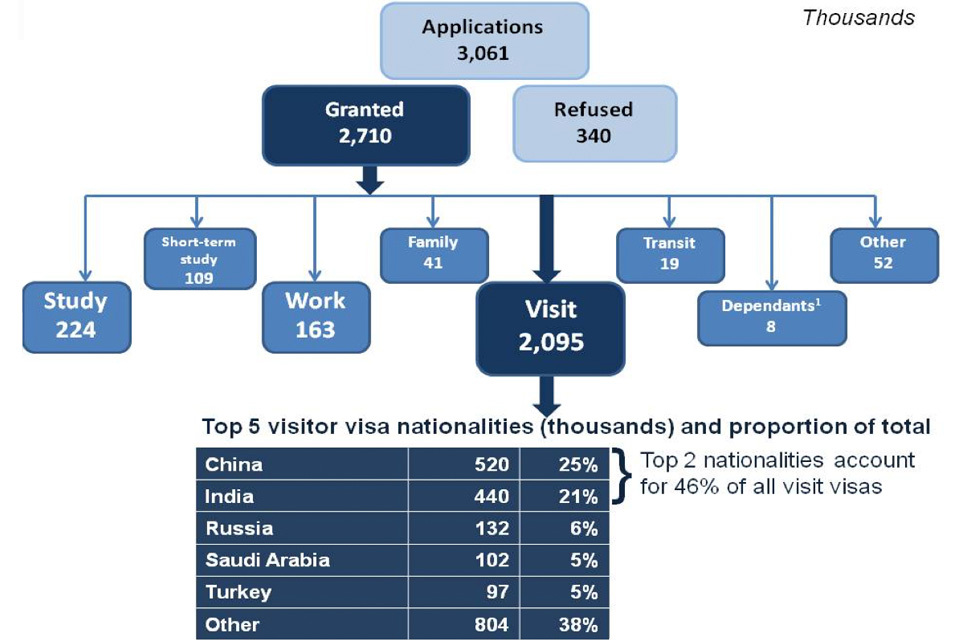
The chart shows the number and type of visas granted for the latest year available. The data are available in Visas tables vi 01 q and vi 06 q o.
Sources:
Table vi 01 q (Entry clearance visas tables, volume 1)
Table vi 06 q o (Entry clearance visas tables, volume 3)
Chart note:
- Dependants joining or accompanying.
2. Why do people come to the UK?
2.1 Visit
Over 2.7 million visas were granted in the year ending March 2018 and, of these, 2.1 million (77%) were to visit.
There were 131,302 (+7%) more Visitor visas granted in the year ending March 2018. Of these, there were notable increases in Visitor visas granted to:
- Indian nationals, up 45,898 (+12%) to 439,843
- Russian nationals, up 23,609 (+22%) to 131,925
- Pakistani nationals, up 15,093 (+34%) to 58,960
- Chinese nationals, up 13,486 (+3%) to 520,022 (excluding Hong Kong)
Chinese and Indian nationals alone accounted for just under half (46%) of all visit visas granted.
In the year ending June 2017 (latest available data by purpose of journey), the number of non-EEA visitor arrivals increased by 2.0 million (21%) to 11.3 million compared to the previous year.
Many nationalities, including US nationals, do not normally require a visa to visit the UK. Consequently the number of Visitor visas granted is much lower than the total number of arrivals.
For further details see ʻWhy do people come to the UK? (1) To visit’ and the data tables.
2.2 Work
There were 162,874 Work-related visas granted in the year ending March 2018, 1% fewer than the previous year. This included:
- 5,198 high-value (Tier 1) visas, up 11%
- 93,048 Skilled (Tier 2) visas, down 1%
- 40,472 youth mobility and temporary workers (Tier 5), down 3%
- 24,156 non-points-based system (PBS) / other Work visas, no change from the previous year
There were 99,229 Work-sponsored visa applications by main applicants in the year ending March 2018. Of these, 53,674 were for Tier 2 Skilled applications, 4% fewer than the previous year (56,047).
For further details see ʻWhy do people come to the UK? (2) To work’ and the data tables.
2.3 Study
In the year ending March 2018, there were 223,839 Tier 4 Study-related visas granted, a 7% increase on the previous year.
Over the same period, the number of University-sponsored study visa applications rose 6% to 178,612. This included an 8% increase for Russell Group universities to 87,175.
Three nationalities (Chinese, Indian and US) accounted for over half (53%) of the 223,839 Study-related visas granted in the year ending March 2018, with the largest number granted to Chinese nationals (88,657, or 40% of the total).
There were notable increases in the number of Study-related visas granted to:
- Chinese nationals, up 11,381 (15%) to 88,657
- Indian nationals, up 3,530 (30%) to 15,171
For further details see ʻWhy do people come to the UK? (3) To study’ and the data tables.
2.4 Family
The combined total number of Family-related visas granted, including EEA Family permits granted to non-EEA nationals, and visas granted to dependants of other visa holders (excluding visitors) fell by 1% to 134,789 in the year ending March 2018.
For further details see ʻWhy do people come to the UK? (4) For family reasons’ and the data tables.
3. How many people do we grant asylum or protection to?
In the year ending March 2018, there were 14,166 grants of asylum, alternative forms of protection and resettlement, down 11% compared with 15,973 in the previous year. This comprised:
- 6,865 grants of asylum to main applicants and dependants (down 17%)
- 1,541 grants of alternative form of protection to main applicants and their dependants (up 16%)
- 5,760 people provided with protection under a resettlement scheme (down 9%)
Of the 14,166 people granted asylum, protection and resettlement, 5,953 (42%) were children (under 18 years old).
Additionally, 5,874 Family reunion visas were issued to partners and children of those granted asylum or humanitarian protection in the UK, a 2% increase since last year. Of these, 2,883 (49%) were issued to children.
The number of asylum applications in the UK from main applicants decreased by 8% to 26,547 in the year ending March 2018. The fall in asylum applications reflects a return to levels seen before the European migration crisis in 2015. The falls are consistent with what has been seen more widely across Europe, with a decrease of around 41% in applications to EU countries in the last year.
There were 774 grants of asylum or alternative forms of protection to Syrian nationals (including dependants) at initial decision in the year ending March 2018 (down 49%).
A total of 5,760 people were resettled in the UK in the year ending March 2018 under various schemes. This included 4,342 Syrian nationals who were provided protection under the Vulnerable Person Resettlement Scheme (VPRS), bringing the total number of Syrians provided protection to 11,649 since the scheme began in 2014.
For further details see ʻHow many people do we grant asylum or protection to?’ and the data tables.
4. How many people continue their stay in the UK?
There were 163,817 main applicants granted an extension to their stay in 2017 (the latest available data by previous reason for stay).
- 79% allowed the individual to stay within their previous broad reason for stay (129,608)
- 21% switched categories (34,209)
There were 71,676 people granted permission to stay permanently in the UK in the year ending March 2018, 23% more than in the previous year. The number of grants is low relative to the peak in the year ending September 2010 (241,586).
In the year ending March 2018, 141,883 documents certifying permanent residence and permanent residence cards were issued to EEA nationals and their non-EEA family members. The majority of these (88%) were issued to EU nationals. This is fewer than the highest recorded figure for the year ending December 2017 (168,413) reflecting quarter-on-quarter falls in decisions from a peak of 51,466 in the first quarter of 2017 to 24,886 in the last quarter.
Total applications for British citizenship rose by 6% to 140,073 in the year ending March 2018 compared to the previous year. This was 40% lower than the peak in 2013 (232,262). Within the total, applications made by non-EU nationals fell by 10,195 to 99,617, and applications by EU nationals almost doubled, up 18,302 to 40,456.
For further details see ʻHow many people continue their stay in the UK?’ and the data tables.
5. How many people are detained or returned?
In year ending March 2018, 26,541 individuals entered the detention estate (down 8% compared with the previous year) and 27,429 left the detention estate (down 5%).
At the end of March 2018, there were 2,400 persons held in the detention estate (excluding HM Prisons), a fall of 18% compared with 12 months earlier. Additionally, 358 individuals were held in immigration detention in HM Prisons.
The total number of enforced returns from the UK, including those not directly from detention, decreased by 9% to 11,621 in year ending March 2018 compared with 12,766 in the previous year.
Provisional data show that 5,630 Foreign National Offenders (FNOs) were returned in year ending March 2018, down 11% compared to 6,346 in the previous year; of these:
- 66% were EU nationals (3,694)
- 34% were non-EU nationals (1,936)
For further details see ʻHow many people are detained or returned’ and the data tables.