Why do people come to the UK? (1) To visit
Published 24 May 2018

© Crown copyright 2018
This publication is licensed under the terms of the Open Government Licence v3.0 except where otherwise stated. To view this licence, visit nationalarchives.gov.uk/doc/open-government-licence/version/3 or write to the Information Policy Team, The National Archives, Kew, London TW9 4DU, or email: psi@nationalarchives.gov.uk.
Where we have identified any third party copyright information you will need to obtain permission from the copyright holders concerned.
This publication is available at https://www.gov.uk/government/statistics/immigration-statistics-year-ending-march-2018/why-do-people-come-to-the-uk-1-to-visit
Back to ‘Immigration Statistics, year ending March 2018’ content page.
This is not the latest release. View latest release.
Data relate to the year ending March 2018 and all comparisons are with the year ending March 2017, unless indicated otherwise.
This section contains data on:
- visitor-related Entry clearance visas
- visitor-related arrivals for non-EEA nationals
Visitor arrivals data are currently based on landing cards completed as people cross the border. See the Home Office’s Response to media reporting on landing cards for more information. Visitor visa data relate to visas applied for and resolved outside the UK. More information on non-visitor arrival and visa data by category and nationality is included in ʻWhy do people come to the UK? (2) To work’, ʻWhy do people come to the UK? (3) To study’ and ʻWhy do people come to the UK? (4) For family reasons’.
We provide a more detailed commentary on an annual basis. This is included in ‘Immigration Statistics, April to June 2017’.
1. Key facts
Over 2.7 million visas were granted in the year ending March 2018 and, of these, 2.1 million (77%) were to visit.
There were 131,302 (+7%) more Visitor visas granted in the year ending March 2018. Of these, there were notable increases in Visitor visas granted to:
- Indian nationals, up 45,898 (+12%) to 439,843
- Russian nationals, up 23,609 (+22%) to 131,925
- Pakistani nationals, up 15,093 (+34%) to 58,960
- Chinese nationals, up 13,486 (+3%) to 520,022 (excluding Hong Kong)
Chinese and Indian nationals alone accounted for just under half (46%) of all visit visas granted.
In the year ending June 2017 (latest available data by purpose of journey), the number of non-EEA visitor arrivals increased by 2.0 million (21%) to 11.3 million compared to the previous year.
Many nationalities, including US nationals, do not normally require a visa to visit the UK. Consequently the number of Visitor visas granted is much lower than the total number of arrivals.
Trends in Visitor visa applications and Visitor visas granted, 2008 to the year ending March 2018
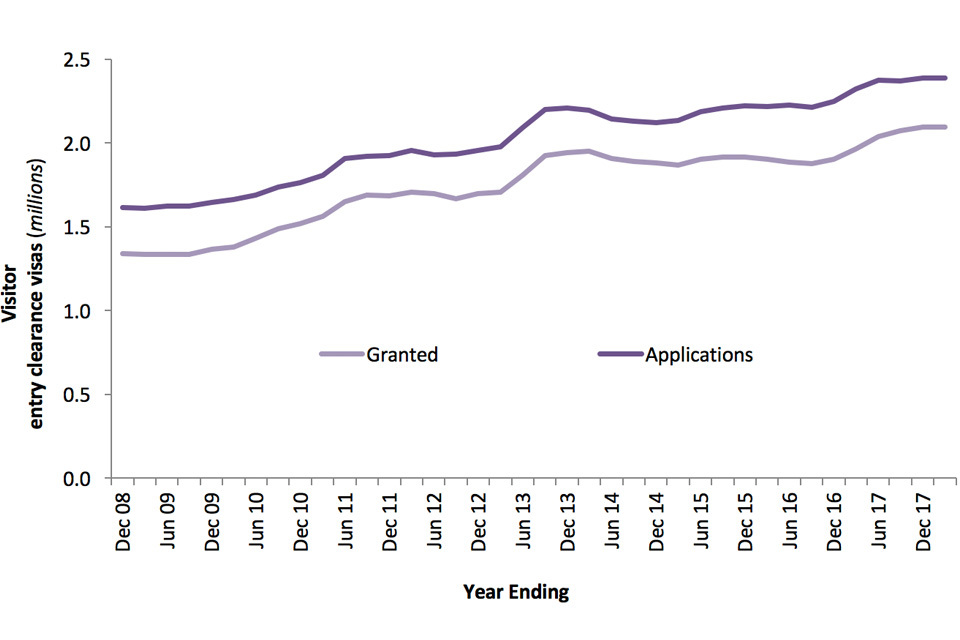
The image shows the number of Visitor visa applications and Visitor visas granted between 2008 and the year ending March 2018 year available. Totals for these data are available in Visas table vi 01 q.
Source:
Table vi 01 q (Entry clearance visas tables, volume 1).
2. Data tables
Data on visas and passenger arrivals can be found in the following tables:
Entry clearance visas tables volume 1
Entry clearance visas tables volume 2
Entry clearance visas tables volume 3
Admissions tables