How many people do we grant asylum or protection to?
Published 23 August 2018

© Crown copyright 2018
This publication is licensed under the terms of the Open Government Licence v3.0 except where otherwise stated. To view this licence, visit nationalarchives.gov.uk/doc/open-government-licence/version/3 or write to the Information Policy Team, The National Archives, Kew, London TW9 4DU, or email: psi@nationalarchives.gov.uk.
Where we have identified any third party copyright information you will need to obtain permission from the copyright holders concerned.
This publication is available at https://www.gov.uk/government/statistics/immigration-statistics-year-ending-june-2018/how-many-people-do-we-grant-asylum-or-protection-to
We welcome your feedback
The content and format of the quarterly release and associated data tables is currently being reviewed. This means the release may be subject to change in the future. If you have any comments, or suggestions for the development of this report, please provide feedback by emailing MigrationStatsEnquiries@homeoffice.gov.uk. Please include the words ‘PUBLICATION FEEDBACK’ in the subject of your email.
The Home Office is also running a more general survey on Home Office statistical publications, which covers all Home Office statistical publications.
See section 6 of the About this release section for more details.
Back to ‘Immigration statistics, year ending June 2018’ content page.
This is not the latest release. View latest release.
Data relates to the year ending June 2018 and all comparisons are with the year ending June 2017, unless indicated otherwise. This section contains data on:
- asylum applications and initial decisions
- unaccompanied asylum-seeking children (UASC)
- asylum support
- resettlement
- Family reunion visas granted
- international comparisons of asylum trends
- outcome of asylum applications
Data on transfers under the Dublin regulation can be found in the Asylum tables.
1. Key facts
The number of asylum applications in the UK from main applicants was 27,044 in the year ending June 2018 (down 1%). This represents a return to levels seen before the European migration crisis in 2015. Over the same period, there have been wider falls in asylum applications to other EU countries (down 32%).
In the year ending June 2018, the UK issued 14,308 grants of asylum, alternative forms of protection and resettlement, down 12% compared with 16,215 in the previous year. This comprised:
- 6,568 grants of asylum to main applicants and dependants (1,618 lower than previous year, or down 20%)
- 2,038 grants of alternative forms of protection to main applicants and their dependants (870 higher than the previous year, or up 74%)
- 5,702 people provided with protection under various resettlement schemes (1,159 lower than the previous year, or down 17%)
The large increase in applicants granted alternative forms of protection was primarily driven by a large increase in Libyan nationals granted humanitarian protection in the last year (682, up from 36).
Of the 14,308 people granted asylum, protection and resettlement, 6,068 (42%) were children (under 18 years old), an increase of 2% from the previous year.
Additionally, 5,963 Family reunion visas were issued to partners and children of those granted asylum or humanitarian protection in the UK, a 9% increase since last year. Of these, 2,890 (48%) were issued to children.
There were 715 grants of asylum or alternative forms of protection to Syrian nationals (including dependants) at initial decision in the year ending June 2018 (down 35%).
A total of 5,702 people were resettled in the UK in the year ending June 2018 under various schemes. This included 4,316 people who were provided protection under the Vulnerable Person Resettlement Scheme (VPRS), bringing the total number of people provided protection to 12,851 since the scheme began in 2014.
2. Asylum applications and initial decisions
In the year ending June 2018, the number of applications for asylum in the UK (main applicants only) was 27,044, similar to the previous year. This represents a return to levels seen before the European migration crisis in 2015. The number of asylum applications is still well below the peak in the year ending June 2002 (75,680). Over the same period, there have been wider falls in asylum applications to other EU countries (down 32%).
Asylum applications in the UK, year ending June 2009 to the year ending June 20181
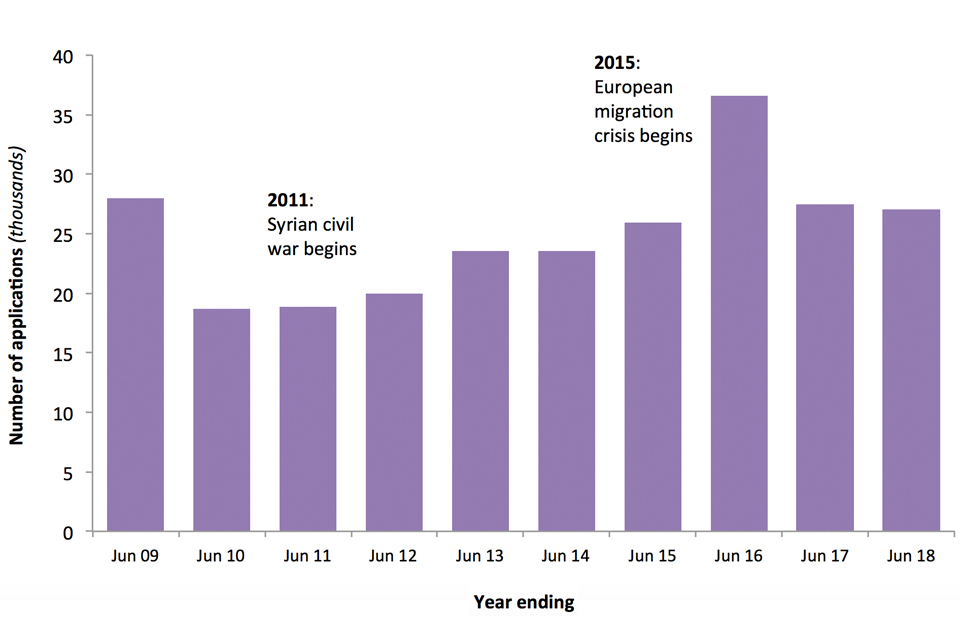
The chart shows the number of asylum applications made in the UK (main applicants only) over the last 10 years.
Source:
Table as 01 q (asylum tables, volume 1)
Chart note:
- Main applicants only.
Of the 21,666 initial decisions on asylum applications from main applicants, 29% were grants of asylum or an alternative form of protection, compared to 34% in the previous year.
The number of people granted asylum, resettlement, or another form of protection (such as humanitarian protection or discretionary leave) following an asylum application in the year ending June 2018 was 14,308 (including dependants). Data on grants of protection through resettlement schemes are discussed in the Resettlement section.
As shown in the following chart, the total number of people granted asylum, resettlement or another form of protection exhibited a slow rise and fall over the 5 years from the year ending June 2009 to the year ending June 2014. From June 2014 to December 2015, there was a large (112%) increase in the total number of people granted asylum, resettlement or another form of protection, driven predominantly by an increase in grants of asylum and other forms of protection.
In the period December 2015 to June 2017, the number of people granted asylum or another form of protection fell, but the number resettled rose, resulting in an overall stable trend. Since June 2017, the number of people resettled has fallen, resulting in a slight decrease in the total number of people granted asylum, resettlement or another form of protection.
Grants of asylum, resettlement1, and other forms of protection, year ending June 2009 to the year ending June 20182
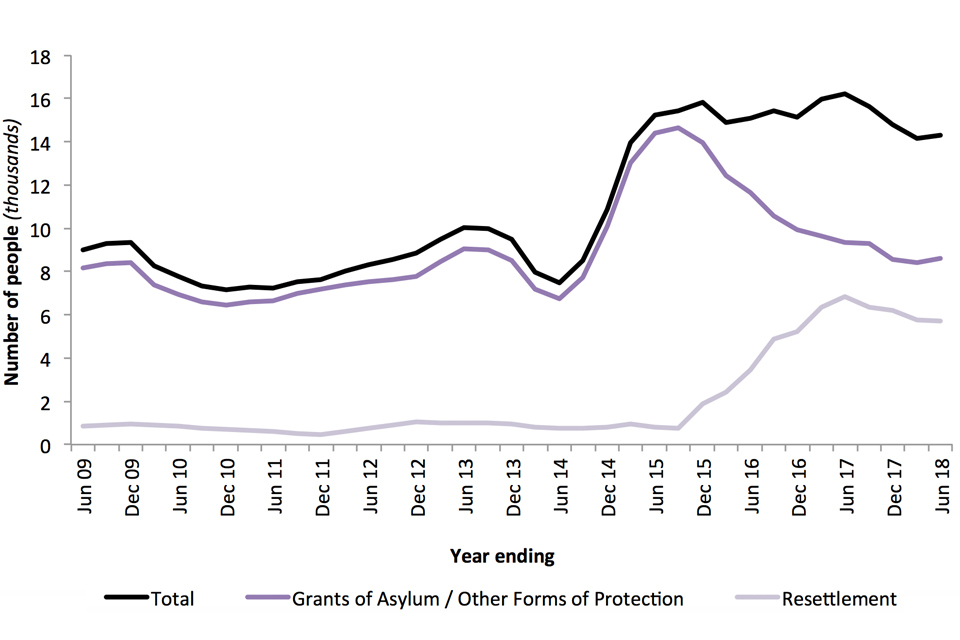
The chart shows the number of people granted asylum and other forms of protection and resettlement (main applicants and dependants), over the last 10 years.
Source:
Table as 02 q (asylum tables, volume 1) and Table as 19 q (asylum tables, volume 4).
Chart notes:
- Resettlement data prior to 2013 are only available annually. Data for individual quarters in this period have been estimated by taking 25% of the annual total.
- Main applicants and dependants.
2.1 Asylum applications by nationality
The nationalities with the largest numbers of asylum applications in the year ending June 2018, change in applications since the preceding year, and also the grant rates for the year ending June 2018, are summarised in the following table.
Asylum applications and grant rates1, by nationality (top 10), year ending June 2018 compared to the year ending June 2017
| Country of nationality | Number of applications | Change2 | % Change2 | Grant rate |
|---|---|---|---|---|
| Iran | 2,440 | -409 | -14% | 41% |
| Iraq | 2,405 | +102 | +4% | 21% |
| Pakistan | 2,313 | -285 | -11% | 14% |
| Sudan | 1,641 | +51 | +3% | 34% |
| Albania | 1,537 | +59 | +4% | 11% |
| Eritrea | 1,526 | +380 | +33% | 74% |
| Bangladesh | 1,502 | -318 | -17% | 5% |
| Afghanistan | 1,380 | -416 | -23% | 38% |
| India | 1,191 | -330 | -22% | 2% |
| Vietnam | 1,070 | +91 | +9% | 39% |
Source:
Table as 01 q (asylum tables, volume 1)
Table notes:
- Main applicants.
- Changes are relative to the year ending June 2017.
This reflects the second consecutive year in which the number of applications from Iranian nationals has fallen - from 4,905 in the year ending June 2016 to 2,440 this year, - a decrease of 50% over 2 years.
For Albania, this is the fifth consecutive year in which the number of asylum applications has remained approximately constant.
The likelihood of being granted asylum following an application varies considerably for different nationalities.
The diagram shows the nationalities with the largest changes in the number of asylum applications (main applicants) in the last year.
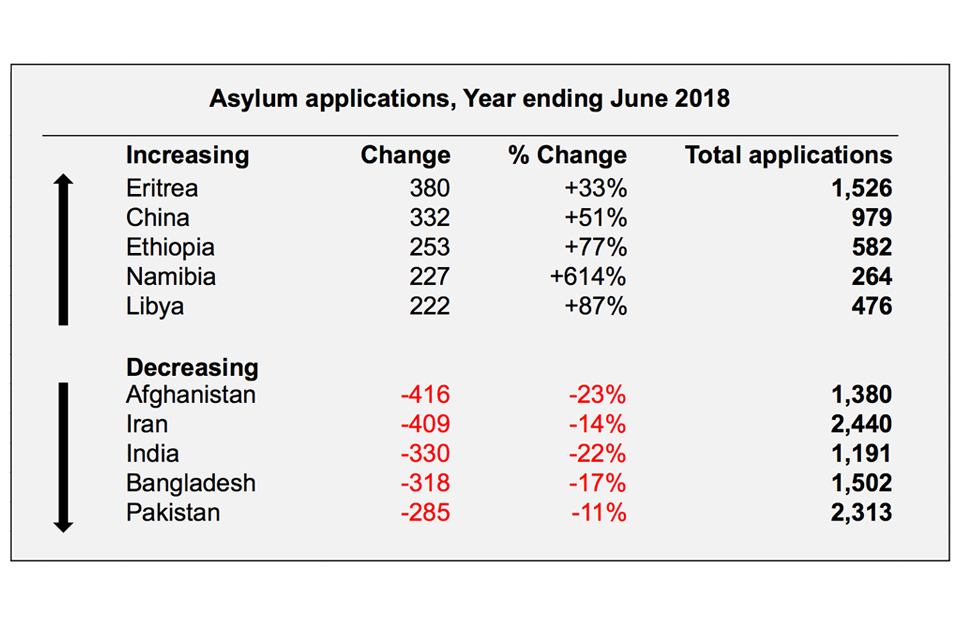
Not supplied by author.
Source:
Table as 01 q (asylum tables, volume 1)
In the year ending June 2018, the number of applications from Syrian nationals fell 21% compared with the previous year (from 784 to 623), representing a fall in applications for the second consecutive year. The number of applications from Syrian nationals is now less than a quarter of the peak in the year ending June 2016 (2,543).
Additionally, Syrian nationals are granted protection under the Vulnerable Persons Resettlement Scheme. In the latest year, there has been a reduction in both the number of Syrian nationals granted asylum (down 35% from 1,093 to 712) and a decrease in the number of Syrian nationals being granted protection in the UK through other means such as the VPRS (down 24% from 5,637 to 4,311).
2.2 Asylum applications by age and sex
Data in this section relate to the calendar year 2017 (the latest available data on asylum applications broken down by age group and sex).
Of the 26,547 asylum applications in 2017, 72% of main applicants were male and 28% were female, although this varied by nationality. For example, 49% of Nigerian main applicants were female, compared with just 7% of Sudanese main applicants.
This is the second consecutive year in which the proportion of females has increased (up 7 percentage points from 21% in 2015). This reflects a return to proportions seen before the European migration crisis in 2015.
Of the 26,547 applications, 23% of main applicants were aged 25 to 29, the highest proportion contributed by any single age group. A further 10% were children, although this varied by nationality. For example, 33% of all Eritrean main applicants were children, compared to less than 1% of Bangladeshi main applicants.
In the year ending June 2018, 8,606 people were granted asylum or another form of protection. Of these, 3,251 (38%) were children.
Of the 5,797 initial decisions relating to female applicants, 35% were grants of asylum or another form of protection. This was similar to the grant rate for male applicants (15,472 initial decisions), for whom 31% of initial decisions were grants of asylum or another form of protection.
Asylum applications1, by age group, sex, and nationality (top 10), 2017
| Country of Nationality | Number of Applications | % Males | % Children | % Age 25–29 |
|---|---|---|---|---|
| Iran | 2,570 | 75% | 9% | 21% |
| Pakistan | 2,495 | 81% | 1% | 30% |
| Iraq | 2,379 | 69% | 12% | 25% |
| Bangladesh | 1,712 | 91% | 0% | 30% |
| Sudan | 1,685 | 93% | 20% | 28% |
| Albania | 1,430 | 52% | 19% | 26% |
| India | 1,327 | 75% | 0% | 29% |
| Afghanistan | 1,326 | 88% | 20% | 18% |
| Eritrea | 1,085 | 81% | 33% | 22% |
| Vietnam | 1,070 | 64% | 28% | 15% |
Source:
Table as 03 (asylum tables, volume 2)
Table note:
- Main applicants.
Asylum applicantions1 by age group and sex, 2017
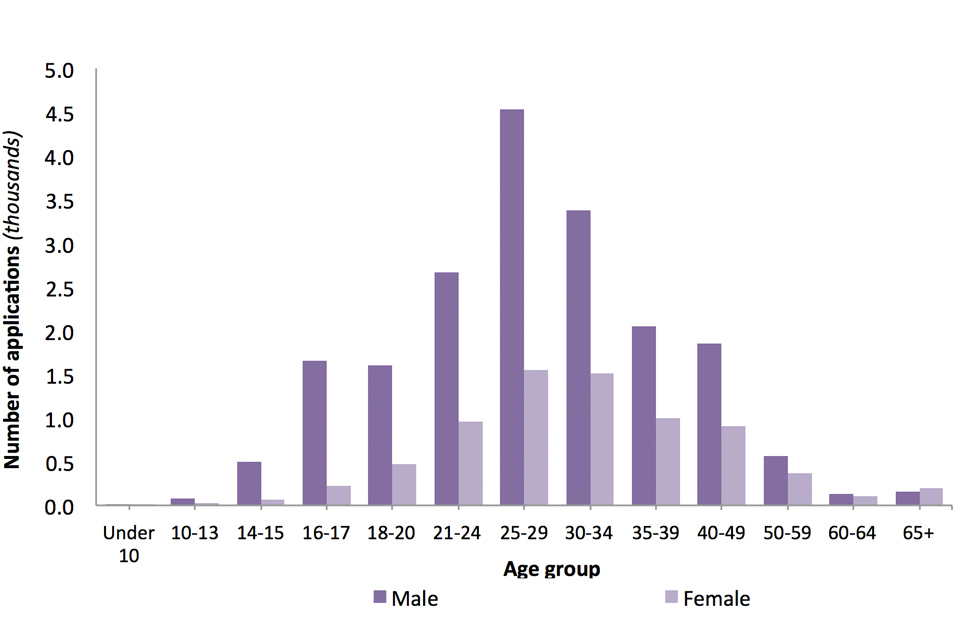
The chart shows the number of asylum applications made in each age group, broken down by sex, in the year ending June 2018.
Source:
Table as 03 (asylum tables, volume 2)
Chart note:
- Main applicants.
3. Unaccompanied asylum-seeking children
An unaccompanied asylum-seeking child (UASC) is a person under 18 years old – or who, in the absence of documentary evidence establishing age, appears to be under 18 – with no relative or guardian in the UK, who is applying for asylum in his or her own right.
There were 2,424 asylum applications from UASC in the year ending June 2018, a 20% decrease compared to the previous year, after 2 consecutively high years.
Half of UASC applications come from just 4 nationalities. The largest numbers of asylum applications from UASC were from Sudanese and Eritrean nationals, together accounting for over 30% of all UASC applications. This was followed by Vietnamese nationals (11%) and Albanian nationals (10%). Sudan saw an increase in applications of 13% compared to the previous year, whereas Albania saw a decrease of 31%.
Of the 2,240 initial decisions relating to UASC made in the year ending June 2018, 1,166 (52%) were grants of asylum or another form of protection, and an additional 397 (18%) were UASC leave (granted to UASCs refused asylum, but eligible for temporary leave). This grant rate is higher than the grant rate for all applications (29%).
A further 30% of UASC applicants were refused. This will include those from countries where it is safe to return children to their families, as well as applicants who were determined to be over 18 following an age assessment.
Data on UASC can be found in Asylum tables as 08 to as 10 (volume 3).
4. Support provided to asylum seekers
A new asylum support casework system was introduced from 12 March 2018. Agreed criteria for reporting on the published statistics have not yet been finalised in the new system. There has been a careful quality assurance process undertaken, which has led us to believe the new data to be robust; data for 2018 Q2 should be considered provisional until this transitional work has been completed. As a result, data for this quarter will be subject to revision.
Section 95 support is provided to destitute asylum seekers until their claim is finally determined. Section 95 support can be provided as either accommodation or subsistence, or both.
Data from June 2018 show a total of 42,808 people in the UK were in receipt of support under Section 95 of the Immigration and Asylum Act 1999. This number is 10% higher than in the previous year, and is the sixth consecutive year in which the number of people supported under Section 95 has increased. However, the total figure remains considerably below that for the end of December 2003 (the start of the published data series), when there were 80,123 people in receipt of Section 95 support.
As at the end of December 2017, 3,649 (5.9 per thousand population) asylum seekers with an address registered in Glasgow City were in receipt of Section 95 support, the highest of all local authorities. There were a further 15 local authorities in which more than three asylum seekers per thousand population were provided support.
Asylum seekers supported under Section 951,2, by local authority3, as at end of December 2017
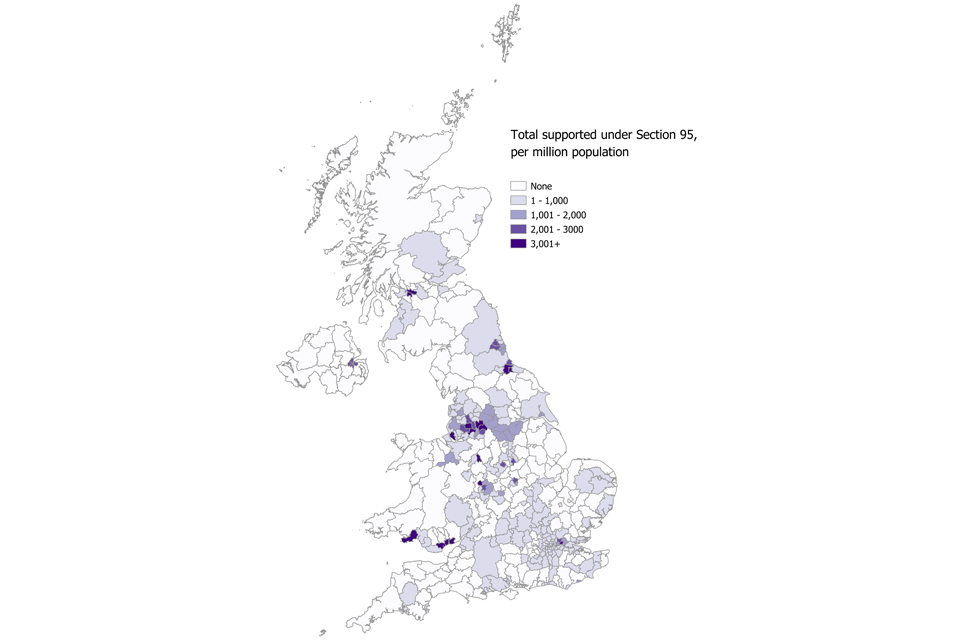
The chart shows the number of people per million of the population in receipt of Section 95 support, by Local Authority as at the end of December 2017.
Source:
Table as 16 q (asylum tables, volume 4)
Chart notes:
- Main applicants and dependants.
- Data presented are for number of people supported under Section 95, per million population, at end of December 2017.
- Local authority data are based on the registered address of the asylum seeker. This is not necessarily the location at which the individual regularly resides.
Section 4 provides support for individuals whose asylum application has been determined as refused and appeals rights are exhausted, but who are destitute, and where there are reasons that temporarily prevent them from leaving the UK. See the user guide for more details.
Section 4(1)(a) (b) and (c) of the Immigration and Asylum Act 1999 had provided the Secretary of State with the power to provide accommodation and support for persons temporarily admitted to the United Kingdom, released from detention, or released on bail from detention. These provisions were repealed with effect from 15 January 2018, to coincide with the commencement of Schedule 10 to the Immigration Act 2016. Paragraph 9 of Schedule 10 provides a replacement means of providing support to individuals granted immigration bail, if they meet published criteria.
This change has not yet had an impact on the number in receipt of Section 4 support, although it has resulted in a fall in the number of Section 4 grants (from 1,389 in 2017 Q4 to 404 in 2018 Q2).
At the end of June 2018, there were 4,179 people receiving support under Section 4 of the Immigration and Asylum Act 1999, an 8% increase from the previous year. The number of main applicants granted support under Section 4 fell for the second consecutive quarter since the beginning of 2018, as a direct result of the changes in legislation outlined previously which means that no new applications for Section 4(1) support may be filed.
Data on support provided to asylum seekers can be found in Asylum tables volume 4, as 15 to as 18.
5. Resettlement
In addition to those who are granted asylum in the UK, resettlement schemes are offered to those who have been referred to the Home Office by The United Nations Refugee Agency (UNHCR). Details on specific resettlement schemes can be found in the user guide.
The number of people resettled in the UK increased in each consecutive year, from the year ending June 2014 to June 2017, driven predominantly by increases in resettlement under the VPRS. In the year ending June 2018, a total of 5,702 (down 17%) people were resettled in the UK under various resettlement schemes, a decrease of 17% compared with the previous year. This consisted of:
- 4,316 under the Vulnerable Person Resettlement Scheme (VPRS)
- 603 under the Vulnerable Children Resettlement Scheme (VCRS)
- 766 under the Gateway Protection Programme
- 17 under the Mandate Scheme
Of those resettled in the UK in the year ending June 2018, 2,817 were children (under 18 years old). Children accounted for 49% of all those resettled, a similar proportion to the previous year (50%). This was higher than the proportion of those granted protection through asylum routes, for which 38% were children.
5.1 Vulnerable Persons Resettlement Scheme (VPRS)
On 7 September 2015, an expansion to the existing VPRS was announced. Through this expansion, it was proposed that 20,000 Syrians in need of protection be resettled in the UK by 2020. On 3 July 2017, the VPRS was expanded to include vulnerable refugees of any nationality, who have fled the conflict in Syria and are unable to safely return to their home country.
A total of 12,851 people have been resettled under the VPRS since the scheme began in 2014. In the year ending June 2018, 4,316 people were resettled under the VPRS across 223 different local authorities, of whom 2,125 were children (49%).
Resettlement data can be found in Asylum tables as 19 and as 20 volume 4.
6. Family reunion visas
A Family reunion visa allows a spouse, or partner and children (under the age of 18) of those granted refugee status or humanitarian protection in the UK, to reunite with them in the UK.
Family reunion visas are a subset of the ‘Family: other’ visa category. Around 99% of ‘Family: other’ visa grants, as published in the visa tables, relate to Family reunion visas. However, data on Family reunion visas come from a different administrative system to other visa data so are not directly comparable. Data on the number of applications and their outcome for ‘Family: other’ visas are found in Table vi 01 q.
In the year ending June 2018, 5,963 Family reunion visas were issued to partners and children of those granted asylum or humanitarian protection. Of these, 2,890 (48%) were children.
Family reunion data can be found in Asylum table volume 5, as 21. Further information on family reunion can be found in the user guide.
7. International comparisons
Figures in this section are based on data supplied by the individual countries to the Intergovernmental Consultations on Migration, Asylum and Refugees (IGC), UNHCR and Eurostat. Not all countries provide the latest data in time for each quarterly ‘Immigration Statistics’ release. Where a figure is unavailable for a given month, data are estimated using the average of the last 3 months available. If the time series is erratic, the average of the last 12 months is taken.
Including dependants, the total number of asylum applications to the EU in the year ending June 2018 was an estimated 633,300, a decrease of 32% compared to the previous year (932,400).
Asylum applications received by the UK and other EU countries (top 5), year ending June 20181,2,3,4
| Country of application | Total applications | % change |
|---|---|---|
| Germany | 168,000 | -61% |
| France | 108,200 | +17% |
| Italy | 101,900 | -29% |
| Greece | 57,900 | +16% |
| Spain | 37,300 | +58% |
| United Kingdom | 34,700 | -2% |
Source:
Table as 07 q (asylum tables, volume 3)
Table notes:
- Eurostat figures are rounded to the nearest 5 and so may not sum to the total.
- The estimated figures in this chart are based on data supplied to IGC and UNHCR.
- Main applicants and dependants.
- Changes are relative to the year ending June 2017.
8. Outcome of asylum applications
The most recent data report on the initial decisions made on asylum applications by the Home Office. However, some decisions will be challenged at the HM Courts and Tribunals Service (HMCTS), an executive agency of the Ministry of Justice, which considers appeals against the asylum decisions made by the Home Office.
The Home Office produces an analysis of applications for whole year cohorts of asylum seekers, in order to calculate the overall success rates following appeal. For older years, this will provide the most complete description of the outcome for asylum seekers. However, for the most recent years, a large number of cases will still be outstanding (see chart in section 8.2), as not all cases will have had sufficient time to be completed. The analysis therefore only provides a ‘snapshot’ of the recorded outcomes of the group (or cohort) of asylum applicants in any one year, at a particular time. This dataset is updated, in full, annually and is currently available up to 2017.
The chart below gives an illustration of outcomes in the asylum system in the UK, for applications made in the years 2014 to 2016 (inclusive), where the outcome is known.
Of those applications received between 2014 and 2016, 35% were granted at initial decision. The majority (61%) of initial decisions were subsequently appealed, and after further consideration by HMCTS, 39% of appeals were allowed. The grant rate increased from 35% at initial decision, to 52% following appeal.
Outcomes of asylum applications where outcomes is known, 2014 to 20161,2,3,4
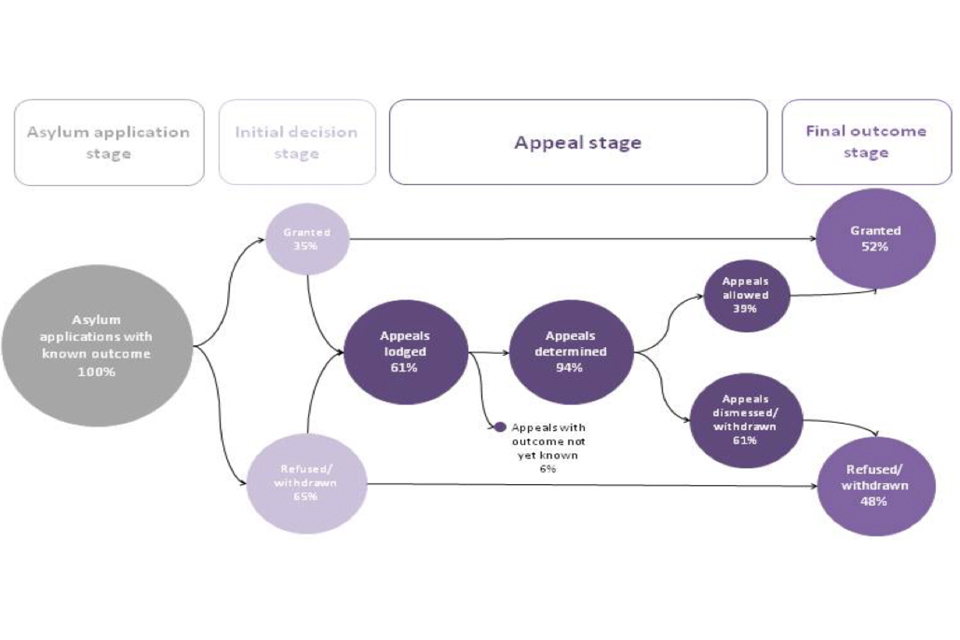
This flow chart shows the outcome of all asylum applications made between 2014 and 2016, where the case is closed and the outcome is known.
Source:
Table as 06 (asylum tables, volume 2)
Chart notes:
- Appeals lodged are represented as a proportion of all initial decisions (except grants of asylum) and withdrawn applications.
- Data include all asylum applications where the application raised date was between 2014 and 2016.
- Cases where initial decision is unknown are not included in this analysis.
- Grant rates shown here relate to the outcomes of total applications made in each cohort year, and take withdrawn applications into account.
8.1 Latest outcomes for applications made in 2017
The outcomes for the 26,547 main applicants who applied for asylum in 2017, as with previous cohorts, will be updated in subsequent annual reports. However, as at May 2018 (the point of data extraction), it is estimated that:
- 5,280 (20%) main applicants were granted asylum, humanitarian protection or discretionary leave, either at initial decision or after appeal
- 9,641 (36%) were refused or withdrawn
- 11,626 (44%) were awaiting an outcome (either an initial decision or an appeal outcome)
As the 11,626 cases awaiting an outcome are completed, the number of grants and refusals will increase.
Outcome of asylum applications, by type of outcome, 2008 to 20171,2
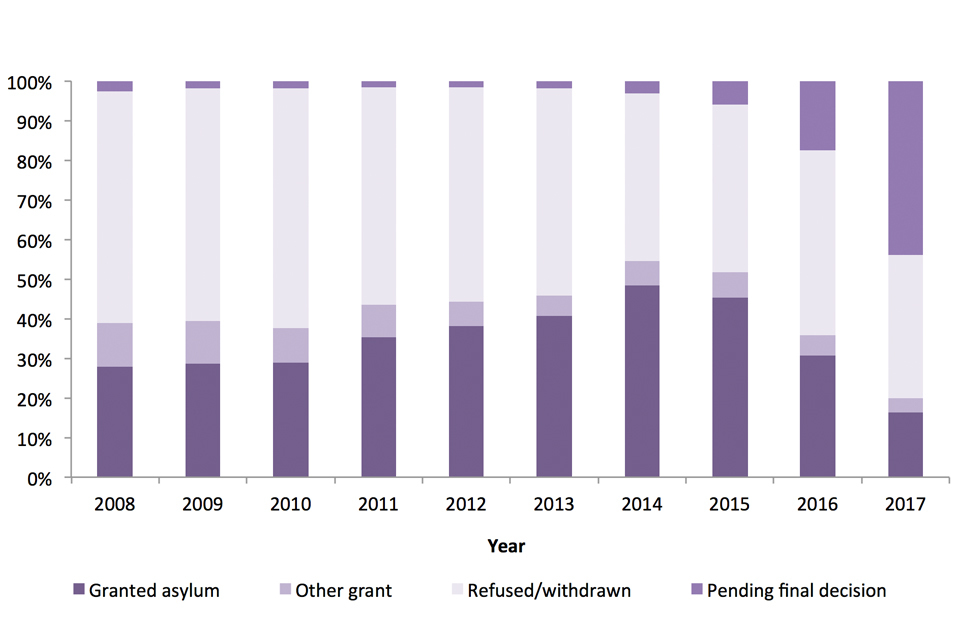
The chart shows the latest outcome of asylum applications made between 2008 and 2017, as at May 2018.
Source:
Table as 06 (asylum tables, volume 2)
Chart notes:
- Data are based on date of application, and the outcomes are as at the point of data extraction in May 2018.
- The proportion of applications awaiting an outcome (either an initial decision or an appeal) will be lower in earlier years as more time has elapsed for the cases to be processed than those from more recent years.
The overall proportion of applications granted asylum or an alternative form of protection, either at initial decision or after appeal, was estimated to be 26% in 2004; this proportion has steadily increased to 55% of applications made in 2015 (where the outcome is known).
In addition, the outcome analysis also shows how the final grant rates vary by country of nationality. For example, of known outcomes for asylum applications raised in 2017, it is estimated that 64% of Syrians were granted asylum or another form of protection following initial decision and appeal, compared with 20% of Iraqi nationals.
9. Data tables
Data referred to here can be found in the following tables:
Asylum tables volume 1
Asylum tables volume 2
Asylum tables volume 3
Asylum tables volume 4
Asylum tables volume 5