How many people are detained or returned?
Published 23 August 2018

© Crown copyright 2018
This publication is licensed under the terms of the Open Government Licence v3.0 except where otherwise stated. To view this licence, visit nationalarchives.gov.uk/doc/open-government-licence/version/3 or write to the Information Policy Team, The National Archives, Kew, London TW9 4DU, or email: psi@nationalarchives.gov.uk.
Where we have identified any third party copyright information you will need to obtain permission from the copyright holders concerned.
This publication is available at https://www.gov.uk/government/statistics/immigration-statistics-year-ending-june-2018/how-many-people-are-detained-or-returned
We welcome your feedback
The content and format of the quarterly release and associated data tables is currently being reviewed. This means the release may be subject to change in the future. If you have any comments, or suggestions for the development of this report, please provide feedback by emailing MigrationStatsEnquiries@homeoffice.gov.uk. Please include the words ‘PUBLICATION FEEDBACK’ in the subject of your email.
The Home Office is also running a more general survey on Home Office statistical publications, which covers all Home Office statistical publications.
See section 6 of the About this release section for more details.
Back to ‘Immigration statistics, year ending June 2018’ content page.
This is not the latest release. View latest release.
Data relate to the year ending June 2018 and all comparisons are with the year ending June 2017, unless indicated otherwise.
This section contains data on:
- individuals held in immigration detention (solely under Immigration Act powers)
- returns of people, by the Home Office, who do not have any legal right to stay in the UK
1. Key facts
In the year ending June 2018, 26,215 individuals entered the detention estate (down 6% compared with the previous year) and 27,481 left the detention estate (down 1%).
At the end of June 2018, there were 1,905 persons held in the detention estate (excluding HM Prisons), a fall of 36% compared with the same date 12 months earlier. Additionally, 321 individuals were held in immigration detention in HM Prisons.
The total number of enforced returns from the UK, decreased by 13% to 10,892 in the year ending June 2018 compared with 12,509 in the previous year.
Provisional data show that 5,724 Foreign National Offenders (FNOs) were returned in the year ending June 2018, down 8% compared to 6,238 in the previous year; of these:
- just over two thirds (68%) were EU nationals (3,905)
- just under one third (32%) were non-EU nationals (1,819)
2. Immigration detention
2.1 Detention
From July 2017, data on detention of immigration detainees in prisons are included in the immigration detention figures. Previously, individuals who were detained in prison would have been recorded in the data upon entering the detention estate through an immigration removal centre (IRC), short-term holding facility (STHF) or pre-departure accommodation (PDA); now they are recorded upon entering immigration detention within prison. Data from Q3 2017 onwards are therefore, not directly comparable with earlier data. Further details of these changes can be found in the user guide.
In the year ending June 2018, 26,215 people entered the detention estate. This was down 6% on the previous year, and represents a fall for the third consecutive year.
People entering detention, year ending December 2009 to the year ending June 20181

The chart shows the number of people entering detention over the last 10 years.
Source:
Table dt 01 q (detention tables)
Chart note:
- Prior to July 2017, those entering detention in prisons would not be counted in the entering figures until they entered the detention estate. These cases are now included when entering immigration detention in prison. This means those entering through prisons will be recorded earlier than previously, and those who were not moved from the prison to the detention estate would not previously have been counted.
As at the end of June 2018, there were 1,905 people in the detention estate (excluding prisons). This was 36% lower than the same time the previous year. In addition, 321 immigration detainees were held in HM Prisons.
At the end of June 2018, there were 325 EU nationals, and 1,901 non-EU nationals in detention (including prisons).
People entering, leaving, and in detention, year ending June 2014 to the year ending June 20181,3
| Year ending | Entering detention | Leaving detention | In detention2 | In detention (excl. HM Prisons) |
|---|---|---|---|---|
| June 2014 | 29,122 | 29,055 | z | 3,079 |
| June 2015 | 32,053 | 31,649 | z | 3,418 |
| June 2016 | 31,593 | 32,067 | z | 2,878 |
| June 2017 | 27,817 | 27,871 | z | 2,994 |
| June 2018 | 26,215 | 27,481 | 2,226 | 1,905 |
| Change: latest year | -1,602 | -390 | z | -1,089 |
| Percentage change | -6% | -1% | z | -36% |
Sources:
Table dt 01 q (detention tables)
Table dt 08 q (detention tables)
Table dt 13 q (detention tables)
Table notes:
- Data from July 2017 includes those entering and leaving detention through HM Prisons, as well as those held in detention in HM Prisons. Data are not directly comparable with previous years. See the user guide for more details.
- Data on those in detention are as at the end of June each year.
- z = not applicable.
2.2 Reason for leaving detention
Following the introduction of the new Immigration Bail in Schedule 10 of the Immigration Bill 2016, the detention closed reasons ‘Bailed (Secretary of State)’ replaced the existing powers of ‘Granted temporary admission/release’ from 15/01/2018, and ‘Bailed (Immigration Judge)’ replaced ‘Bailed’ to differentiate from ‘Bailed (Secretary of State (SoS))’. See the user guide for more details of this change.
Of the 27,481 leaving detention in the year ending June 2018, 45% were returned from the UK, compared with 48% in the year ending June 2017.
People leaving detention, by reason for leaving and nationality (top 5), year ending June 2018
| Nationality | Leaving detention | % Returned from the UK1 | % Bailed (SoS)2 | % Other reason3 |
|---|---|---|---|---|
| Pakistani | 2,462 | 26% | 45% | 28% |
| Albanian | 2,449 | 71% | 14% | 15% |
| Indian | 2,073 | 28% | 44% | 29% |
| Romanian | 1,697 | 92% | 3% | 5% |
| Bangladeshi | 1,334 | 22% | 52% | 26% |
| Other nationalities | 17,466 | 43% | 39% | 18% |
| Total | 27,481 | 45% | 36% | 19% |
Source:
Table dt 08 q (detention tables)
Table notes:
- ‘Returned from UK on leaving detention’ includes enforced returns, voluntary returns and those refused entry at port (in the UK) who were subsequently detained and then departed the UK.
- Detention closed reason: Bailed (Secretary of State) replaced the existing powers of Granted temporary admission/release from 15/01/2018, following the introduction of the new Immigration Bail in Schedule 10 of the Immigration Bill 2016.
- Other reason on leaving detention includes Bailed (Immigration Judge), Granted Leave to Enter/Remain and Other category.
2.3 Length of detention
Just under two thirds (64%) of immigration detainees were held for less than 29 days, a stable proportion over recent years. In the year ending June 2018, 9% had been held for 4 months or more by the time they left detention.
People leaving detention, by length of detention, year ending June 2014 to the year ending June 20181
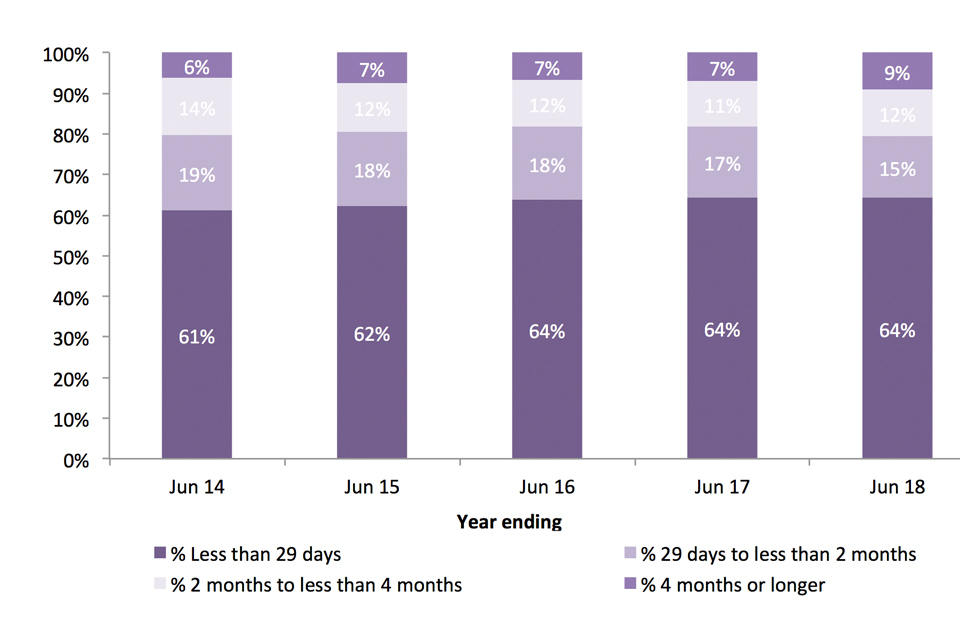
The chart shows People leaving detention, by length of detention, over the last 5 years.
Source:
Table dt 06 q (detention tables)
Chart note:
- Data from July 2017 includes those leaving detention through HM Prisons. Data are not directly comparable with previous years. See the user guide for more details.
3. Returns
The total number of enforced returns from the UK, decreased by 13% to 10,892 in the year ending June 2018 compared with 12,509 in the year ending June 2017; of these:
- 25% of the total were enforced returns of people who had previously sought asylum (2,734 compared to 22% in the year ending June 2017 (2,748)
Returns from the UK, by type of return, year ending June 2015 to the year ending June 2018
| Year ending | Total enforced returns1 | Total voluntary returns2 | Total refused entry at port who subsequently departed |
|---|---|---|---|
| June 2015 | 14,093 | 25,856 | 16,725 |
| June 2016 | 12,944 | 28,784 | 18,367 |
| June 2017 | 12,509 | 23,861 | 17,203 |
| June 2018 | 10,892 | 16,854 | 18,285 |
| Change: latest 12 months | -1,617 | - | +1,082 |
| Percentage change | -13% | - | +6% |
Source:
Table rt 01 q (Returns tables, volume 1)
Table notes:
- ‘Enforced returns’ cover enforced removals from detention, non-detained enforced removals and other returns from detention where the Home Office will have been required to facilitate or monitor the return.
- ‘Voluntary returns’ include a variety of departures, including assisted voluntary returns, controlled returns and other verified returns (for example, through data matching). These are subject to significant upward revision as matching checks are made on travellers after departure. Comparisons with the previous 12 months for voluntary returns have not been included as data are not comparable over time.
Enforced returns from the UK, by nationality (top 5), year ending June 2018
| Nationality | Total enforced returns1 | % of Total enforced returns |
|---|---|---|
| Albania | 1,618 | 15% |
| Romania | 1,440 | 13% |
| Poland | 994 | 9% |
| Pakistan | 663 | 6% |
| India | 589 | 5% |
| Other Nationalities | 5,588 | 51% |
| Total | 10,892 | - |
Source:
Table rt 02 q (Returns tables, volume 1)
Table note:
See notes above.
Returns of EU and non-EU nationals, by type of return, year ending June 2015 to the year ending June 2018
EU nationals may be returned for not exercising, or abusing, Treaty rights or for deportation on public policy grounds (such as criminality).
| Year ending | June 2015 | June 2016 | June 2017 | June 2018 | Change: latest year | Percentage change |
|---|---|---|---|---|---|---|
| Total enforced returns1 | 14,093 | 12,944 | 12,509 | 10,892 | -1,617 | -13% |
| EU | 3,435 | 4,424 | 5,249 | 4,262 | -987 | -19% |
| Non-EU | 10,658 | 8,520 | 7,260 | 6,630 | -630 | -9% |
| Total voluntary returns2 | 25,856 | 28,784 | 23,861 | 16,854 | - | - |
| EU | 560 | 673 | 876 | 389 | - | - |
| Non-EU | 25,296 | 28,111 | 22,985 | 16,465 | - | - |
| Total refused entry at port who subsequently departed | 16,725 | 18,367 | 17,203 | 18,285 | +1,082 | +6% |
| EU | 1,721 | 2,158 | 2,798 | 3,603 | +805 | +29% |
| Non-EU | 15,004 | 16,209 | 14,405 | 14,682 | +277 | +2% |
Source:
Table rt 02 q (Returns tables, volume 1)
Table note:
See notes above.
In the year ending June 2018, 5,724 Foreign National Offenders (FNOs) were returned from the UK, of which just over two-thirds were EU nationals. Of those FNOs that were returned, 12% were known to have an overseas criminal record. Data on FNO returns can be found in Table rt 06 q.
4. Data tables
Data referred to here can be found in the following tables:
Returns tables volume 1
Returns tables volume 2
Returns tables volume 3
Returns tables volume 4
Returns tables volume 5
Detention tables