Study
Published 1 December 2016

© Crown copyright 2016
This publication is licensed under the terms of the Open Government Licence v3.0 except where otherwise stated. To view this licence, visit nationalarchives.gov.uk/doc/open-government-licence/version/3 or write to the Information Policy Team, The National Archives, Kew, London TW9 4DU, or email: psi@nationalarchives.gov.uk.
Where we have identified any third party copyright information you will need to obtain permission from the copyright holders concerned.
This publication is available at https://www.gov.uk/government/statistics/immigration-statistics-july-to-september-2016/study
Valid: 01 December 2016 to 22 February 2017
Data relate to the year ending September 2016 and all comparisons are with the year ending September 2015, unless indicated otherwise.
Back to ‘Immigration statistics July to September 2016’ content page.
This is not the latest release. View latest release.
1. Key facts
In the year ending September 2016, there were 207,522 study-related visas granted, 3% lower than the previous year. This includes dependants but excludes the unsponsored short-term student category, formerly known as ‘student visitors’). Over the same period, the number of university-sponsored study visa applications (main applicants) fell slightly by 1% to 167,208. However, there was a 6% increase for Russell Group universities to 80,192. There were also falls for the Further education (8% to 14,825), English language school (9% to 2,792), and Independent school (3% to 13,340) sectors. Most of the fall in the Further education sector’s sponsored visa applications since the peak in mid-2011 was accounted for by licenses which have since been revoked.
In the year ending June 2016, the Office for National Statistics (ONS) estimates that there were 113,000 non-European Union (EU) long-term immigrants coming to study and who had an intention to remain a year or more; 18,000 lower than the preceding year but not a statistically significant change.
By contrast, in the year ending June 2016, ONS also estimates that the number of non-EU former students who were long-term emigrants from the UK had risen to 45,000, although this was not a statistically significant increase from 38,000 in the previous 12 months. Although they relate to different cohorts of students, the difference between the number of long-term students entering the UK (113,000) and the number of former students departing (45,000) was around 68,000.
Five non-EU nationalities accounted for the majority (57%) of the 207,522 study-related visas granted in the year ending September 2016, with the largest number by far going to Chinese nationals (76,577 or 37% of the total). There were increases for the following nationals: Chinese (+6,259 or +9%), Kuwaiti (+636 or +27%), Indonesian (+478 or +18%), and Pakistani (+297 or +10%); but falls for Nigerian (-2,709; -28%), Malaysian (-1,904; -19%), and Brazilian (-1,526; -64%).
Study-related grants of extensions fell by 25% or 17,195 to 52,060 in the year ending September 2016. This reflected 25% fewer sponsored applications for extensions (main applicants), mostly accounted for by the University sector with a fall of 8,429 (16%), and Further education sector with a fall of 5,975 (83%).
There were 306,000 short-term student category admissions in the calendar year 2015, much higher than the numbers of short-term student category visas granted (62,608 over the same period). This was due to many short-term student admissions being from nationalities who were not required to obtain a visa if they wished to come to the UK as a short-term student (previously referred to as ‘student visitor’) for up to a maximum of 6 months. More than half of the short-term student admissions are accounted for by US nationals (185,000), who do not require a visa for these short visits.
2. Study immigration: latest trends
| Year ending September 2015 | Year ending September 2016 | Change | Percentage change | |
|---|---|---|---|---|
| Study-related visas granted excluding short-term study category (1) | 213,438 | 207,522 | -5,916 | -3% |
| of which (Top 5): | ||||
| China | 70,318 | 76,577 | +6,259 | +9% |
| United States | 14,240 | 14,166 | -74 | -1% |
| India | 11,650 | 11,121 | -529 | -5% |
| Hong Kong | 9,025 | 8,923 | -102 | -1% |
| Saudi Arabia | 9,505 | 8,491 | -1,014 | -11% |
| Short-term study visas (1) (main applicants only) | 62,175 | 86,149 | +23,974 | +39% |
| Year ending June 2015 | Year ending June 2016 | Change | Percentage change | |
| Long-term immigration for study excluding dependants (2) | 131,000 | 113,000 | -18,000 | -14% |
| Long-term (1 year or more) study-related visas excluding dependants | 139,894 | 136,661 | -3,233 | -2% |
2.1 Table notes
Source: Home Office, Immigration Statistics July to September 2016, Visas table vi 04 q (Visas volume 1) and Visas table vi 06 q s (Visas volume 3), International Passenger Survey (IPS), ONS, Migration Statistics Quarterly Report.
(1) The short-term study category (previously described as Student visitor) allows individuals to come to the UK for 6 months (or 11 months if they will be studying an English language course) and cannot extend their stay (further details at Short-term study visa). For consistency and comparability over time, short-term study visas have been excluded from study-related totals.
(2) Immigration for study data are estimates of the number of non-EU nationals intending to change their residence to the UK for at least 12 months based on the IPS.
3. Long-term trends in student immigration
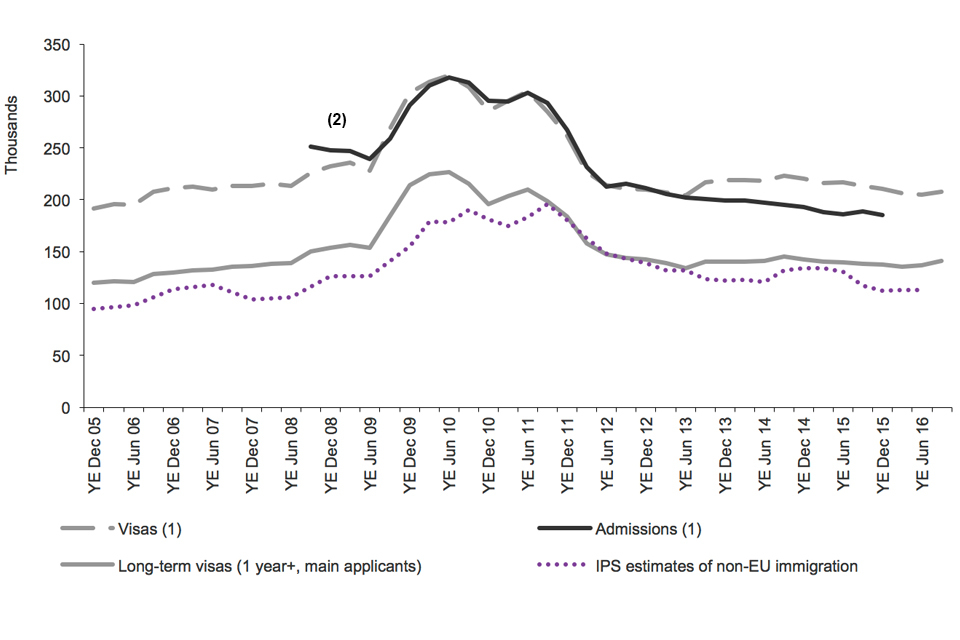
The chart shows the trends for study of visas granted, admissions and IPS estimates of non-EU immigration. The data are sourced from Tables vi 04 q and ad 02 q and corresponding datasets.
3.1 Chart notes
Source: Home Office, Immigration Statistics July to September 2016, Visas tables vi 04 q (Visas volume 1), Admissions table ad 02 q and corresponding datasets; ONS, Population and migration.
(1) Excludes short-term students (previously referred to as Student visitors) who are allowed to come to the UK for 6 months (or 11 months if they will be studying an English language course) and cannot extend their stay. A proportion of Tier 4 student visas are also short-term (under 1 year), but are not included within the short-term student category (see Entry clearance visas by length).
(2) Prior to the year ending September 2008, the count of student admissions is not comparable as there was no specific admissions category for short-term students (previously referred to as Student visitors) who may then have been recorded as either students or visitors.
The above chart shows that IPS long-term immigration estimates, while being substantially lower as they cover only those intending to remain a year or more, have followed a broadly similar trend to student visas granted and passenger arrivals over the longer term.
There are a range of potential reasons why IPS figures for long-term migrants may be different from figures for study visas granted or passenger arrivals, and hence why the trends in the different series do not match. These include:
- sampling variation in the IPS (for example, the fall of 18,000 in non-EU study-related immigration for the year ending June 2016 had an estimated confidence interval of +/-21,000)
- IPS data for study relate to individuals whose main reason for migration was study so (unlike visas data) are likely to exclude their dependants; IPS data are likely to be more comparable with visa totals for main applicants than with the total for all study-related visas (e.g. including dependants)
- differences between intentions and visa length
- individuals may migrate for multiple different reasons
- timing differences between when visas are granted and when an individual actually travels
- visa and admissions data include dependants, and both short- and long-term migrants
Further comparison of the data is described in the ONS publication ‘International student migration what do the statistics tell us? (PDF 619Kb) and the user guide.
4. Register of sponsoring educational institutions
On 30 September 2016, there were 1,362 educational institutions on the UK Visas and Immigration register of sponsoring educational institutions. This was 1% fewer than the number on 30 June 2016 (1,380), and 7% lower (1,466) than a year earlier (30 September 2015), which continues the reduction in numbers seen since the published series began in October 2011 (2,370). The long-term reduction in the number of sponsoring educational institutions is consistent with the introduction of new accreditation criteria and conditions of status for educational sponsors from April 2011, as well as the removal from the list of sponsors of organisations which have since ceased operation.
5. Sponsored study visa applications by education sector
The number of study-related sponsored visa applications (main applicants) fell 2% in the year ending September 2016 to 200,653, compared with the previous 12 months (204,140). There was a fall of 1% to 167,208 in sponsored visa applications for the University sector as a whole, but this included a 6% increase for Russell Group universities to 80,192 and an 6% decrease for other universities to 87,016. Over the longer term, the number of visas issued to study at universities has been broadly flat since 2013.
In the latest year, there were falls in the Further education (8% to 14,825), English language schools (9% to 2,792) and Independent school (3% to 13,340) sectors.
5.1 Study-related sponsored visa applications by sector
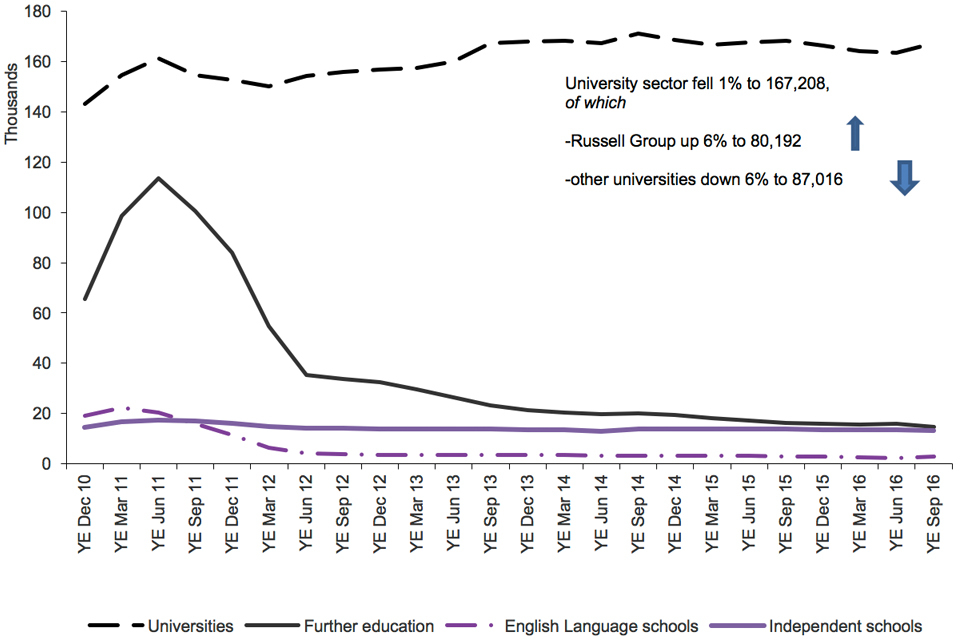
The chart shows the trends in confirmations of acceptance of studies used in applications for visas by the education sector since 2010 to the latest data available. The chart is based on data in Table cs 09 q.
Chart notes
Source: Home Office, Immigration Statistics July to September 2016, Sponsorship table cs 09 q.
‘Universities’ relate to UK-based higher education institutions.
‘Further education’ relates to tertiary, further education or other colleges.
5.2 New entrants to UK Higher Education
In statistics previously published by the Higher Education Statistics Authority (HESA) over the last five years, comparing 2014 to 2015 with 2009 to 2010, the number of non-EU students has increased by 8% to 174,305 and there have been falls of 21% and 10% for UK (756,595) and other EU students (57,815) respectively (source: HESA) Higher Education Student Enrolments and Qualifications Obtained at Higher Education Providers in the United Kingdom 2014/15.
6. Immigration for study, and emigration of former students
In the year ending June 2016, ONS estimates that there were 113,000 non-EU long-term immigrants coming to study and who had an intention to remain a year or more, an 18,000 fall which is not statistically significant.
By contrast, in the year ending June 2016, ONS also estimates that the number of non-EU former students who were long-term emigrants from the UK had risen to 45,000, although this was not a statistically significant increase from 38,000 in the previous 12 months. Although they relate to different cohorts of students, the difference between the number of long-term students entering the UK (113,000) and the number of former students departing (45,000) was around 68,000.
Over the same period, the number of long-term (1 year or more) Tier 4 (sponsored) study-related visas granted (main applicants) was 2% lower at 136,661. Although the trends in the long-term estimates and comparable visa numbers can differ, they are fairly close given the definitional differences and the inherent variation in the ONS survey-based estimates.
These estimates will be based on different cohorts of students, but these ONS statistics suggest that the level of long-term immigration of non-EU students is currently around 68,000 higher than the number of former long-term students who are leaving the country.
Source: ONS, IPS, Migration Statistics Quarterly Report.
7. Extensions of stay
Not supplied by author.
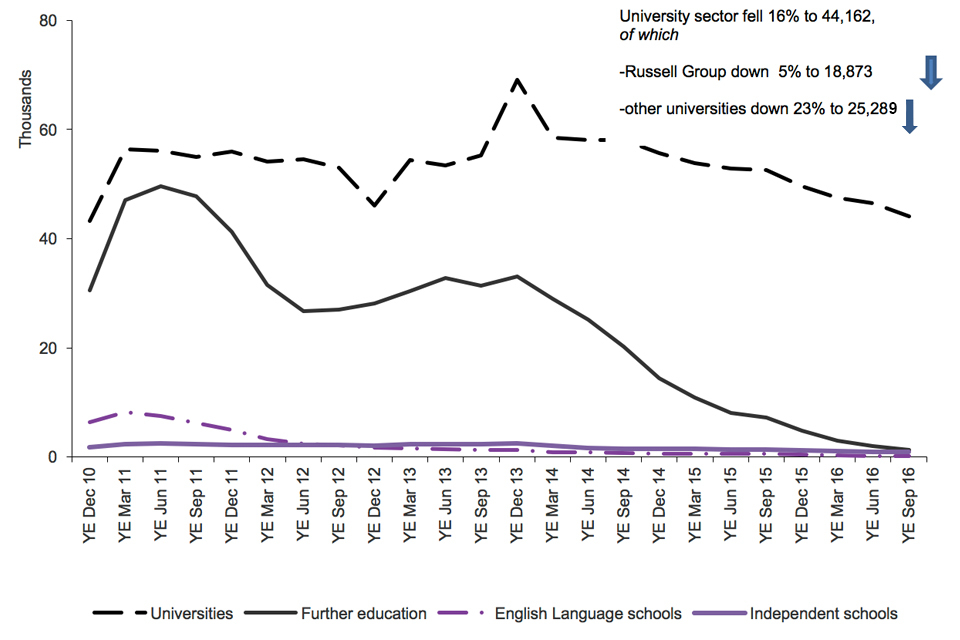
The number of study-related sponsored applications for extensions (main applicants) fell by 15,532 (25%) to 46,564. Most of the 15,532 drop was accounted for by a 16% fall (8,429) in the University sector; of which Russell Group fell by 5% and Further education institution fell by 83% (5,975). There were also a 32% fall (445) in the Independent school and 76% fall (443) in the English language sectors. These trends are likely to reflect previous falls in the visas granted for the sector and tightening of the rules in order to address non-compliance (see chart ‘Study-related sponsored visa applications: FE sector’).
Looking at individuals’ previous category, an estimated 64,483 former students (main applicants) were granted extensions in 2015 (the latest available data for this analysis), compared with 76,175 for 2014. Of the extensions granted in 2015, the majority (83%) allowed individuals to continue to study. There has been a fall in the number of students allowed to switch into a work category from 46,875 in 2011 to 7,226 in 2015, largely reflecting the closure of the Post-study work route. Conversely, the number of students allowed to switch into Tier 2 skilled work has increased from 1,730 in 2011 to 6,004 in 2015.
7.1 Extensions granted to former students (by current category of grant) 2011 to 2015 (main applicants)
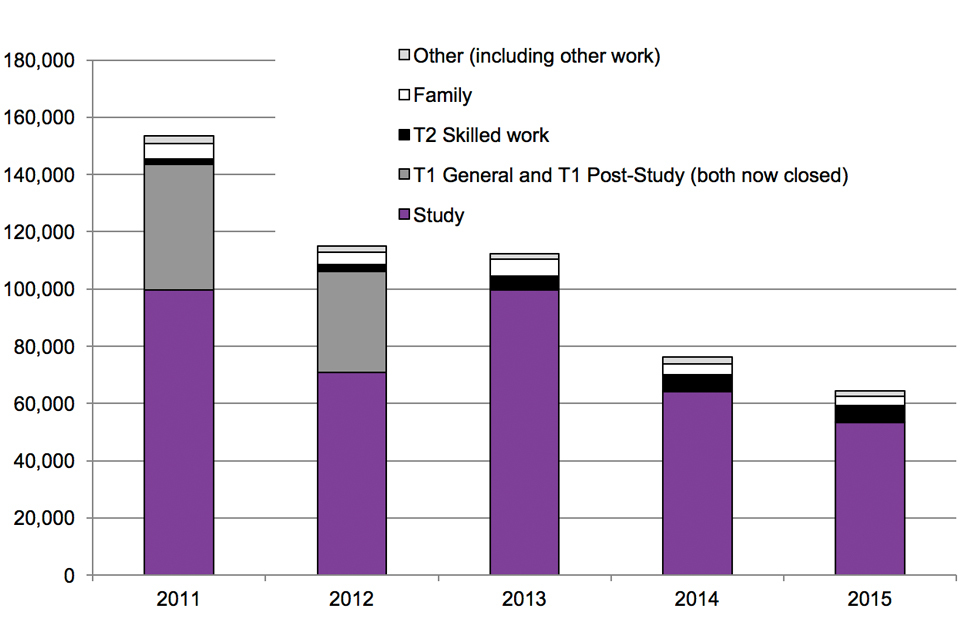
The chart shows the trends in extensions of stay for former students by previous category. The chart is based on data in Tables expc 01 and expc 01 w.
Chart notes
Source: Home Office, Immigration Statistics July to September 2016, Extensions tables expc 01 and expc 01 w.
Note that short-term students are normally only allowed to stay for up to 6 months (11 months for English Language schools) and cannot extend their stay.
8. Short-term students
There were 306,000 short-term student admissions in the calendar year 2015, much higher than the numbers of short-term student visas (previously referred to as ‘student visitors’) of which there were 62,608 granted over the same period. This is due to many nationalities who are not required to obtain a visa if they wish to come to the UK as a short-term student for up to a maximum of 6 months. More than half of the short-term student admissions who do not require a visa for these short visits are accounted for by US nationals (185,000). Other non-visa countries using the short-term student admission route in 2015 include Japan (13,500) and Brazil (13,400).
Where a visa is required, they are granted for a maximum of 6 months in duration or, in a very small number of cases, for 11 months if studying a longer English language course. Short-term students are not long-term migrants and cannot extend their stay. Some students in the study category (Tier 4 of the Points Based System) also have short-term visas (under 1 year), but are not included within the short-term student category (see ‘Entry clearance visas by length’).
The number of short-term student visas granted rose by 39% to 86,149 in the year ending September 2016. Grants to Russian and Turkish citizens accounted for over 40% of the 23,974 increase (5,946 and 4,030 respectively). For further information on short-term students see Short-term study visa and the Home Office research report, Student visitors.
9. Staying on in the UK
Analysis of administrative records for migrants granted visas in 2009 have been published in the Migrant journey: sixth report and this shows that around one-sixth (17%) of migrants issued a study visa in 2009 still had valid leave to remain in the UK or had been granted settlement 5 years later. This proportion has decreased from 24% of those issued a study visa in 2004. These changes may be partly related to the economic recession that occurred towards the end of the period analysed, which may have reduced the incentive for students to remain and seek work in the UK.
The proportion of migrants who gained settlement within 5 years of entering on a study visa also decreased over the same period. For people issued a study visa in 2004, 3% had gained settlement 5 years later, compared with just 1% of those issued a study visa in 2009; however, it would be unusual to acquire settlement that quickly as most students arrived in this non-settlement route and, if seeking to remain longer, would not have had sufficient time to transfer into routes with the prospect of permanent leave.
The study group reported on here excludes the short-term student category (previously referred to as ‘student visitors’) visas that cannot be extended and normally only have validity of 6 months or, in some cases, up to 11 months.
Source: Home Office, Migrant journey: sixth report.
10. Data tables
Data on student immigration, sourced from Home Office administrative systems, can be found in the following tables:
Sponsorship: tables cs 07 q to cs 14 q
Visas vol. 1: tables vi 01 q, vi 04 and v1 04 q
vi 01 q Entry clearance visa applications and resolution by category
vi 04 Entry clearance visas granted by category
vi 04 q Entry clearance visas granted by category
Visas vol. 3: table vi 06 q s
vi 06 q s Entry clearance visas granted by category and country of nationality: Study
Admissions: tables ad 02 to ad 03 and ad 03 s
Extensions: tables ex 01 to ex 02 s
Provisional estimates of long-term immigration for formal study from the ONS IPS relate to those whose main reason for migration is formal study and so are likely to exclude dependants (who would be more likely to say their main reason was to ‘accompany or join’ rather than formal study). ONS data is published at Migration Statistics Quarterly Report.
The Higher Education Statistics Agency publishes data on new entrants to UK higher education providers.
11. Background information
This section includes figures on study-related visas granted, passenger arrivals and extensions granted for non-European Economic Area (EEA) nationals. It also includes figures on long-term immigration to study (i.e. those intending to stay for at least 12 months to study) for non-EU nationals.
Data include dependants as well as main applicants unless stated otherwise. Estimates of long-term immigration for study from the ONS IPS relate to those whose main reason for migration is to study and so are likely to exclude dependants (who would be more likely to say their main reason was to ‘accompany or join’ rather than to study). All comparisons are with the previous 12 months unless indicated.