Extensions of stay
Published 25 August 2016

© Crown copyright 2016
This publication is licensed under the terms of the Open Government Licence v3.0 except where otherwise stated. To view this licence, visit nationalarchives.gov.uk/doc/open-government-licence/version/3 or write to the Information Policy Team, The National Archives, Kew, London TW9 4DU, or email: psi@nationalarchives.gov.uk.
Where we have identified any third party copyright information you will need to obtain permission from the copyright holders concerned.
This publication is available at https://www.gov.uk/government/statistics/immigration-statistics-april-to-june-2016/extensions-of-stay
Valid: 25 August 2016 to 30 November 2016
Data relate to the year ending June 2016 and all comparisons are with the year ending June 2015, unless indicated otherwise.
Back to ‘Immigration statistics April to June 2016’ content page.
This is not the latest release. View latest release.
1. Key facts
There were 11% fewer decisions (-32,433) on extensions in the year ending June 2016. Of the 249,781 decisions, 84% were grants (210,185) and 16% (39,596) were refusals.
There were 78,265 work-related grants of extensions in the year ending June 2016; 7% lower than in the year ending June 2015 (83,874). There was a fall of 77% in the Tier 1 General category (to 1,749), reflecting its previous closure to new entrants; a fall of 35% for Tier 1 Entrepreneurs (to 2,568) following tightening of rules to prevent abuse; and a fall of 32% for Domestic workers in Private Households (to 2,442). For further details see the Work topic. There was a 3% increase for Tier 2 Skilled Work (to 61,997).
Study-related grants of extensions fell by over a fifth (-21%) to 55,509 in the year ending June 2016. This is likely reflecting previous falls in the numbers granted visas, together with tightening of the rules, such as the new use of the ‘genuineness’ test. For further details see the Study topic.
Family-related grants of extensions increased by 40% (+16,093 to 56,098) in the year ending June 2016. This rise is accounted for by increases in grants to partners (+10,933 to 32,038) and in the Family Life (10-year) category (+5,143 to 23,968). These increases likely reflected both a longer residence eligibility period before it is possible to apply to stay in the UK permanently (settlement), and a requirement to obtain an extension after two and a half years, both implemented under new family rules from 9 July 2012. For further details see the Family topic.
Grants of extensions in other categories fell by 41% (-13,896 to 20,313) in the year ending June 2016. Further analysis suggests that a significant part of the decrease was accounted for by grants of discretionary leave outside of the rules on compassionate grounds which fell from 12,199 to 2,936 (main applicants only).
There were 39,596 refusals of an extension in the year ending June 2016 of which 6,674 related to work, 4,803 to study, 12,340 to family and 15,779 to other categories. Correspondingly, the refusal rates for work, study, family and other categories were 8%, 8%, 18% and 44% respectively.
2. Grants of extensions by reason, and refusals
| Total decisions | Total grants | Work | Study | Family (1) | Other (1) | Refusals | |
|---|---|---|---|---|---|---|---|
| Year ending June 2012 | 308,785 | 270,817 | 134,168 | 93,287 | 16,392 | 26,970 | 37,968 |
| Year ending June 2013 | 348,484 | 291,814 | 145,904 | 100,470 | 30,788 | 14,652 | 56,670 |
| Year ending June 2014 | 328,176 | 255,713 | 92,032 | 96,249 | 36,742 | 30,690 | 72,463 |
| Year ending June 2015 | 282,214 | 228,237 | 83,874 | 70,149 | 40,005 | 34,209 | 53,977 |
| Year ending June 2016 | 249,781 | 210,185 | 78,265 | 55,509 | 56,098 | 20,313 | 39,596 |
| Change: latest 12 months | -32,433 | -18,052 | -5,609 | -14,640 | +16,093 | -13,896 | -14,381 |
| Percentage change | -11% | -8% | -7% | -21% | +40% | -41% | -27% |
Table notes
Source: Home Office, Immigration Statistics April to June 2016, Extensions table ex 01 q.
(1) The introduction of the new Family Life (10-year) route in July 2012, ‘STATEMENT OF INTENT: FAMILY MIGRATION’ means that the total number of family and other category grants are not fully comparable over time.
3. Long-term trends in grants and refusals of extensions of stay
The chart below illustrates longer-term trends in grants and refusals to extend stay by calendar year back to 2005.
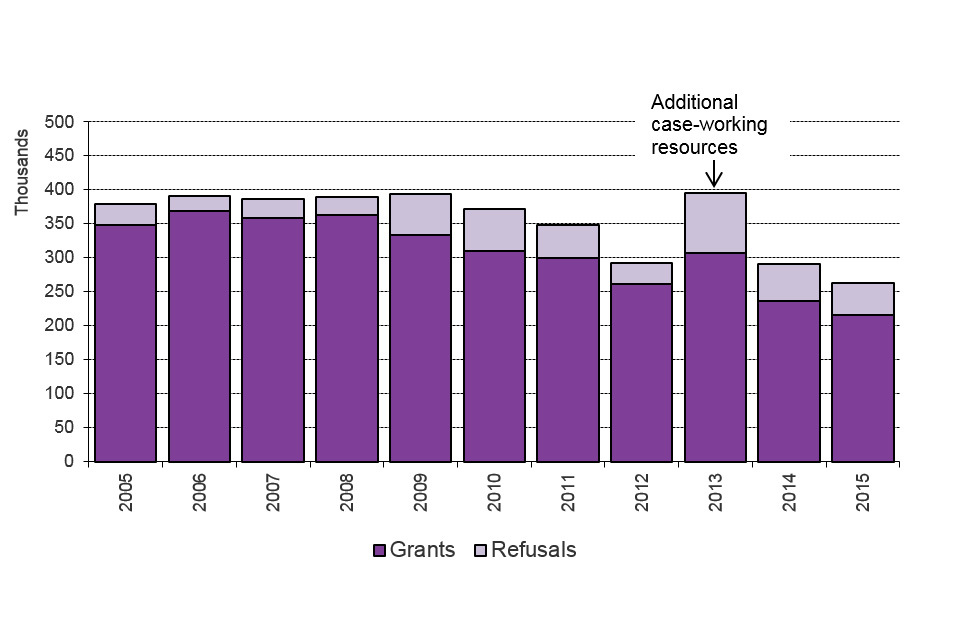
The chart shows grants and refusals of an extension of stay between 2005 and the latest calendar year. Additional case-working resources in 2013. The chart is based on data in Table ex 01.
Chart notes
Source: Home Office, Immigration Statistics April to June 2016, Extensions table ex 01.
4. Nationalities granted an extension
(excludes dependants)
Top 5 nationalities granted an extension to stay, 2015
(Total number of grants 163,676, excludes dependants)
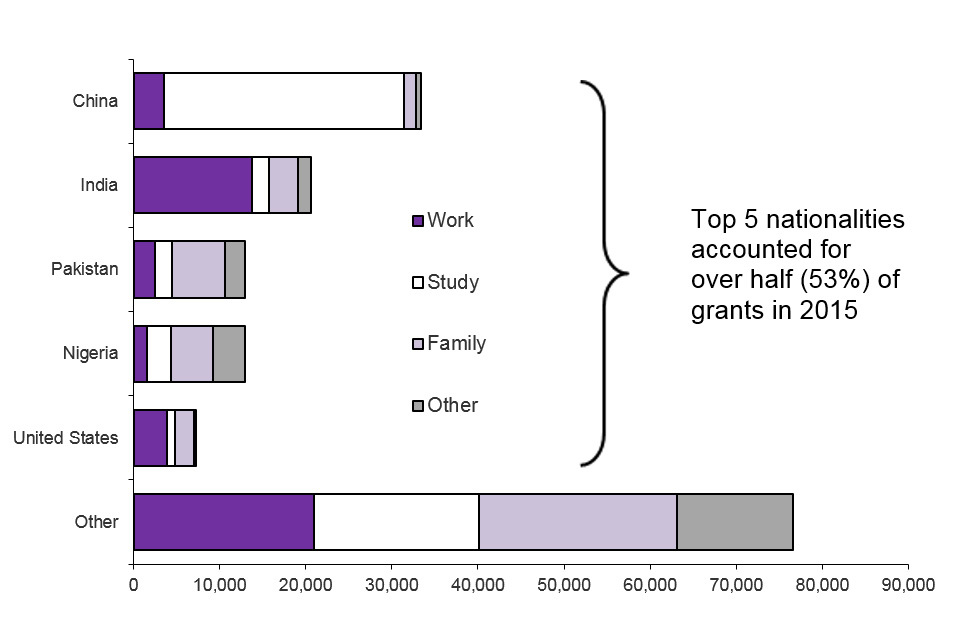
The chart shows grants of extension of stay by nationality in 2015. Top 5 nationalities accounted for over half (53%) of grants in 2015. The chart is based on data in Table ex 02.
Chart notes
Source: Home Office, Immigration Statistics April to June 2016, Extensions table ex 02.
5. Data tables
Further data are available in Extensions tables ex 01 to expc 01 o.
More detailed analysis on family extensions and additional tables for years ending June were included in the Immigration statistics April to June 2015 release Family topic to assist users in understanding the trends before and after the changes to the Family Immigration Rules in July 2012.
A short statistical article on ‘Extensions of stay by previous category’ was published alongside the Immigration Statistics April to June 2013 release to provide further detailed information. Updates of the more detailed tables provided in the article are included in the Immigration Statistics April to June 2013 Extensions tables and were summarised in the Immigration statistics January to March 2016 release Extensions topic.
6. Background information
The figures in this section relate to individuals inside the UK extending or changing the status of their stay in the UK. Data include dependants unless stated otherwise.
The numbers reflect past changes in the levels of those entering the UK in different categories, policy and legislative changes, e.g. closure of categories or changes to the length of visas granted to people entering the UK, or to the rules on whether individuals can switch categories. The figures also may reflect the level of case-working resources available.
6.1 Migration Transparency Data webpage
A range of key input and impact indicators are currently published by the Home Office on the Migration transparency data webpage.
6.2 Staying in the UK
In January 2016, the Home Office published its ‘Migrant journey: sixth report’, which shows how non-European Economic Area (EEA) migrants change their immigration status or achieve settlement in the UK.