Extensions of stay
Updated 26 May 2016

© Crown copyright 2016
This publication is licensed under the terms of the Open Government Licence v3.0 except where otherwise stated. To view this licence, visit nationalarchives.gov.uk/doc/open-government-licence/version/3 or write to the Information Policy Team, The National Archives, Kew, London TW9 4DU, or email: psi@nationalarchives.gov.uk.
Where we have identified any third party copyright information you will need to obtain permission from the copyright holders concerned.
This publication is available at https://www.gov.uk/government/statistics/immigration-statistics-january-to-march-2016/extensions-of-stay
Valid: 26 May 2016 to 24 August 2016
Data relate to the year ending March 2016 and all comparisons are with the year ending March 2015, unless indicated otherwise.
Back to ‘Immigration statistics January to March 2016’ content page.
This is not the latest release. View latest release.
1. Key facts
There were 252,865 decisions on extensions in the year ending March 2016, 13% fewer than in the previous 12 months. Over four-fifths of decisions were grants (210,039) and nearly a fifth (42,826) were refusals.
There were 79,475 work-related grants of extensions in the year ending March 2016, 8% lower than in the year ending March 2015 (86,740). There was a fall of 71% in the Tier 1 General category (to 2,570), reflecting its previous closure to new entrants, and a fall of 50% for Tier 1 Entrepreneurs (to 2,633) following tightening of rules to prevent abuse. For further details see the Work topic. There was a 2% increase for Tier 2 Skilled Work (to 61,617).
Study-related grants of extensions fell by over a fifth (-21%) to 58,205 in the year ending March 2016. This is likely reflecting previous falls in the numbers granted visas, together with tightening of the rules, such as the new use of the ‘genuineness’ test. For further details see the Study topic.
Family-related grants of extensions increased by 29% (+11,323 to 49,944) in the year ending March 2016. This rise is accounted for by increases in grants to partners (+7,725 to 28,207) and in the Family Life (10-year) category (+3,609 to 21,661). These increases likely reflected both a longer residence eligibility period before it is possible to apply to stay in the UK permanently (settlement), and a requirement to obtain an extension after two and a half years, both implemented under new family rules from 9 July 2012. For further details see the Family topic.
Grants of extensions in other categories fell by 35% (-11,943 to 22,415) in the year ending March 2016. Further analysis suggests that a significant part of the decrease was accounted for by grants of discretionary leave outside of the rules on compassionate grounds which fell from 12,450 to 4,510 (main applicants only).
There were 42,826 refusals of an extension in the year ending March 2016 of which 6,731 related to work, 7,095 to study, 13,245 to family and 15,755 to other categories. Correspondingly, the refusal rates for work, study, family and other categories were 8%, 11%, 21% and 41% respectively.
Of the 163,676 extensions granted in 2015 to main applicants, 129,309 (79%) allowed the individual to stay within their original broad category, with the other 21% having switched categories.
Looking at individuals’ previous category, an estimated 64,483 former students (main applicants) were granted extensions in 2015, compared with 76,175 for 2014. Of the former students, 7,226 were granted extensions for work in 2015, an increase of 3% compared to the 7,043 in 2014.
2. Grants of extensions by reason, and refusals
| Year | Total decisions | Total grants | Work | Study | Family (1) | Other (1) | Refusals |
|---|---|---|---|---|---|---|---|
| Year ending March 2012 | 317,842 | 276,066 | 129,550 | 100,808 | 17,127 | 28,581 | 41,776 |
| Year ending March 2013 | 315,551 | 281,476 | 144,123 | 98,968 | 24,811 | 13,574 | 34,075 |
| Year ending March 2014 | 364,509 | 276,044 | 106,924 | 102,110 | 37,155 | 29,855 | 88,465 |
| Year ending March 2015 | 289,203 | 233,230 | 86,740 | 73,511 | 38,621 | 34,358 | 55,973 |
| Year ending March 2016 | 252,865 | 210,039 | 79,475 | 58,205 | 49,944 | 22,415 | 42,826 |
| Change: latest 12 months | -36,338 | -23,191 | -7,265 | -15,306 | +11,323 | -11,943 | -13,147 |
| Percentage change | -13% | -10% | -8% | -21% | +29% | -35% | -23% |
Table notes
Source: Home Office, Immigration Statistics January to March 2016, Extensions table ex 01 q.
(1) The introduction of the new Family Life (10-year) route in July 2012, ‘Statement of intent: Family migration’ means that the total number of family and other category grants are not fully comparable over time.
3. Long-term trends in grants and refusals of extensions of stay
The chart below illustrates longer-term trends in grants and refusals to extend stay by calendar year back to 2005.
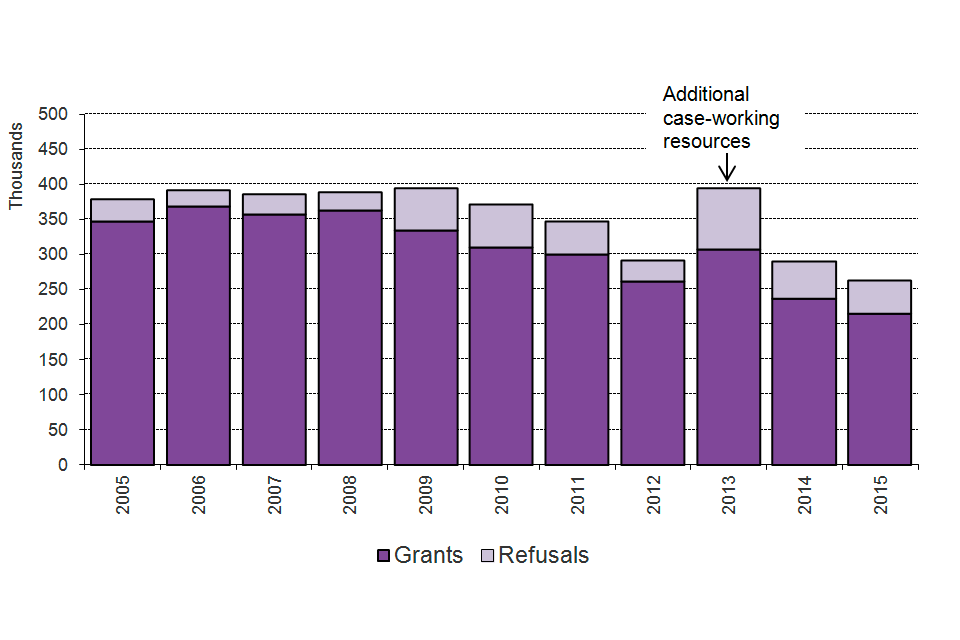
The chart shows grants and refusals of an extension of stay between 2005 and the latest calendar year. Additional case-working resources in 2013. The chart is based on data in Table ex 01.
Chart notes
Source: Home Office, Immigration Statistics January to March 2016, Extensions table ex 01.
4. Grants of extensions by previous category
(excludes dependants)
The text and table below provides an update of the article ‘Extensions of stay by previous category’ published on 29 August 2013 which was further updated by information in extensions topic brief published in 22 May 2014 and extensions topic brief published in 21 May 2015. Updates of the more detailed tables provided in the article are included in the Extensions tables.
The previous immigration category of students granted an extension has been estimated for 2013, 2014 and 2015. The data are provisional and subject to revision.
The data presented relate to main applicants only. Since dependants are granted or refused an extension in line with the main applicant, the results for main applicants broadly apply for their dependants also.
There were 163,676 extensions granted in 2015, of which 46,254 (28%) were for work, 54,615 (33%) for study, 40,958 (25%) for family reasons and 21,849 (13%) for other reasons.
Looking at individuals’ previous category, there were 64,483 extensions granted in 2015 to people who were previously students. Of the extensions granted, the majority (83%) allowed individuals to continue to study, 11% were for work and 5% were family related. The corresponding proportions in 2014 were 84%, 9% and 5%; in 2013 were 89%, 6% and 5%; and in 2012 were 62%, 33% and 4% respectively. The numbers of extensions in each category are provided in the table below.
Of the 46,254 extensions granted in 2015 for work, 35,943 were to people who were previously in the work category (78%), and a further 7,226 were to former students (16%).
The 40,958 extensions granted in 2015 for family reasons included 20,215 people previously in the family route (49%), 3,141 former students (8%), and 2,189 previously in the work category (5%).
Of the 163,676 extensions granted in 2015, 129,309 (79%) allowed the individual to stay within their original broad category, with the other 21% having switched categories. By comparison, in 2011 and 2012 a higher proportion were allowed to switch (29% and 30% respectively). The fall in the proportion allowed to switch largely reflects the closure of the Post-Study route.
Grants of extension of stay in 2015, current category by previous category
(excludes dependants)
Graph showing increase in granted TA/TR visas and decrease in returned visas between year ending December 2010 and year ending June 2016.
Table notes
Source: Home Office, Immigration Statistics January to March 2016, Extensions table expc 01.
5. Nationalities granted an extension
(excludes dependants)
Top 5 nationalities granted an extension to stay, 2015
(Total number of grants 163,676, excludes dependants)
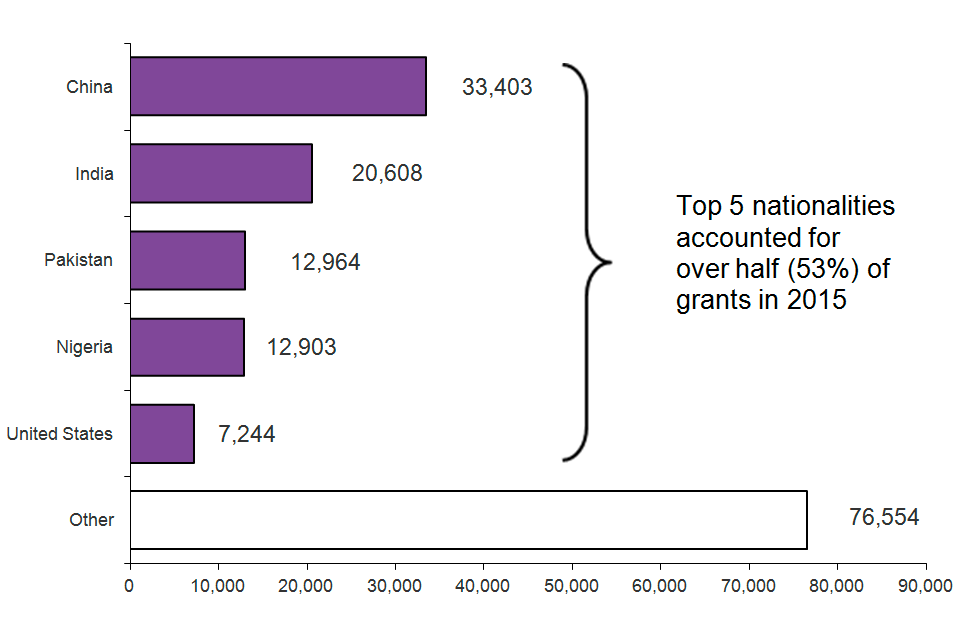
The chart shows grants of extension of stay by nationality in 2015. Top 5 nationalities accounted for over half (53%) of grants in 2015. The chart is based on data in Table ex 02.
Chart notes
Source: Home Office, Immigration Statistics January to March 2016, Extension table ex 02.
6. Data tables
Further data on extensions are available in Extensions tables ex 01 to expc 01 o.
More detailed analysis on family extensions and additional tables for years ending June were included in the Immigration Statistics April to June 2015 release Family topic to assist users in understanding the trends before and after the changes to the Family Immigration Rules in July 2012.
7. Background information
The figures in this section relate to individuals inside the UK extending or changing the status of their stay in the UK. Data include dependants unless stated otherwise.
The numbers reflect past changes in the levels of those entering the UK in different categories, policy and legislative changes, e.g. closure of categories or changes to the length of visas granted to people entering the UK, or to the rules on whether individuals can switch categories. The figures also may reflect the level of case-working resources available.
7.1 Migration Transparency Data webpage
A range of key input and impact indicators are currently published by the Home Office on the Migration transparency data webpage.
7.2 Staying in the UK
In January 2016, the Home Office published its ‘Migrant journey: sixth report’, which shows how non-European Economic Area (EEA) migrants change their immigration status or achieve settlement in the UK.