Work
Updated 26 May 2016

© Crown copyright 2016
This publication is licensed under the terms of the Open Government Licence v3.0 except where otherwise stated. To view this licence, visit nationalarchives.gov.uk/doc/open-government-licence/version/3 or write to the Information Policy Team, The National Archives, Kew, London TW9 4DU, or email: psi@nationalarchives.gov.uk.
Where we have identified any third party copyright information you will need to obtain permission from the copyright holders concerned.
This publication is available at https://www.gov.uk/government/statistics/immigration-statistics-january-to-march-2016/work
Valid: 26 May 2016 to 24 August 2016
Data relate to the year ending March 2016 and all comparisons are with the year ending March 2015, unless indicated otherwise.
Back to ‘Immigration statistics January to March 2016’ content page.
This is not the latest release. View latest release.
1. Key facts
There were 91,833 Tier 2 skilled work visas granted in the year ending March 2016, similar to the previous year (93,061), and 43,591 Tier 5 Youth mobility and temporary visas granted, down 6% (-2,748).
There were also fewer Tier 1 unsponsored work visas granted (-4,209; -47%). This was largely due to fewer grants in the Tier 1 Investor category, down 78% (-2,106), reflecting changes introduced to the category in November 2014 and fewer grants to dependants in routes now closed to new applicants (Tier 1 General -1,317; Tier 1 Post Study -95). Of the 175,176 decisions on work visas, 6% (10,682) were refused.
In the year ending December 2015, the ONS estimate there were 72,000 non-EU long-term immigrants for work, an increase of 7% (+5,000) compared with the previous 12 months. However, this increase was not statistically significant. Over the same period, long-term (1 year or more) work-related visas granted to main applicants also rose, by 22% to 81,735 in the year ending December 2015 reflecting an increase in visas in the ‘short-term ICT’ category that were for exactly 365 or 366 days. The level and trend from the two series are similar over the longer term. There are nonetheless a number of reasons why the long-term immigration estimates and visas data may show different trends in the shorter term, including sampling variation and coverage; further details are given below.
There was a 1% increase in sponsored visa applications for skilled work (Tier 2) to 56,320 in the year ending March 2016 (main applicants). Most of the increase was accounted for by 3 of the 4 largest sectors: Information and Communication (23,704; +1%), Financial and Insurance Activities (6,759; +2%) and Human Health and Social Work Activities (4,008; +25%). The Information and Communication sector accounted for 42 percent of applications by skilled work sponsors.
Indian nationals accounted for 57% of total skilled work visas granted (52,109 of 91,833), with nationals of the USA the next largest group of skilled workers granted a visa in the year ending March 2016 (9,981 or 11%).
Work-related grants of extensions fell by 8% (-7,265) in the year ending March 2016, to 79,475. This fall was mainly accounted for by 6,158 fewer Tier 1 General grants (closed to new entrants since December 2010) as well as 2,611 fewer Tier 1 Entrepreneur grants. This latter change reflects tightened eligibility rules for individuals seeking to switch to the Tier 1 Entrepreneur category, with the intention of clamping down on abuse. There was a 2% increase for Tier 2 Skilled Work (to 61,617). Of the 86,206 decisions on work-related grants of extension in the same period, 8% (6,731) were refused.
The Migrant journey: sixth report indicated that, based on data matching, a quarter (25% or 20,437) of those issued skilled work visas in 2009 had been granted permission to stay permanently (settlement) 5 years later and a further 10% (7,906) still had valid leave to remain.
2. Work immigration: latest trends
| Year ending Mar 2015 | Year ending Mar 2016 | Change | Percentage change | |
|---|---|---|---|---|
| Work-related visas issued | 171,024 | 163,857 | -7,167 | -4% |
| of which: | ||||
| High value (Tier 1) visas | 8,992 | 4,783 | -4,209 | -47% |
| Skilled (Tier 2) visas | 93,061 | 91,833 | -1,228 | -1% |
| Youth mobility and temporary workers (Tier 5) visas | 46,339 | 43,591 | -2,748 | -6% |
| Non-PBS/Other work visas | 22,632 | 23,650 | +1,018 | +4% |
| Year ending December 2014 | Year ending December 2015 | Change | Percentage change | |
| Long-term immigration for work (1) excluding dependants | 67,000 | 72,000 | +5,000 (Confidence interval +/- 16,000) | +7% |
| Long-term (1 year or more) work-related visas excluding dependants | 67,044 | 81,735 | +14,691 | +22% |
Table notes
Source: Home Office, Immigration Statistics January to March 2016, Visas table vi 04_q, International Passenger Survey, Office for National Statistics, Migration Statistics Quarterly Report.
(1) Immigration for work data are estimates of the number of non-EU nationals intending to change their residence to the UK for at least 12 months based on the International Passenger Survey.
2. Long-term trends in work-related immigration
There was a long-term reduction in work-related visas granted, admissions and non-EU immigration from 2006 to 2012. There have been increases more recently, with work-related visas granted decreasing in the year ending March 2016 (there have also been falls in extensions related to the previous closure of the Tier 1 General and Tier 1 Post Study categories to new applicants: see below).
The chart below shows that work-related visas and admissions have been moving in line with each other. International Passenger Survey (IPS) estimates of non-EU work immigration are substantially lower as these include only those migrants who state they intend to remain in the UK for a year or more. However, the two series show broadly similar trends with falls from 2006 followed by increases from the middle of 2013. Data on just long-term work visas (1 year or more) for main applicants are much closer to the IPS series, and have become even closer more recently (the difference having reduced from 47,000 in 2007 and 2008 to within 10,000 for the year ending December 2015). This may in part reflect changes made as part of the introduction of the Points-Based System in 2008, such as the introduction of the short-term intra-company transfer route.
Long-term trends in work-related immigration
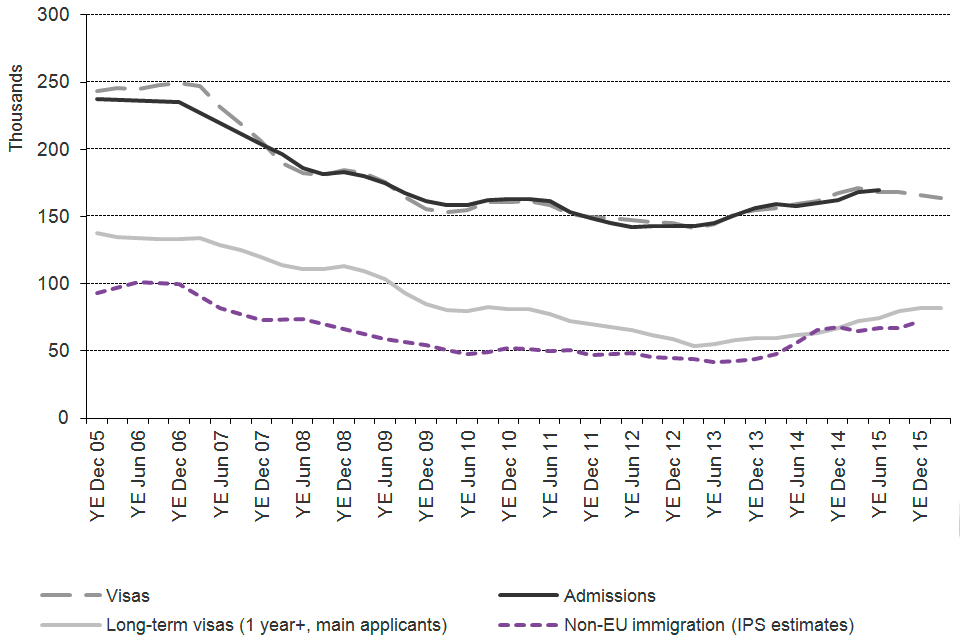
The chart shows the trends for work of visas granted, admissions and International Passenger Survey (IPS) estimates of non-EU immigration, between 2005 and the latest data published. Sourced from tables vi 04 q, ad 02 q and corresponding datasets.
Chart notes
Source: Home Office, Immigration Statistics January to March 2016, Visas tables vi 04 q (Visas volume 1), Admissions tables ad 02 q and corresponding datasets; Office for National Statistics Migration.
There are a range of potential reasons why IPS figures differ from figures for work visas granted or passenger arrivals, and hence why the trends in the different series do not always correspond, including:
- sampling variation in the IPS, (for example the increase of 5,000 in work-related immigration for the year ending December 2015 has an estimated confidence interval of +/-16,000)
- IPS data for work relate to individuals whose main reason for migration was work related so (unlike visas data) are likely to exclude their dependants. IPS data are more comparable with visa totals for main applicants than with total visas data
- differences between intentions and visa length
- individuals may migrate for multiple different reasons
- timing differences between when visas are granted and when an individual actually travels
- visa and admissions data include dependants, and both short term and long-term migrants
Further comparisons of the data are described in the user guide.
3. Further analysis: skilled work (Tier 2)
3.1 Sponsored visa applications, by nationality and industry sector
There was a 1% increase in sponsored visa applications for skilled work (to 56,320 in the year ending March 2016, main applicants, Certificates of Sponsorship used). Most of the 731 increase was accounted for by three of the four largest sectors: Information and Communication (up 166; +1%), Financial and Insurance Activities (up 151; +2%) and Human Health and Social Work Activities (up 791; +25%). There were 23,704 applications from the Information and Communication sector in the year ending March 2016, and this sector alone accounted for 42 percent of all skilled work sponsored visa applications. There have also been increases in each of the last four years for Information and Communication (up 41% since 2011) and Professional, Scientific and Technical Activities (up 49% since 2011).
Sponsored visa applications by industry sector, year ending March 2016
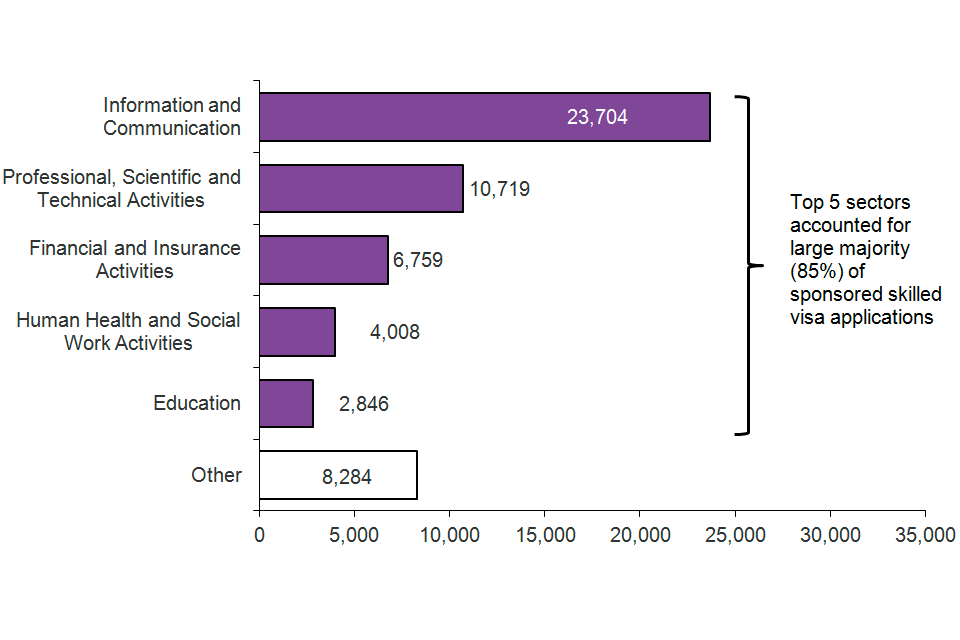
The chart shows the sponsored visa applications by industry sector for the year ending March 2016. The data are sourced from the sponsorship tables. The top 5 sectors accounted for the large majority (85%) of sponsored skilled visa applications.
Chart notes
Source: Home Office, Immigration Statistics January to March 2016 Sponsorship tables.
Indian nationals accounted for over half (55% or 30,922) of the 56,320 applications.
Sponsored visa applications, by nationality, year ending March 2016
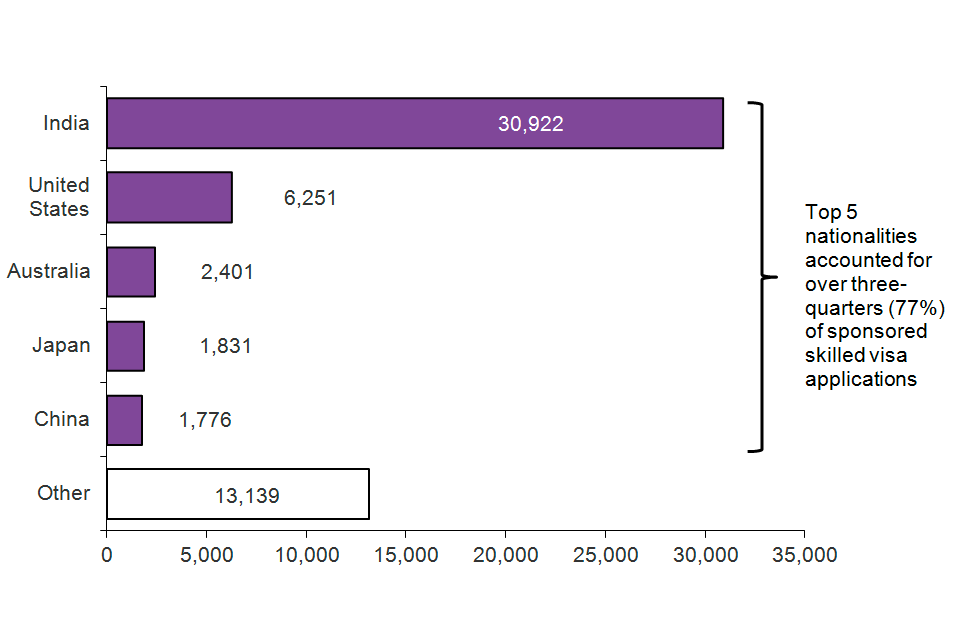
The chart shows the sponsored visa applications by nationality for the year ending March 2016. The data are sourced from the sponsorship tables. The top 5 nationalities accounted for over three-quarters (77%) of sponsored skilled visa applications.
Chart notes
Source: Home Office, Immigration Statistics January to March 2016 Sponsorship tables.
4. Skilled work visas granted
In the year ending March 2016, almost all (97%) of the 94,417 decisions made on entry clearance applications for skilled work were grants (91,833). The decrease in skilled (Tier 2) grants was accounted for by a fall in Tier 2 Dependants (down 2,544; -6%), mainly in the Long term ICT category (down 1,956; -13%). This decrease was partly offset by an increase in Tier 2 General main applicants (up 1,484; +9%).
Skilled work: latest trends in visa grants
| Year ending Mar 2015 | Year ending Mar 2016 | Change | Percentage change | |
|---|---|---|---|---|
| Skilled (Tier 2) visas granted | 93,061 | 91,833 | -1,228 | -1% |
| of which: | ||||
| (Main applicants) | 53,645 | 54,961 | +1,316 | +2% |
| of which | ||||
| Tier 2 - General | 16,185 | 17,669 | +1,484 | +9% |
| Tier 2 - Intra Company Transfers | 2,201 | 2,203 | +2 | +0% |
| Tier 2 - Intra Company Transfers Short Term | 21,349 | 21,676 | +327 | +2% |
| Tier 2 - Intra Company Transfers Long Term | 13,306 | 12,867 | -439 | -3% |
| Tier 2 - Ministers of Religion | 431 | 388 | -43 | -10% |
| Tier 2 - Sportsperson | 134 | 111 | -23 | -17% |
| Work Permit Holders | 39 | 47 | +8 | +21% |
| (Dependants) | 39,416 | 36,872 | -2,544 | -6% |
| of which | ||||
| Tier 2 - Dependant | 14,893 | 14,741 | -152 | -1% |
| Tier 2 - Intra Company Transfers Short Term | 8,952 | 8,505 | -447 | -5% |
| Tier 2 - Intra Company Transfers Long Term | 15,557 | 13,601 | -1,956 | -13% |
| Work Permit Holders | 14 | 25 | +11 | +79% |
Table notes
Source: Home Office, Immigration Statistics January to March 2016 Visas table vi 04_q.
5. Skilled work extensions granted
Similarly, in the year ending March 2016, almost all (95%) of the 65,188 decisions on extensions of stay for skilled work were grants (61,617). There was a small (+2%; +1,093) increase in extensions granted, which was mainly accounted for by an increase of 1,056 in extensions for Intra Company Transfer dependants.
Skilled work: latest trends in grants of extensions
| Year ending Mar 2015 | Year ending Mar 2016 | Change | Percentage change | |
|---|---|---|---|---|
| Skilled (Tier 2) granted of extensions | 60,524 | 61,617 | +1,093 | +2% |
| of which: | ||||
| (Main applicants) | 34,462 | 34,112 | -350 | -1% |
| of which | ||||
| Tier 2 - General | 25,912 | 24,948 | -964 | -4% |
| Tier 2 - Intra-Company Transfers | 7,993 | 8,648 | +655 | +8% |
| Tier 2 - Ministers of Religion | 458 | 428 | -30 | -7% |
| Tier 2 - Sportsperson | 98 | 88 | -10 | -10% |
| Work Permit Holders | 1 | 0 | -1 | |
| (Dependants) | 26,062 | 27,505 | +1,443 | +6% |
| of which | ||||
| Tier 2 - General | 16,237 | 16,660 | +423 | +3% |
| Tier 2 - Intra-Company Transfers | 9,206 | 10,262 | +1,056 | +11% |
| Tier 2 - Ministers of Religion | 511 | 511 | 0 | 0% |
| Tier 2 - Sportsperson | 96 | 70 | -26 | -27% |
| Work Permit Holders | 12 | 2 | -10 | -83% |
Table notes
Source: Home Office, Immigration Statistics January to March 2016 Extensions table ex 01_q.
5.1 Extensions granted in Tier 2 by previous category
Looking at individuals’ previous category in the latest available statistics for 2015, there were 33,184 extensions granted for skilled work.
Of these, it is estimated that 26,185 were grants to individuals previously in Tier 2 (i.e. skilled work), 6,004 were grants to former students, and 331 were grants to individuals previously in the Tier 1 - Post-Study category (now closed to new entrants).
As the chart below indicates, total work-related grants of extensions have fallen from 96,798 in 2011 to 46,254 in 2015, mainly driven by falls in the Tier 1 Post Study and Tier 1 General categories (from 65,897 in 2011 to just 2,024 in 2015, reflecting the closure of these routes to all but dependants of previous applicants in April 2012 and December 2010 respectively). This decrease was partly offset by increases in Tier 2 skilled work extensions granted for those whose previous category was work between 2011 and 2013, which more than doubled from 16,301 to 33,163. This number has since fallen to 26,822 in 2015. There have also been increases for former students, from 1,730 in 2011 to 6,004 in 2014.
Trends were partly influenced by the introduction of Tier 2 in November 2008, with visas up to 3 years replacing a previous skilled work route that had visas up to 5 years requiring no extension before any application for settlement.
Work-related extensions, 2011 to 2015 (main applicants)
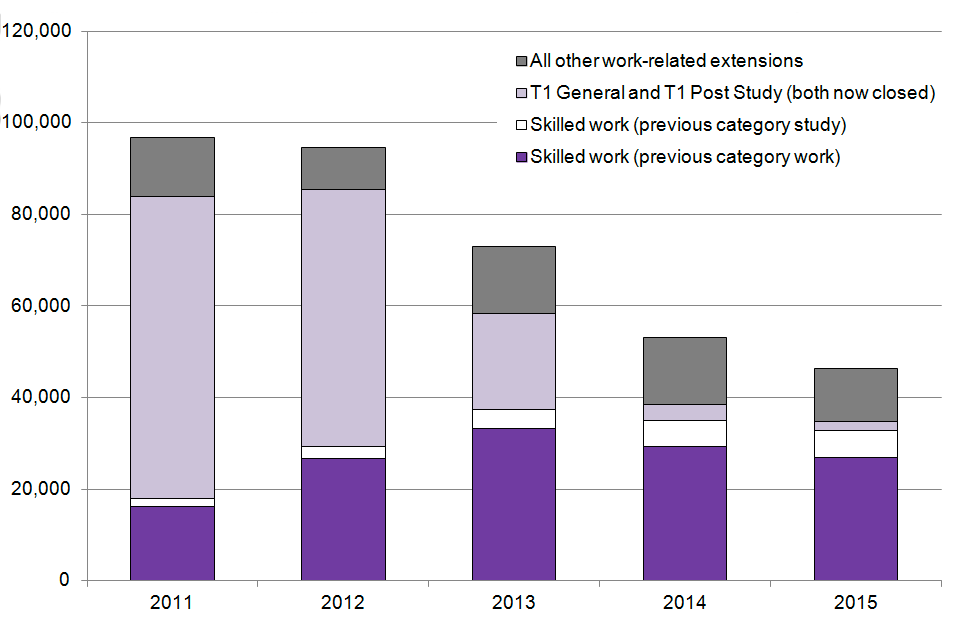
The chart shows the trends in extensions of stay for work, including skilled work by previous category. The chart is based on data in Table expc 01 and expc 01 w.
Chart notes
Source: Home Office, Immigration Statistics January to March 2016, Extensions tables expc 01 and expc 01 w.
6. Staying in the UK
In February 2016 the Home Office published its ‘Migrant journey: sixth report’, which shows how non-EEA migrants change their immigration status or achieve settlement in the UK.
The main points were:
- 25% (20,437) of those issued skilled work visas (with a potential path to settlement) in the 2009 cohort had been granted settlement 5 years later and a further 10% (7,906) still had valid leave to remain
- Indian nationals were issued the largest proportion (41%) of skilled work visas in the 2009 cohort and, of these skilled Indian nationals, 24% had received settlement after 5 years, while a further 8% still had valid leave to remain.
Source: Home Office, Migrant journey: sixth report.
7. UK nationals and non-UK nationals: Employment levels
Estimates from the Labour Force Survey, UK Labour Market: May 2016, published by the ONS, show that the number of UK nationals in employment in January to March 2016 was 28.2 million, up 185,000 (+0.7%) compared with the same quarter in 2015. The employment rate for UK nationals in January to March 2016 was 74.4%, up 0.8 percentage points on the previous year, slightly lower than the peak rate of 74.6% recorded in the previous quarter, but the highest first quarter rate recorded since the series began in 1997.
There were 3.3 million non-UK nationals in employment in January to March 2016, up 229,000 (+7.4%) compared with the same quarter in 2015. The employment rate for non-UK nationals was 71.3%, up 0.8 percentage points on the previous year, lower than the record high rate of 72.8% seen in the third quarter of 2015, but the highest first quarter rate recorded since the series began in 1997.
This change was driven by an increase in EU nationals in employment (up 224,000 to 2.1 million). There were increases in each of the EU14 (up 131,000 to 939,000), EU8 (up 32,000 to 962,000) and EU2 (up 55,000 to 228,000) groups. The number of non-EU nationals in employment remained at a similar level of 1.2 million.
The total growth in employment over the last year was 412,000. This increase was accounted for primarily by EU nationals (54.1%) and UK nationals (44.7%), with non-EU nationals responsible for the remaining 1.2%.
8. Data tables
Data on immigration for work, sourced from Home Office administrative systems, can be found in the following tables:
Visas vol. 1: tables vi 01 q, vi 04 and vi 04 q
vi 01 q Entry clearance visa applications and resolution by category
vi 04 Entry clearance visas granted by category
vi 04 q Entry clearance visas granted by category
Visas vol. 2: table vi 06 q w
vi 06 q w Entry clearance visas granted by category and country of nationality: Work
Sponsorship: tables cs 01 q to cs 06 q
Admissions: tables ad 02 to ad 03 and ad 03 w
Extensions: tables ex 01 to ex 02, ex 02 w and expc 01 w
Settlement: tables se 01 to se 03
European Economic Area: tables ee 01, ee 01 q and ee 02
9. Background information
This section includes figures on work-related visas granted, passenger arrivals and extensions granted for non-EEA nationals. It also includes figures on long-term immigration to work (i.e. those intending to stay for at least 12 months for work) for non-EU nationals.
Data include dependants as well as main applicants unless stated otherwise. Provisional estimates of long term immigration for work from the ONS International Passenger Survey (IPS) relate to those whose main reason for migration is to work and so are likely to exclude dependants (who would be more likely to say their main reason was to ‘accompany or join’ rather than to work).
9.1 Reason for migration and the labour market
IPS statistics and visa statistics represent flows of people, only a proportion of whom will remain for longer periods. A recent Home Office research report, ‘The reason for migration and labour market characteristics of UK residents born abroad’ (September 2014), uses ONS data from the Labour Force Survey to provide estimates of the number of residents born abroad by the reason for original migration.
A key finding of this was that the distribution of original purposes given for migrating by people resident in the UK who were born abroad is different from that produced when looking at the migration flows reported in the IPS. For example, the proportion of people who come for family purposes or as a dependant takes greater significance, because of the higher likelihood of people who come for relationship reasons to stay longer. Similarly, although many foreign students are temporary, the analysis confirmed findings in other studies that a number of foreign students do stay on as residents.