Households below average income: an analysis of the income distribution FYE 1995 to FYE 2020
Published 25 March 2021

© Crown copyright 2021
This publication is licensed under the terms of the Open Government Licence v3.0 except where otherwise stated. To view this licence, visit nationalarchives.gov.uk/doc/open-government-licence/version/3 or write to the Information Policy Team, The National Archives, Kew, London TW9 4DU, or email: psi@nationalarchives.gov.uk.
Where we have identified any third party copyright information you will need to obtain permission from the copyright holders concerned.
This publication is available at https://www.gov.uk/government/statistics/households-below-average-income-for-financial-years-ending-1995-to-2020/households-below-average-income-an-analysis-of-the-income-distribution-fye-1995-to-fye-2020
The Households Below Average Income (HBAI) report presents information on UK living standards based on household income measures for Financial Year Ending (FYE) 2020. Estimates are provided for average incomes, income inequality, and for the number and percentage of people living in low income households. Please note that comparisons between years are generally made using percentages rounded to the nearest percentage point for each year. Changes are not statistically significant unless stated with an asterisk.
1. Main stories
The evidence shows that:
- median household income increased significantly between FYE 2019 and FYE 2020 for both before housing costs (BHC)* [footnote 1] and after housing costs (AHC)*;
- income inequality BHC and AHC remained similar to the levels seen since FYE 2011, in turn slightly lower than the levels around the FYE 2009 UK economic recession;
- absolute low income AHC* and BHC for the overall population decreased slightly in the latest year. Relative low income AHC remained the same, whilst BHC increased slightly.
Household Income
Household Income – Median increase to £547 (BHC)* and £476 (AHC)* in FYE 2020
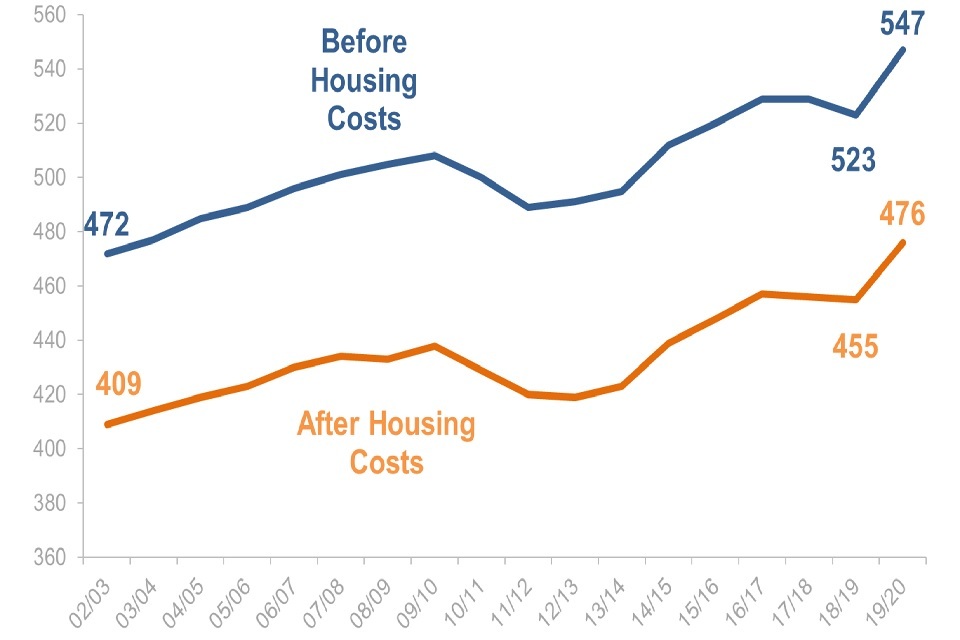
Between FYE 2019 and FYE 2020, average (median) household net disposable income BHC and AHC increased significantly in real terms (i.e. taking account of inflation). Since their lows in FYE 2012, incomes BHC* and AHC* have both increased by £55-60 per week.
Income Inequality
Income Inequality – Gini flat BHC and AHC
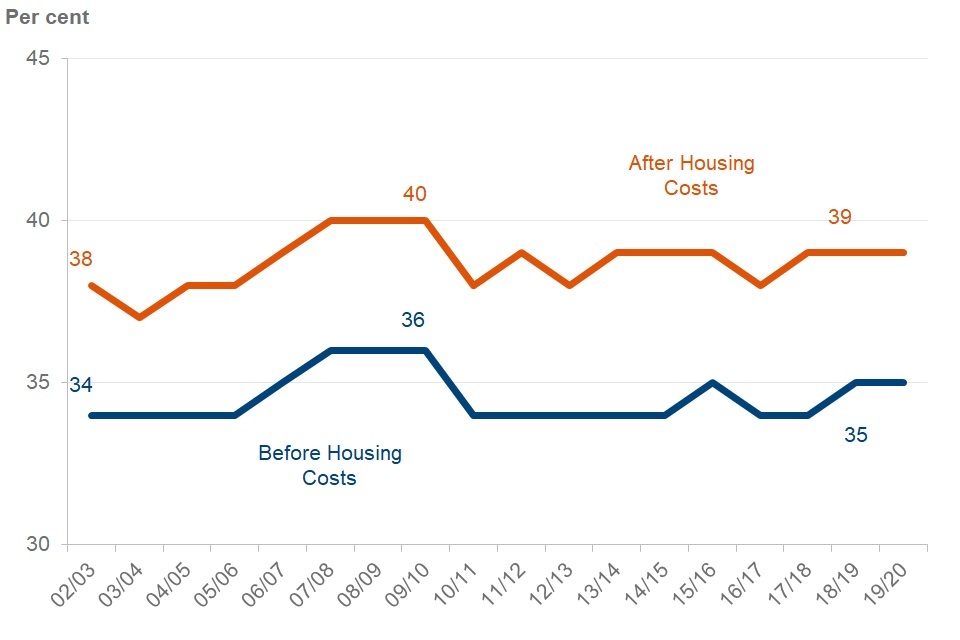
The Gini coefficient, ranging from 0% (low) to 100% (high), measures income inequality. The Gini coefficient has been very gradually rising since FYE 2011 for both BHC and AHC, up 1 percentage point to 35% BHC and up 1 percentage point to 39% AHC.
Low Income Measures
Low Income Measures – Relative BHC rose in FYE 2020, while both absolute measures fell
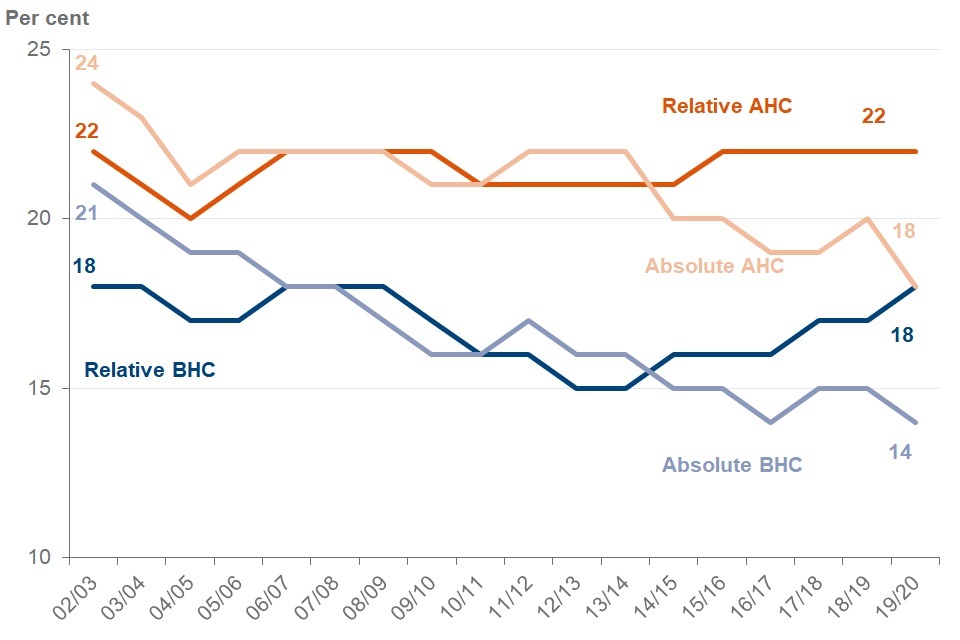
The percentage of individuals in relative low income has risen since around FYE 2014 both BHC and AHC, with BHC rising further this year to 18%. Absolute low income BHC and AHC has fallen over the same period, and both have decreased this year (AHC from 20% to 18%* and BHC from 15% to 14%).
2. What you need to know
HBAI is the foremost source for data and information about household income and inequality in the UK. Users include central Government, local authorities, academics, journalists and the voluntary sector. It meets DWP’s statutory obligation to publish a measure of relative and absolute low income, and low income and material deprivation for children under section 4 of the Welfare Reform and Work Act 2016.
Income measures
HBAI estimates incorporate widely-used international standard measures of low income and inequality. The primary measure used in HBAI is equivalised disposable household income adjusted for household composition (called equivalisation), estimated on both a before and after housing costs basis (BHC and AHC). Our main income measure includes contributions from earnings, state support, pensions, and investment income among others, and is net of tax.
HBAI uses this equivalised disposable household income as a proxy for living standards. A household is said to be in relative low income if their equivalised income is below 60% of median income, while they are in absolute low income if their equivalised income is below 60% of the 2010 to 2011 median income adjusted for inflation.
In line with international best practice, the income measures used in HBAI are subject to several statistical adjustments and, as such, are not always directly relatable to income amounts as they might be understood by people on a day-to-day basis. These adjustments, however, allow us to compare measures over time and across households of different sizes and compositions on a consistent basis.
HBAI uses variants of CPI inflation when estimating how incomes are changing in real terms over time. For further information, see the HBAI Quality and Methodology Information Report.
Survey data
Estimates are based on the Family Resources Survey (FRS), which has a sample of over 19,000 UK households. Use of survey data means results in this report are subject to uncertainty which can affect how changes should be interpreted, especially in the short term. Latest estimates should be considered alongside long-term patterns. Analysis at geographies below the regional level is not available from this data. The data in this report are from interviews conducted between April 2019 and March 2020. Interviews were suspended in mid-March 2020 in line with the national lockdown. At this point, nearly a full year’s worth of FRS interviews had already taken place and there is no material impact of COVID-19 upon these results. The HBAI statistics for FYE 2020 therefore form a key, pre-pandemic baseline of the household income distribution and of low income rates.
Statistical significance is a technical concept that says whether a reported change is likely to have arisen only by chance due to variations in the sampling. We calculate 95% confidence intervals around estimates in HBAI which sets a standard that, where any change is reported as statistically significant, there is less than a 1 in 20 chance that the reported difference is due to sampling variation and there is actually no real underlying change. Changes are not statistically significant unless highlighted by an asterisk (*). The reported change between two years in the supporting tables may not equal the difference between the rounded numbers for those years. This is because we round at the final point in any calculation.
Additional tables and data
A large number of ODS supporting tables are available online, breaking down results presented in this report for different demographic characteristics. Results are available for most series back to FYE 1995.
HBAI homepage (see Directory of Tables link on this webpage to locate tables referenced in the following pages and to generally find the desired tables).
UK-level HBAI data is available between FYE 1995 and FYE 2020 on the Stat-Xplore online tool. You can use Stat-Xplore to create your own HBAI analysis.
The source data behind these statistics is available for download for further analysis via the UK Data Archive.
New for this Publication
Household Food Security Tables
This year’s HBAI statistics include new tables showing the level of household food security for individuals living in low income households (see tables 9.1 to 9.8).
Questions are asked of the person in the household who knows the most about buying and preparing food. In common with the rest of the FRS, the focus is on the period of 30 days leading up to interview. The questions are comparable to those used by other public bodies in the UK, and also internationally. From the questions, a ten-point household score is generated, and the household is given a food security status:
-
High food security (score = 0): The household has no problem, or anxiety about, consistently accessing adequate food
-
Marginal food security (score = 1 or 2): The household had problems at times, or anxiety about, accessing adequate food, but the quality, variety, and quantity of their food intake were not substantially reduced
-
Low food security (score = 3 to 5): The household reduced the quality, variety, and desirability of their diets, but the quantity of food intake and normal eating patterns were not substantially disrupted
-
Very low food security (score = 6 to 10): At times during the last 30 days, eating patterns of one or more household members were disrupted and food intake reduced because the household lacked money and other resources for food.
Households with high or marginal food security are “food secure”. Food secure households are considered to have sufficient, varied food to facilitate an active and healthy lifestyle. Households with low or very low food security are “food insecure”. The banner of food insecurity covers a wide range of circumstances; where there is risk of, or lack of access to, sufficient, varied food. Please see tables 9.1 to 9.8, plus the FRS and HBAI Methodology Reports for more information.
Revision to full Time Series due to treatment of Income from Child Maintenance
A minor methodological revision has been made to include within HBAI all income from child maintenance. In previous HBAI publications, child maintenance arranged directly between the parents or by court order was included, but child maintenance arranged via the Child Maintenance Service (or its predecessors) was not. From this year’s publication, child maintenance arranged via the Child Maintenance Service (or its predecessors) is now also included. This results in more income from child maintenance being included, in turn slightly increasing some household incomes and so tending to slightly reduce low income rates for families with children. The full back series (back to FYE 1995) has been revised – child maintenance arranged via the Child Maintenance Service or its predecessors added - so that all income from child maintenance income is included and comparisons over time are on a consistent basis across the full time series. This also means that figures for FYE 1995 to FYE 2019 in this year’s publication (FYE 2020 statistics) may be slightly different to the equivalent figures in previous publications. Please refer to the HBAI Quality & Methodology Report for more information.
Regarding the impact of the revision on levels of low income, the percentage of children in low income in FYE 2019 (previous publication) has been revised downwards by around 0.4 percentage points on an AHC basis and 0.2 percentage points on a BHC basis. Revisions in previous years are similar or slightly less and in most cases are unchanged rounded to the nearest percentage point. However, please note that the revisions are greater for family types with children who are more likely to receive income from child maintenance, in particular lone parent families. Conversely, the impact on low income rates for families without children is far less than the 0.2 and 0.4 percentage point figures quoted above. The impact of the revision on low income trends is even less because the revision each year is in the same direction – more income for some households with children – and broadly similar in scale over time. Please refer to HBAI Quality & Methodology Report for more information.
Reporting of Benefits in the FRS
As with all survey data, the source FRS data used in HBAI undergoes various quality assurance and editing processes each year to ensure its fitness for purpose. In particular, benefit amounts are edited using a combination of manual and automated processes. For the current survey year (FYE 2020), the process to edit benefit amounts has involved the more-automated use of administrative data to edit FRS-reported Universal Credit (UC) amounts. This is necessary because:
-
It is generally more complicated to check UC amounts than for other benefits, owing to the number of different components of the UC calculation
-
The time taken to manually edit UC amounts is therefore greater than for other benefits
-
The range of possible amounts values is wider than any other state benefit, running from nil to several hundred pounds per week
-
There has been a substantial increase in the number of UC observations since the previous survey year (FYE 2019), approximately doubling since then
Given the above factors, editing reported UC amounts data was a more challenging task than in previous surveys. Given the legal deadline to publish HBAI data by the end of March it is important to be efficient in survey processing. This more-automated UC amounts editing process has a minimal effect overall on household incomes. There is, however, likely to be a small impact on the income distribution, particularly in the bottom quintile where a greater proportion of income comes from income-related benefits.
The level of benefit caseload undercount varies by benefit and across survey years. The extent of this is shown clearly in the FRS Methodology tables, especially Table M.6a: Receipt of state support, FRS data and administrative data. Compared with FYE 2019, the main changes are increasing levels of undercount for Personal Independence Payment (PIP) and Housing Benefit (HB). The PIP undercount has increased from approximately 360 thousand to 690 thousand cases. For HB, a small over count (60 thousand) in FYE 2019 has become an undercount of 690 thousand in FYE 2020. However, some of this is due to the increased editing of UC cases noted above e.g. where an FRS respondent reported receipt of both UC and HB and the benefit editing showed that they were receiving their housing support within UC. Regarding the UC caseload undercount, the UC caseload itself approximately doubled between FYE 2019 and FYE 2020. Therefore, although the UC caseload undercount increased from 470 thousand to 660 thousand this was actually a slight decrease in relative terms (a decrease in caseload undercount from 39% to 32% compared with administrative data).
The impact on the income distribution of an increase in benefit caseload undercount is not possible to establish precisely: it depends on the reason for the increased undercount. If the cause of the undercount is that benefit recipients are responding to the survey but not reporting some or all of their benefits, then household incomes for these respondents, who tend to be in the bottom half of the income distribution, would be under-estimated. However, if the cause of the undercount is that a higher proportion of benefit recipients are not responding at all to the survey, then benefit recipients would be under-represented in the FRS sample and households not receiving benefits over-represented. Since households not receiving benefits tend to have higher incomes, this would mean household incomes overall would tend to be over-estimated.
Development of processes linking FRS data to administrative data will continue through 2021, in support of next year’s publication, and beyond. For more details please see the FRS Background Information and Methodology report.
3. The Overall Income Distribution
Distribution of UK household income is skewed with a long right-hand tail of higher incomes.
The shape of the overall income distribution evolves slowly over time, with relatively small year-on-year changes.
Main Findings
The presence of large numbers of individuals with relatively high incomes results in a skewed or non-symmetric distribution. As a result, the median income (£547 per week BHC) is the standard measure of average income as changes in the mean can be driven by extreme values. The median represents the income of the individual in the middle of the distribution.
There are a large number of individuals with household incomes around the 60% of median income mark (£328 per week). Those falling below this line are considered to have relative low income. As a result of the decile clustering around this income level, relatively small movements in the overall distribution can sometimes lead to sizeable movements in this low income measure.
See Table 2.1 BHC for full data. AHC data is available in Table 2.1 AHC
Income distribution (BHC) for the total population, FYE 2020
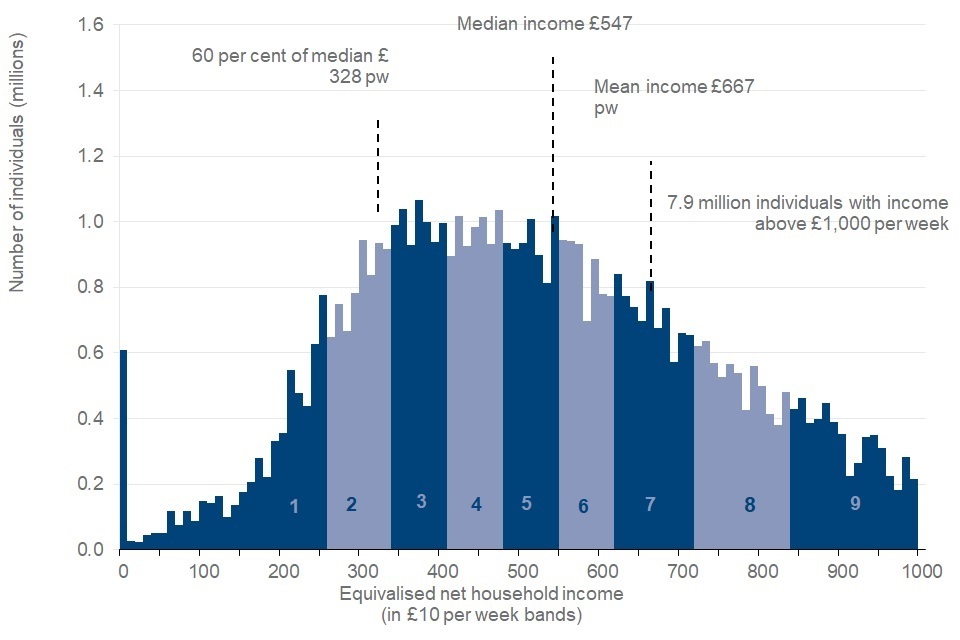
In FYE 2020, the average (median) real terms household income before housing costs significantly increased compared with FYE 2019 at £547 per week (around £28,600 per year). Average income after housing costs has also significantly increased to £476 per week (around £24,900 per year). Since the current survey series began in FYE 1995, there were generally steady increases in real terms income until FYE 2010. Following falls in FYE 2011 and FYE 2012, there were rises until FYE 2017.
See Table 2.1ts Decile for full data.
FYE 2020 was a good year in terms of the UK labour market, with employment growing, and earnings growth of 3.2% easily exceeding CPI inflation of 1.7%.
See Table 2.1tr for full data on economic indicators.
Deciles divide the population, when ranked by equivalised household income, into ten equal sized groups, and are indicated by 1 to 10 on the top chart, while quintiles divide the population into five groups. The shape of the overall income distribution evolves slowly over time.
Annual real terms change in income by quintile, FYE 2020 prices
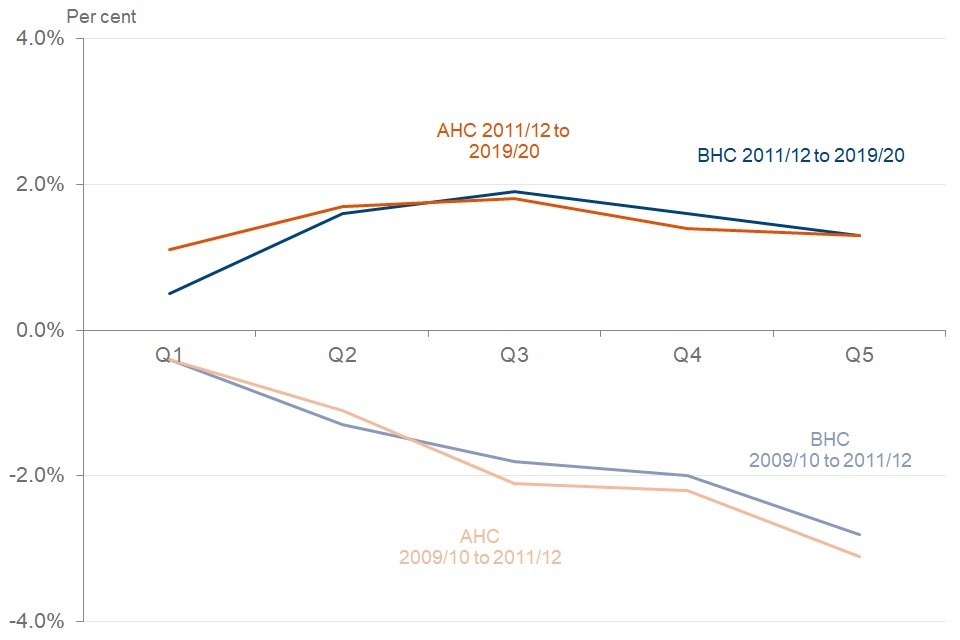
From FYE 2010 (the pre-recession median income high) to FYE 2012 (when median income stopped falling), median income fell by around 2% in real terms both BHC and AHC. During this period, incomes for those in lower quintiles fell by less, while incomes for those in higher quintiles fell by more. Since FYE 2012, growth has been highest in quintiles 2-5. The lower growth in the bottom quintile is partly due to a falling share of income from benefits for this quintile with an increased share from earned income.
See Table 2.1ts Quintile for full data
4. Income Inequality
Income inequality fell between FYE 2010 and FYE 2011, and has remained broadly flat since then.
Measures of inequality
Interpretation
The Gini coefficient is an international standard technical measure of how incomes are distributed across all individuals. It ranges from 0% (when everyone has identical incomes) to 100% (when all income goes to only one person).
Percentiles divide the population, when ranked by household income, into 100 equal sized groups.
The 90:10 ratio is the income at the 90th percentile divided by the income at the 10th percentile. It is equivalent to the average (median) income of the top 20% (quintile 5) divided by the average income of the bottom 20% (quintile 1). The higher the number, the greater the gap between those with high incomes and those with the low incomes.
Main Findings
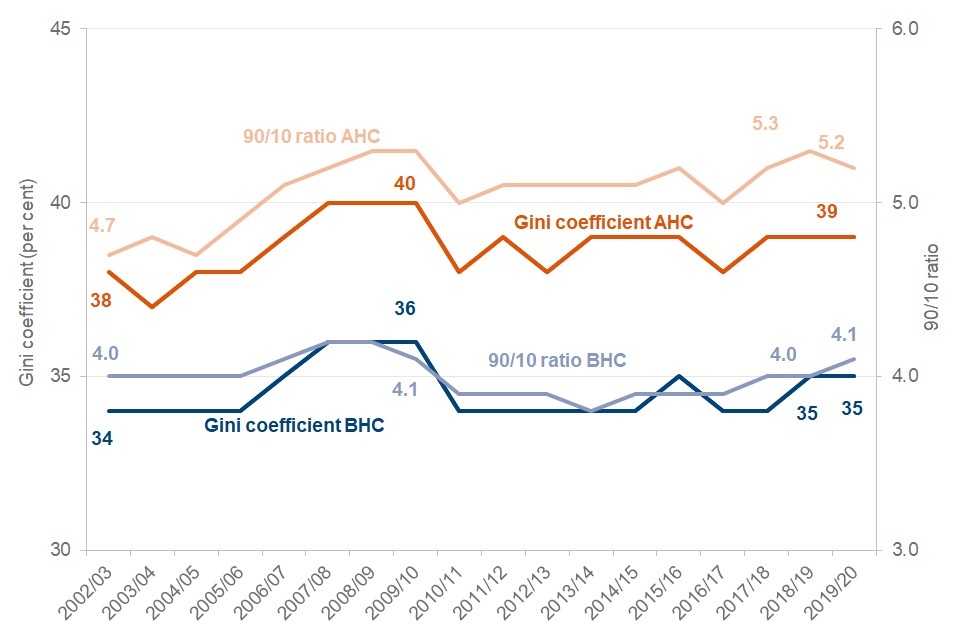
The BHC and AHC Gini coefficients continued to be slightly below their recent high points in FYE 2010, and both remained stable between FYE 2019 and FYE 2020. However, both have also been very gradually rising since FYE 2011, each up 1 percentage point to 35% BHC and 39% AHC.
See Table 2.1ts and 2.2ts for full data
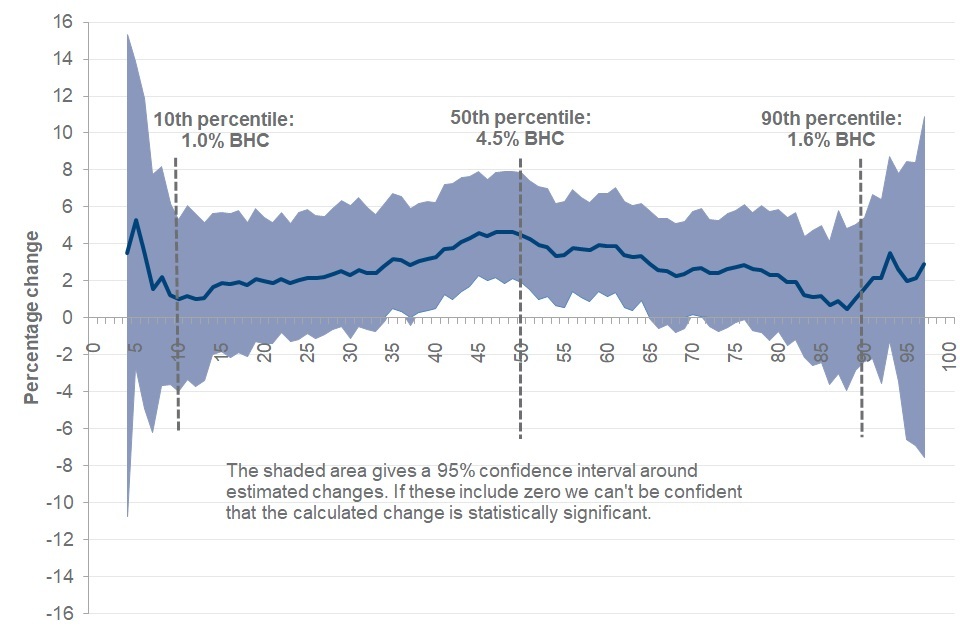
Change in real terms income BHC by percentile, FYE 2019 to FYE 2020
Interpretation
Looking at changes to incomes by percentile between FYE 2019 and FYE 2020 allows us to assess how the income for each part of the distribution has changed during this period.
Main Findings
Income changes across the entire distribution were larger between FYE 2019 and FYE 2020 than previous years, with the central estimate positive for all percentiles. The largest rises in BHC incomes were between the 45th and 50th percentiles, with these percentiles seeing an increase of 4-5%. Outside of these percentiles, income percentiles saw changes ranging from an increase of 0.5% to 4%.
Between the 40th and 65th percentile, the 95% confidence intervals do not include 0%, therefore these percentiles saw a significant increase in real terms income in FYE 2020 compared with FYE 2019.
In FYE 2020, both those below the 10th percentile and those above the 90th percentile saw an increase compared to FYE 2019. These changes resulted in a slight fall in the 90:10 ratio (AHC) from 5.3 to 5.2. However, the 90:10 ratio (BHC) increased slightly from 4.0 to 4.1 rounded to 1 decimal place.
See Table 1.1 for full data.
Those in the top 3% of the income distribution have at least 3 times the income of the average (median) household
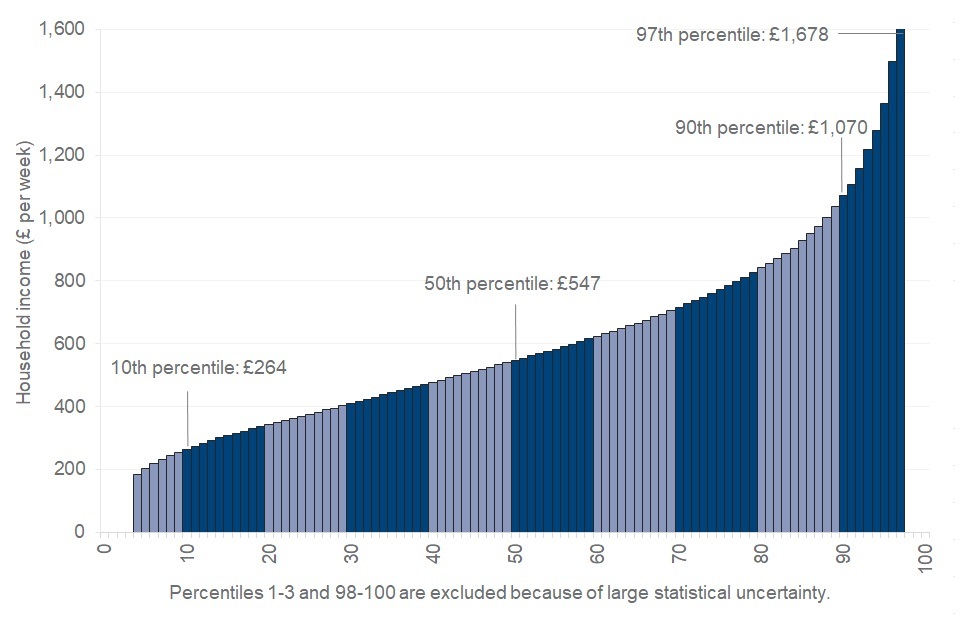
Weekly net equivalised household income BHC by percentile FYE 2020
Interpretation
Percentiles divide the population, when ranked by household income, into 100 equal sized groups. The chart indicates the amount of weekly net equivalised household income an individual requires to sit at each percentile of the UK income distribution.
Main Findings
Income BHC at the 10th percentile is a little less than half of the median (50th percentile) implying that around 10% of the population have less than half of the median household income BHC.
Incomes increase sharply past the 90th percentile BHC. In FYE 2020, income at the 90th percentile is about double that of the median, whilst the top 3% of the population (97th percentile and above) have at least three times that of the median.
See Table 1.2 for full data.
Annual net equivalent household income BHC by household type at different percentiles of the FYE 2020 UK distribution
| Percentile | Single individual | Couple with no children | Couple with two children under 14 |
|---|---|---|---|
| 10th | £9,200 | £13,800 | £19,300 |
| 50th | £19,200 | £28,600 | £40,000 |
| 90th | £37,500 | £55,900 | £78,300 |
| 97th | £58,800 | £87,700 | £122,800 |
Interpretation
To create income analysis by percentiles the population is ordered according to their equivalised household income. The annual income required to be at a given point in the distribution is therefore different for different household types. See page 13 for more information on equivalisation in HBAI.
Main Findings
Larger families require a higher level of household income to achieve similar ‘living standards’ (based on a household income measure) to smaller families.
To lie in the top half of the income distribution in FYE 2020, a single individual needed a net income over £19,200, compared to a couple with two young children who required a combined net income over £40,000.
In FYE 2020, a single individual with an annual net household income of over £37,500 would sit above the 90th percentile in the distribution, implying their income exceeded that of 90% of the UK population. A couple with two children receiving the same level of combined annual net household income would lie just below the middle of the income distribution and be considered to have slightly less than average (median) household income.
5. Sources of Income
The majority of household income in the UK comes from either earnings or state support
Income sources as a percentage of gross income by percentile, FYE 2020
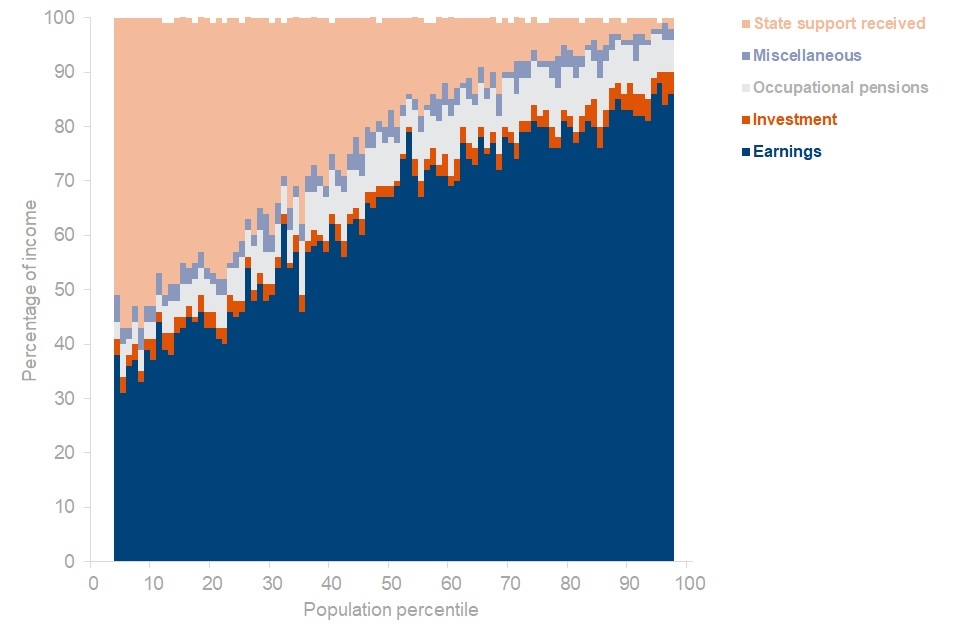
Percentiles 1-3 and 98-100 are excluded because of large statistical uncertainty. Percentages may not always sum to 100% due to rounding.
Interpretation
The charts show the different sources of gross income by percentile, ranking the population by income and dividing into 100 equal-sized groups. Income components are all considered before tax (gross). This is therefore a different definition of income from that used elsewhere in the HBAI report.
Main Findings
There is a clear pattern of higher income households receiving a large proportion of income from earnings, and lower income households receiving more of their income from state support. In FYE 2020:
-
earnings account for around a third of gross income for individuals around the 10th percentile compared to around 80% for individuals around the 90th percentile
-
the proportion of household income from earnings exceeds that received from state support for around 75% of the UK population (those above the 25th percentile)
-
households containing only working-age adults receive most of their income from earnings
-
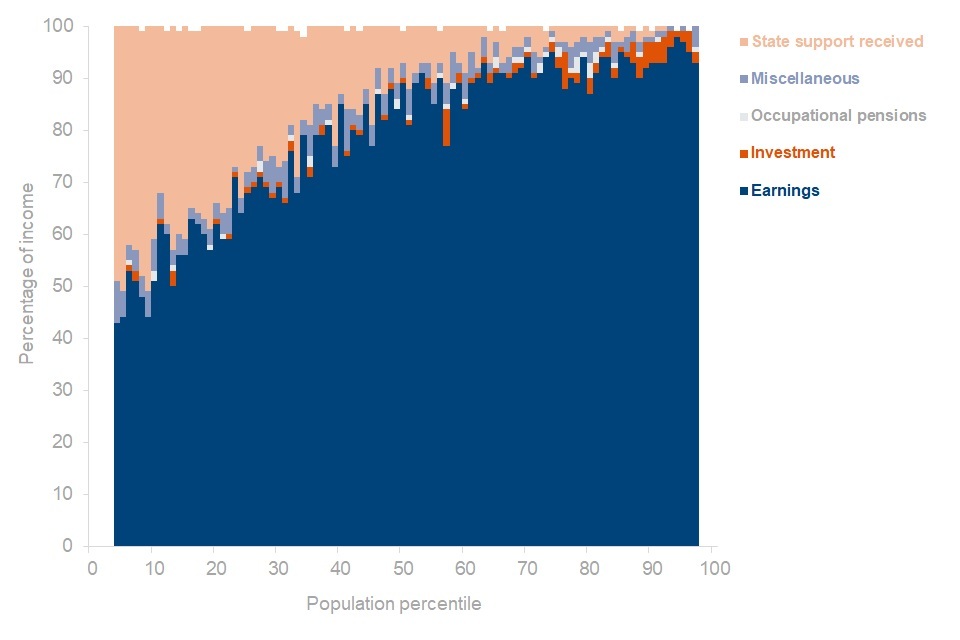
households containing children have similar income sources as households containing working-age adults only, except state support receipt generally makes up a larger proportion of income due to greater eligibility for state support (including child benefit and tax credits) for this group
-
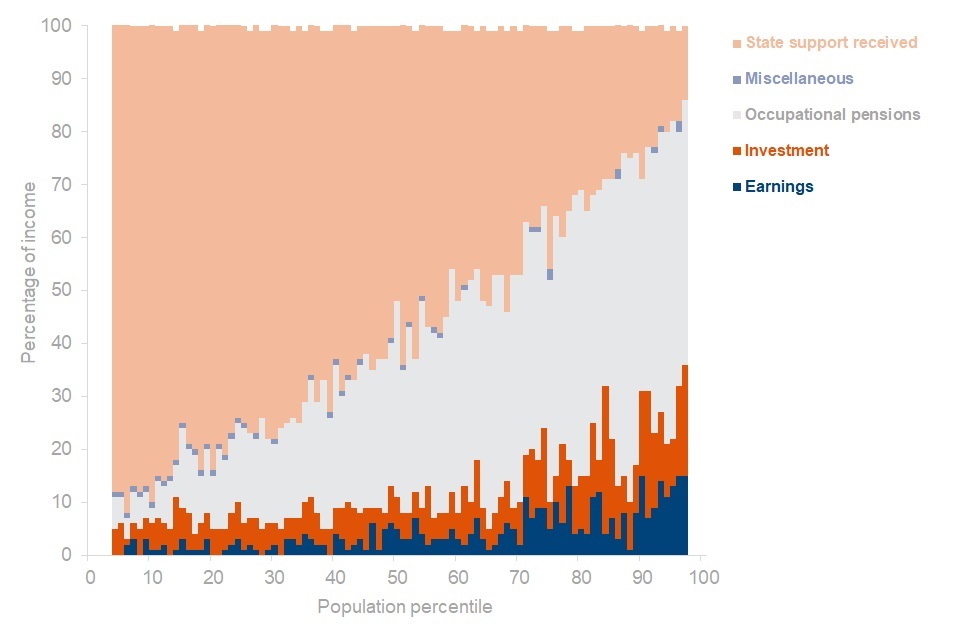
households containing pensioners and no children receive around 90% of their income from state support (particularly the state pension) and occupational pensions. Earnings and investments make a larger contribution of approximately 20% or more of income for those in the top half of the distribution
See Table 1.3, 1.4, 1.5 and 1.6 for full data.
Sources of income for households containing working-age adults
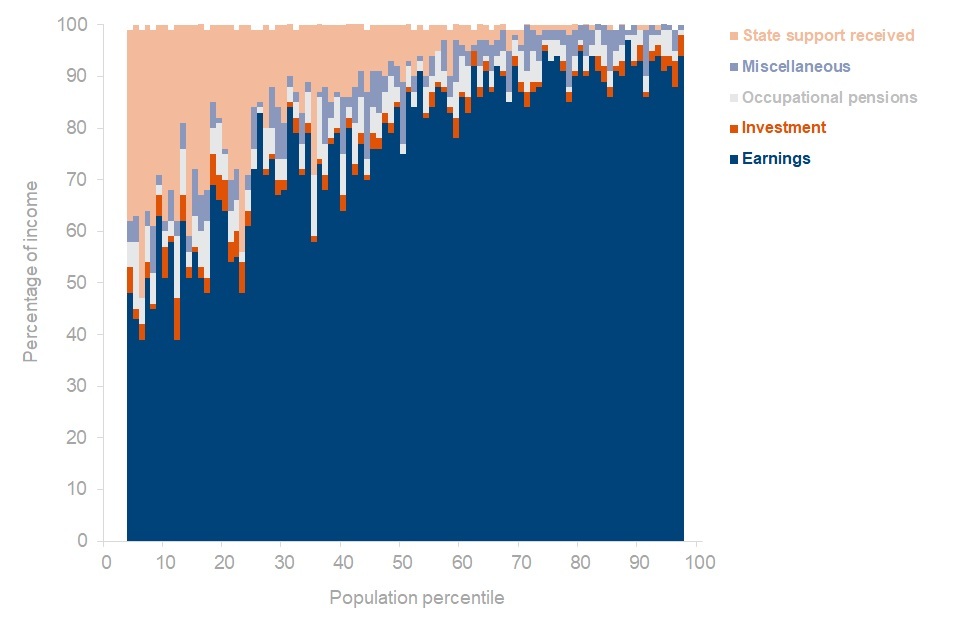
Sources of income for households containing children
Sources of income for households containing pensioners and no children
6. Low-Income Indicators
Absolute low income AHC for the overall population fell* in the latest year, relative low income AHC stable
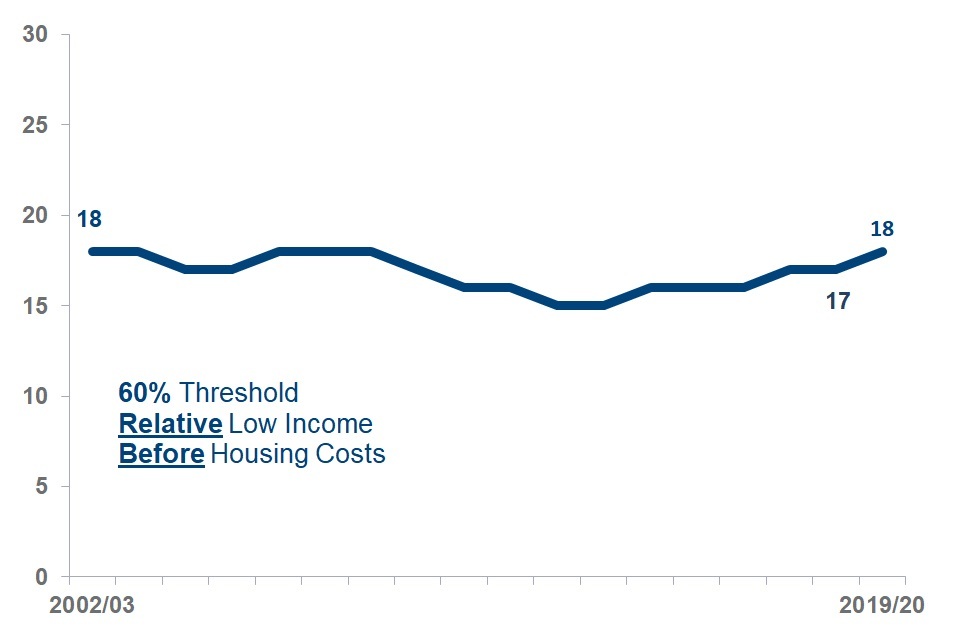
Percentage of individuals in relative BHC low income
Percentage of individuals in relative AHC low income
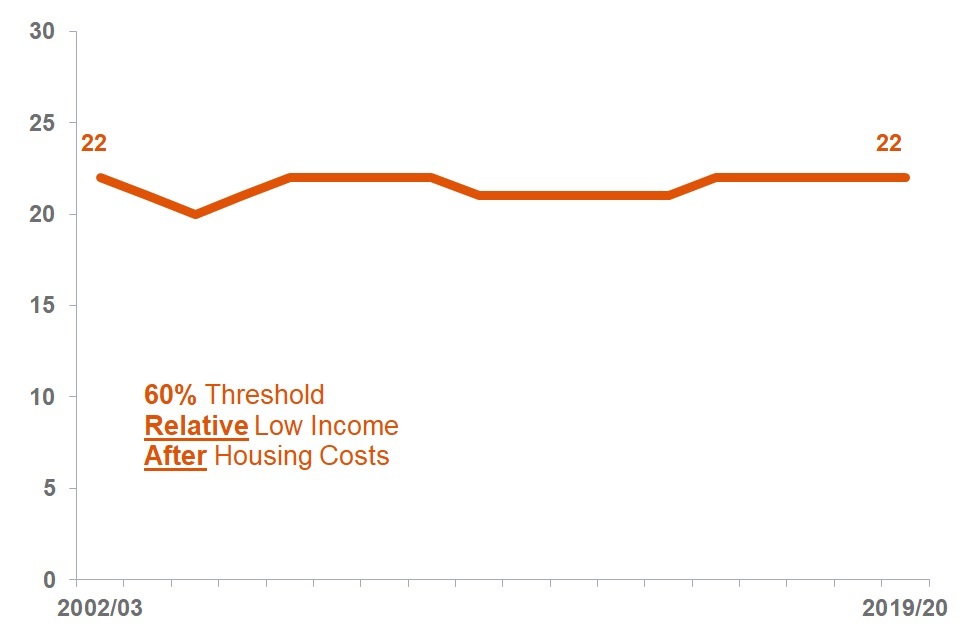
Relative low income sets a threshold as a proportion of the UK average (median) income and moves each year as average income changes. It is used to measure the number and proportion of individuals who have income below this threshold (typically 50, 60 or 70% of the median).
The percentage of individuals in relative low income will decrease if:
-
average (median) income stays the same or rises, and individuals with lower incomes see their incomes rise more than the average; or
-
average (median) incomes fall, and individuals with lower incomes see their incomes fall less than average incomes
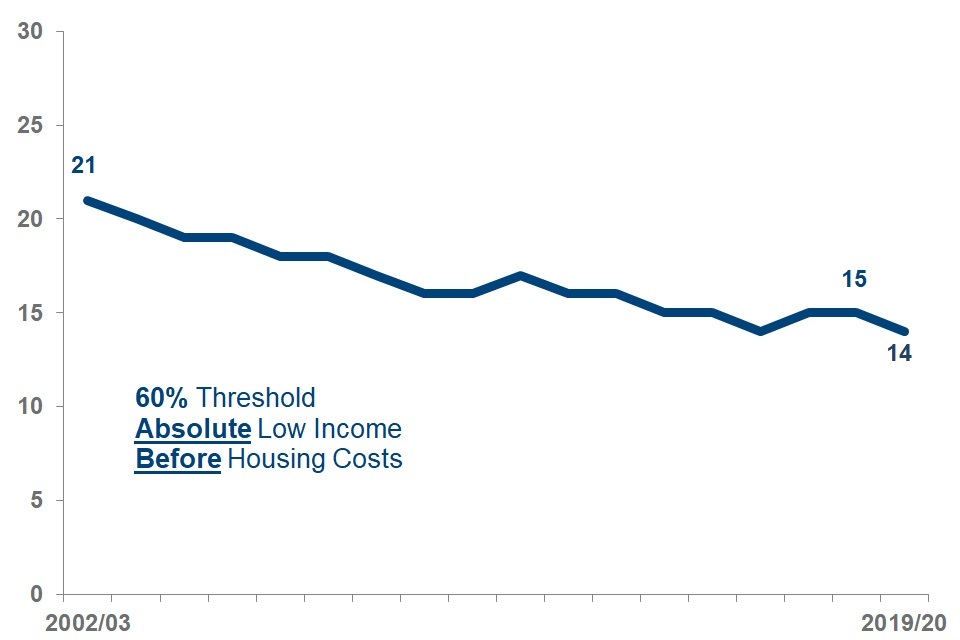
Percentage of individuals in absolute BHC low income
Percentage of individuals in absolute AHC low income
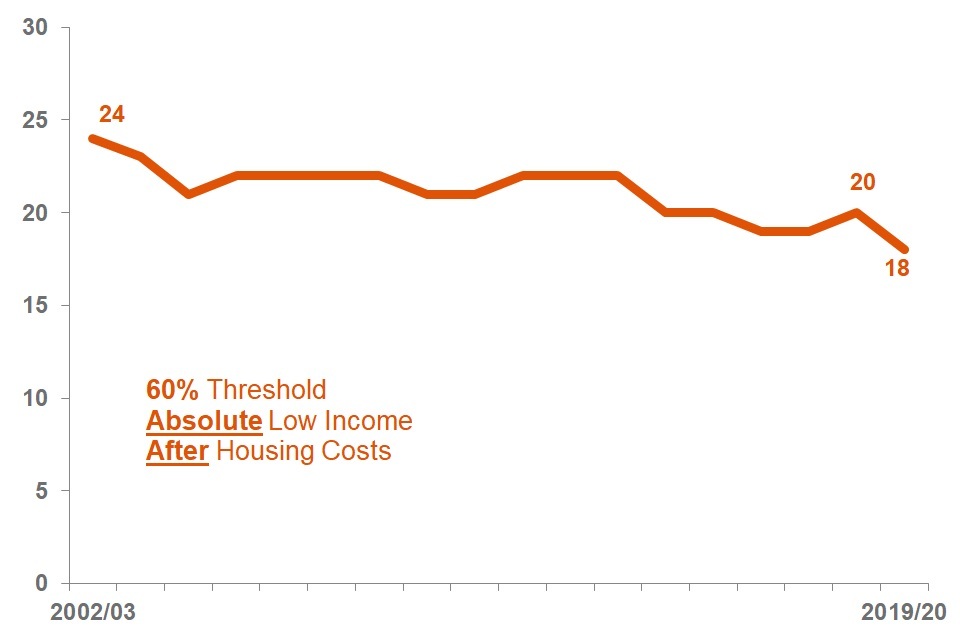
Absolute low income takes the 60% of median income threshold from 2010 to 2011 and then fixes this in real terms (i.e. the line moves with inflation). This is designed to assess how low incomes are faring with reference to inflation. It measures the number and proportion of individuals who have incomes below this threshold. Other thresholds are also available (for example 50% or 70% of median).
The percentage of individuals in absolute low income will decrease if individuals with lower incomes see their incomes rise by more than inflation.
See Tables 3.1tr and 3.2tr for full data.
Overall the percentage of individuals in relative low income BHC rose slightly and AHC remained stable in FYE 2020. The percentage of individuals in absolute low income AHC* and BHC fell, after increases in previous years.
Main Findings
The main findings are:
-
the percentage of individuals in relative low income BHC rose between FYE 2019 and FYE 2020 to 18%, and relative low income AHC remained at the previous year’s level of 22%
-
absolute low income BHC fell to 14% in FYE 2020 while absolute low income AHC decreased to 18%*. This was after a slight increase to 20% on the rounded percentages (less than 0.5 percentage points on unrounded data) in FYE 2019. Both BHC and AHC absolute low income remained below their recent highs in FYE 2012
-
the change in AHC low income rates since FYE 2019 has generally been more positive than the change in the equivalent BHC rates, especially for children and working-age adults. This is consistent with housing costs falling in real terms towards the bottom of the income distribution
-
patterns over the past twenty years show how year-on-year changes tend to be relatively modest, with longer-term patterns emerging over time
7. Children in Low Income Households
Three low income measures for children from HBAI are included in section 4 of the Welfare Reform and Work Act 2016 – a 60% threshold relative low income measure, a 60% threshold absolute low income measure, and a combined 70% threshold low income and material deprivation measure.
See Tables 4.1tr, 4.2tr and 4.5tr for full data.
Relative BHC* and AHC rose, while absolute low income BHC remained stable, and while AHC fell
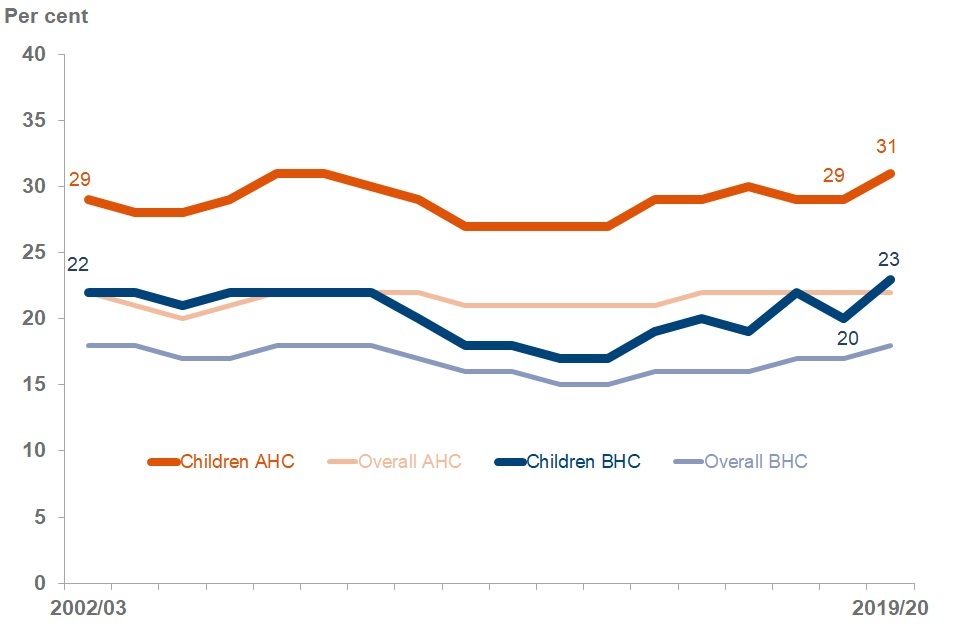
Percentage of children in relative low income
Percentage of children in absolute low income
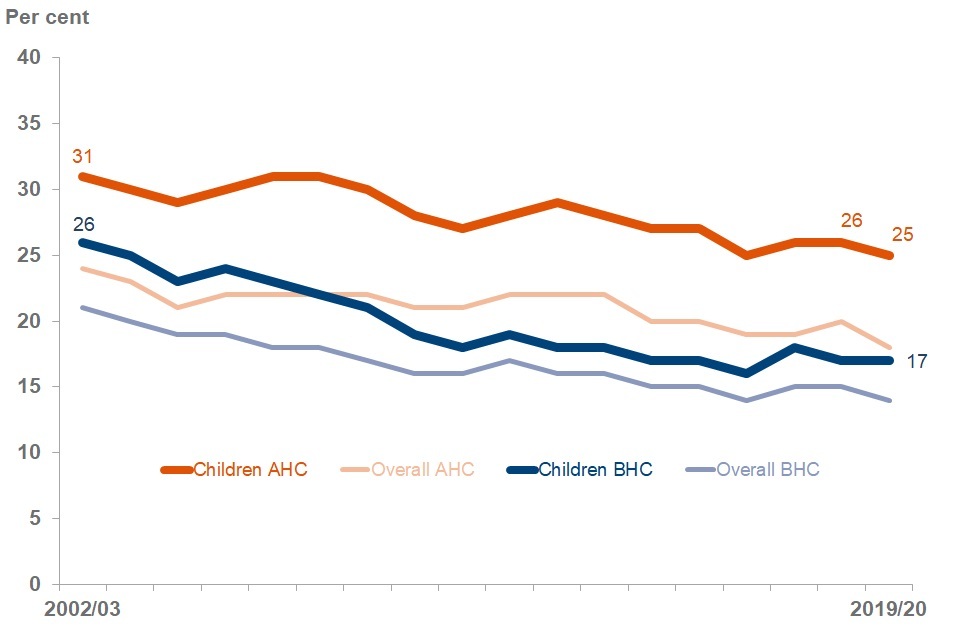
Main Findings
Between FYE 2019 and FYE 2020, relative low income BHC for children increased significantly, from 20% to 23%*. The AHC level also rose in FYE 2020 to 31%, following increases since FYE 2014 and is roughly at the level seen in FYE 2007 to FYE 2009.
Absolute low income for children BHC remained stable at 17% between FYE 2019 and FYE 2020, while AHC absolute low income fell from 26% to 25%. The percentage of children in absolute low income AHC remains at a historic low.
Compared to the overall population, children remain more likely to be in low income households.
Low Income and Material Deprivation increased
Percentage of children in low income and material deprivation
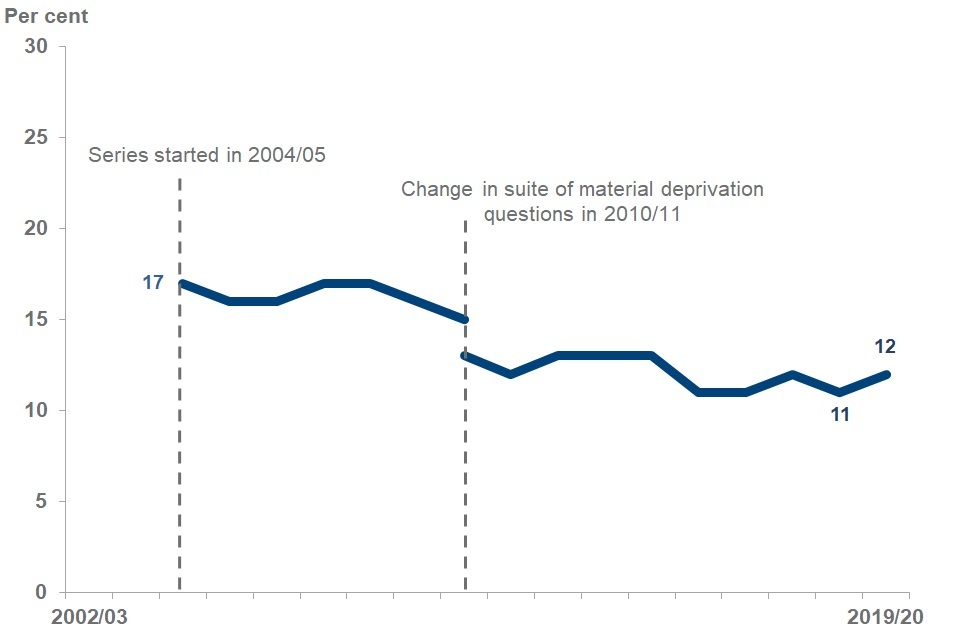
Interpretation
Child Low Income & Material Deprivation – respondents are asked whether they have access to a list of 21 goods and services. If they can’t afford a given item, this is scored in the material deprivation measure, with items more commonly owned in the population given a higher weighted score. A child is considered to be in low income and material deprivation if they live in a family that has a total score of 25 or more out of 100 and an equivalised household income BHC below 70% of median. More details are available in the HBAI Quality and Methodology Information Report.
Main Findings
The percentage of children in low income and material deprivation increased to 12% in FYE 2020 reversing the previous year’s decrease. Movements since FYE 2011 have been small.
8. Working-age Adults in Low Income Households and Low Income by Work Status
Working-age adults make up around 60% of the UK population – as such changes in income for this group can drive overall results more than changes amongst children and pensioners (with each of these groups making up around 20% of the population). As shown on page 6, this group receive a greater proportion of their income from employment and so their results are more sensitive to changes in the labour market.
See Tables 5.1tr, 5.2tr, 5.2ts, 5.5ts, 5.11ts, 4.1ts, 4.6ts and 4.14ts for full data.
Absolute low income AHC decreased*, as did BHC and relative low income AHC. Relative low income AHC increased in FYE 2020
Percentage of working-age in relative low income
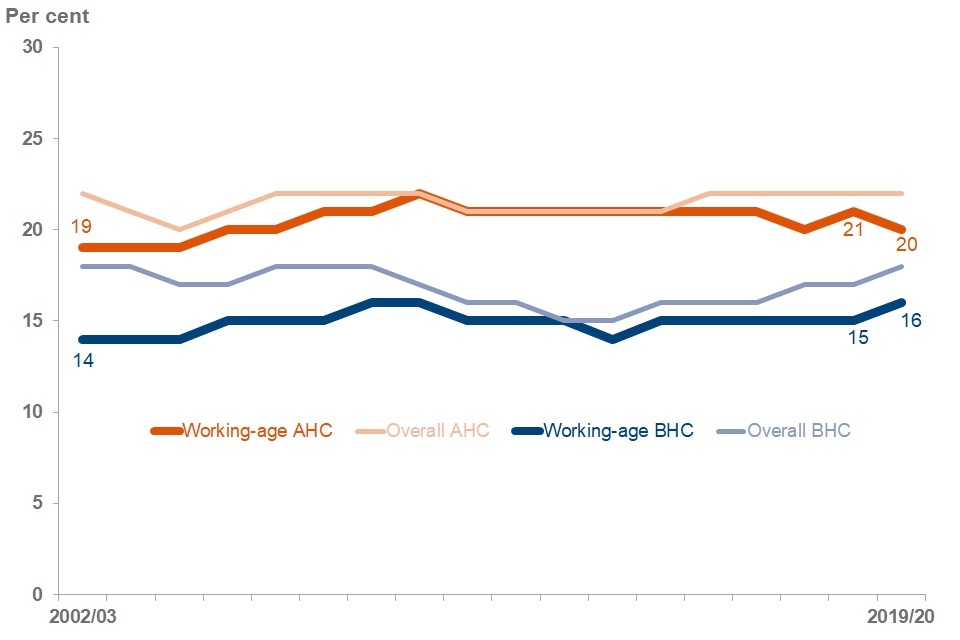
Percentage of working-age in absolute low income between
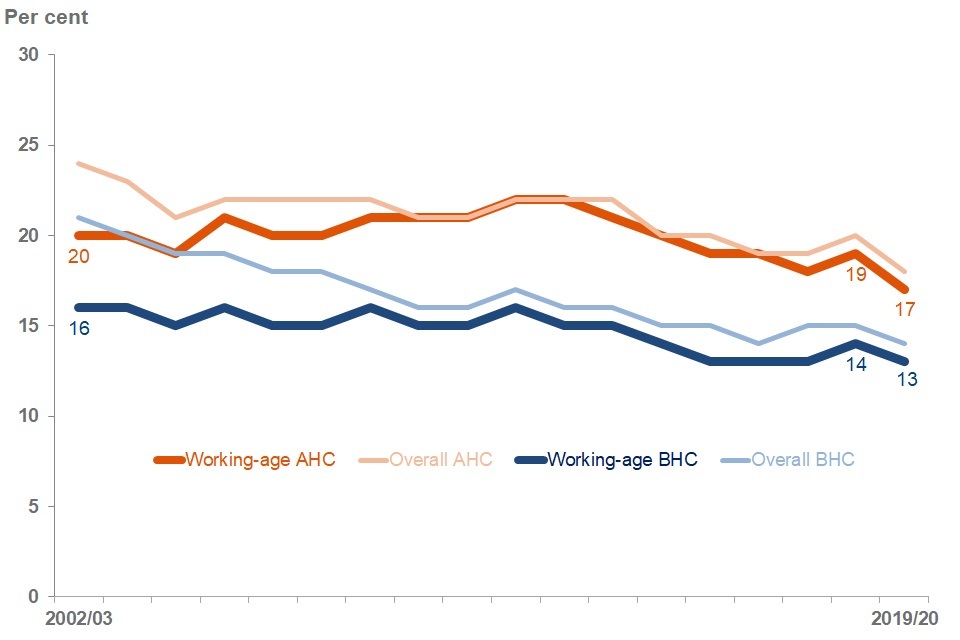
Main Findings
The percentage of working-age adults in relative low income BHC rose from 15% to 16% in FYE 2020, although the change was less than 0.5 percentage points on the unrounded data. Relative low income AHC decreased slightly to 20%. Looking further back, BHC and AHC rates have been broadly stable since around FYE 2011.
Absolute low income BHC decreased slightly to 13% of working-age adults, whilst absolute low income AHC decreased significantly from 19% to 17%. This reverses the increases in both measures the previous year and is in line with the broadly downwards trend since FYE 2012.
The relative low income figures in FYE 2020 are broadly consistent with the stable long-term trends.
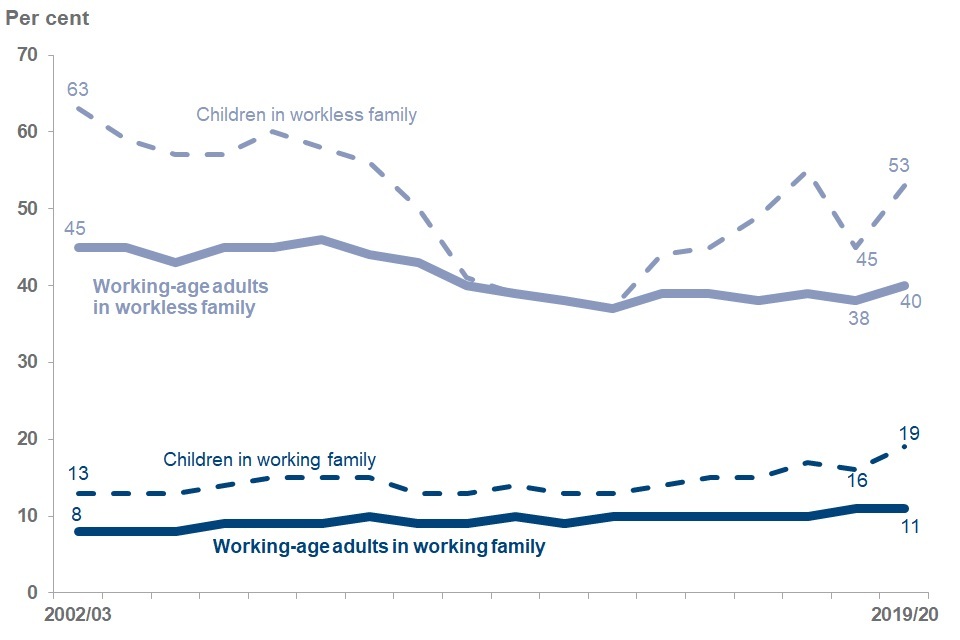
Percentage and composition of working-age adults and children in low income by work status
Relative low income BHC
Relative low income, composition and risk in FYE 2020, BHC
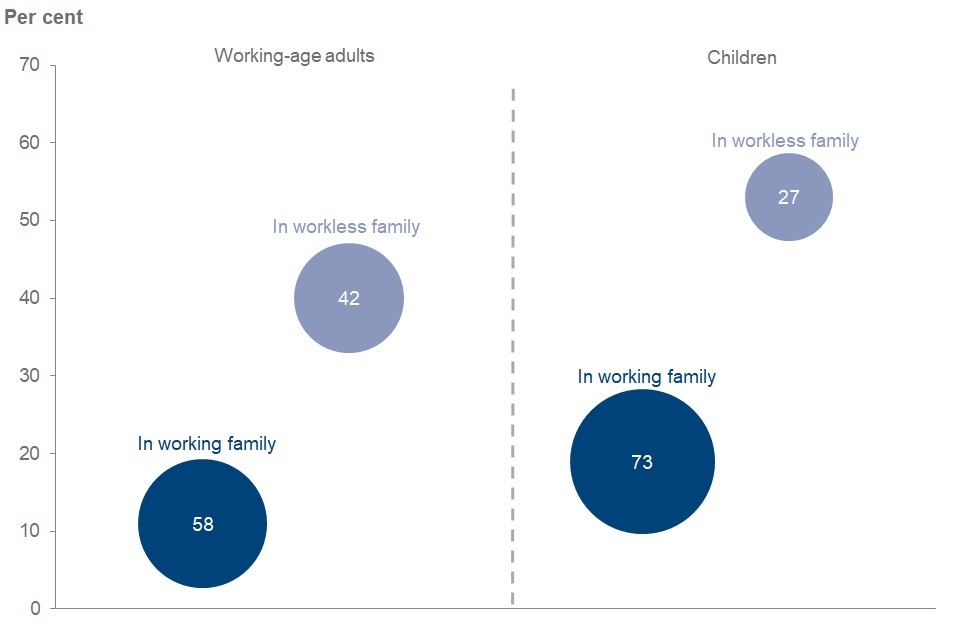
The size of the bubble shows the share of those in low income in each group. For instance, looking at the lowest bubble shows that 11% of working-age adults in working families were in low income BHC (shown by the level of the centre of the bubble), however of all working-age adults in low income, 58% were in a working family (shown by the size of the bubble).
In-work Low Income & Composition
Working-age adults and children in working families are much less likely to be in relative low income than those in families where no-one is in work. In FYE 2020, 11% of working-age adults in working families were in relative low income BHC compared to 40% in workless families, while 19% of children in working families were in relative low income BHC compared to 53% in workless families.
Although being in work reduces the likelihood of falling below low income measures amongst working-age adults and children, the majority of those in relative low income belong to working families. This is because the great majority of working-age adults and children belong to working families. In FYE 2020:
-
overall, 33.5 million working-age adults were in working families, and 6.6 million working-age adults were in workless families
-
11% of 33.5 million is greater than 40% of 6.6 million, meaning overall 58% of all working-age adults in low income were in working families
-
overall, 12.3 million children were in working families, and 1.6 million children were in workless families
-
19% of 12.3 million is over twice the size of 53% of 1.8 million, meaning overall 73% of all children in low income were in working families
9. Pensioners in Low Income Households
Around three-quarters of pensioners live in homes that are owned outright (compared to roughly 1 in 5 of the working-age population), and so face minimal housing costs. This means the proportion of pensioners in low income households tend to be lower AHC than BHC, unlike for children and working-age adults. We also estimate a broader material deprivation measure for pensioners. See Tables 6.1tr, 6.2tr, and 6.7tr for full data.
Relative low income for pensioners has been increasing since around FYE 2013, absolute low income has been broadly flat since FYE 2015 BHC or FYE 2010 AHC
Percentage of pensioners in relative low income
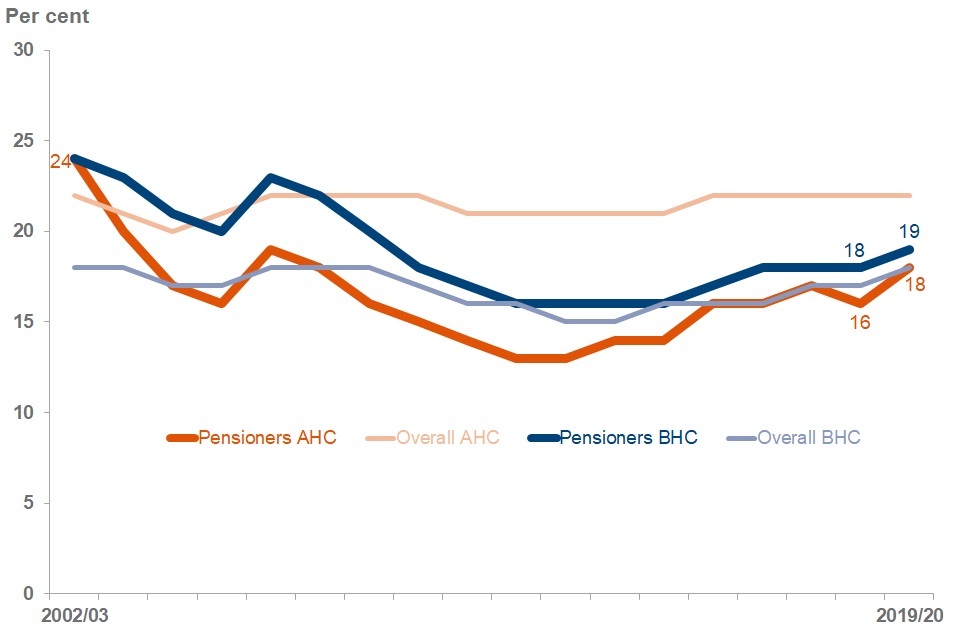
Percentage of pensioners in absolute low income
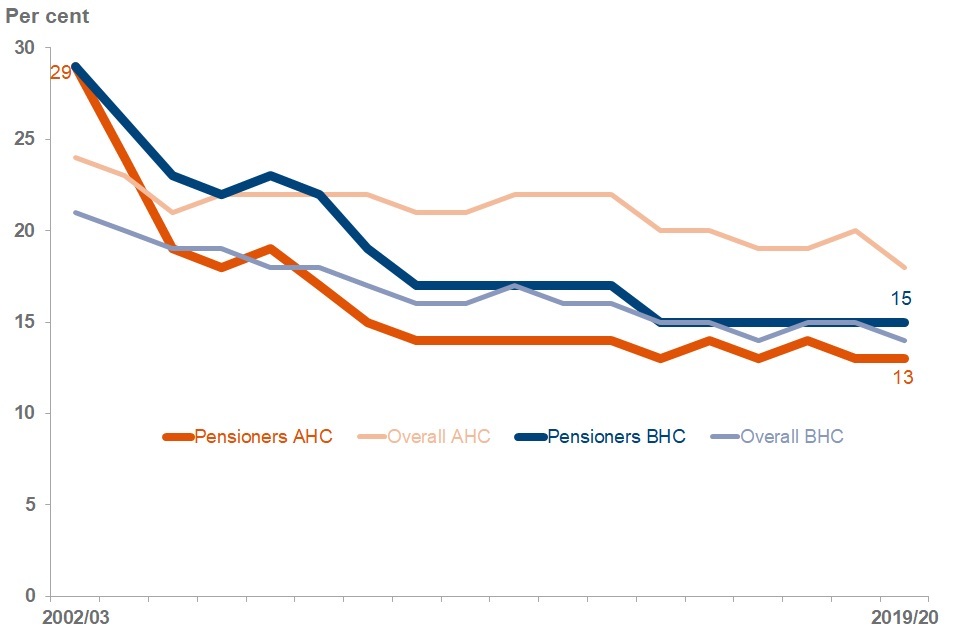
Main Findings
The percentage of pensioners in relative low income rose to 19% BHC and 18% AHC between FYE 2019 and FYE 2020. Absolute low income BHC and AHC remained stable on the rounded data, although on the unrounded data absolute low income AHC fell by over 0.5 percentage points.
Compared to the overall UK population, pensioners have been less likely to be in relative or absolute low income AHC from around FYE 2005, and similar levels BHC since around FYE 2010. This is due to large reductions in rates of low income for pensioners until around FYE 2010.
Material Deprivation was stable in FYE 2020
Percentage of pensioners in material deprivation
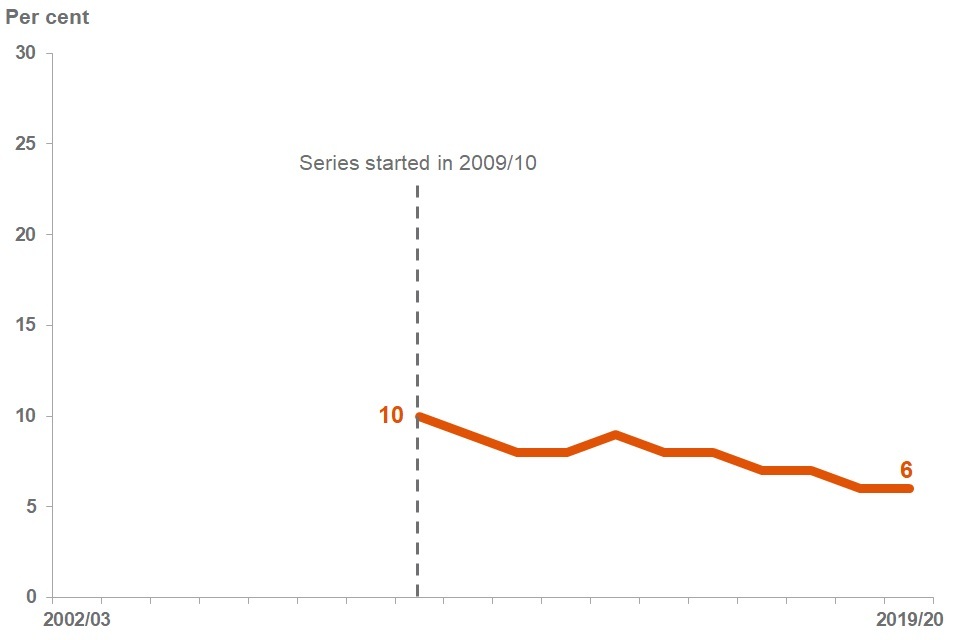
Interpretation
pensioners aged 65 or over are asked whether they have access to a list of 15 goods and services. If they don’t have a given item (because of cost, health, or availability), this is scored in the material deprivation measure, with items more commonly owned in the population given a higher weighted score. A pensioner is considered to be in material deprivation if they live in a family that has a final score of 20 or more out of 100. More details are available in the HBAI Quality and Methodology Information Report.
Main Findings
The percentage of pensioners in material deprivation remained stable between FYE 2019 and FYE 2020 at 6%. There has been a broadly downward trend since FYE 2014.
10. People in Low Income Households, by disability in the family
Relative BHC* and AHC low income measures where somebody in the family is disabled increased in FYE 2020
Percentage of individuals in relative low income, by family disability
Percentage of individuals in absolute low income, by family disability
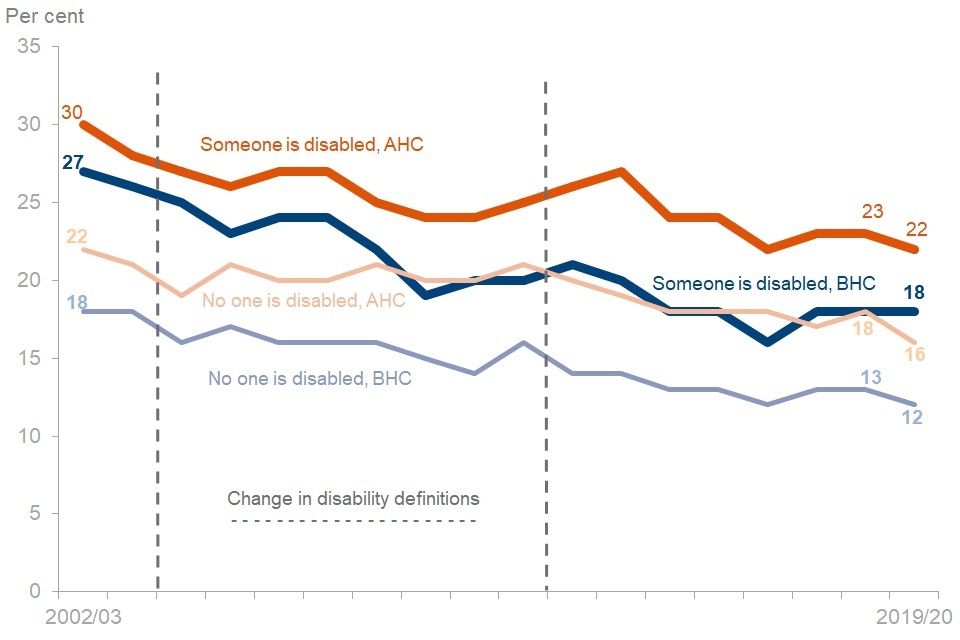
Interpretation and Definitions
Disabled people are identified as those who report any physical or mental health condition(s) or illness(es) that last or are expected to last 12 months or more, and which limit their ability to carry out day-to-day activities a little, or a lot. This is in line with the Equality Act definition.
The means of identifying people with a disability has changed over time however, with different criteria applied for FYE 2003 to FYE 2004; FYE 2005 to FYE 2012; and FYE 2013 to date. As such, changes over time in the number of individuals with disabilities could be affected by the changes in the disability questions.
Further, different individuals may also have different interpretations of particular health conditions or question wording, meaning that changes to the disability questions may have had a different effect on different groups.
Therefore, comparisons between figures from FYE 2013 onwards with earlier years should be made with caution.
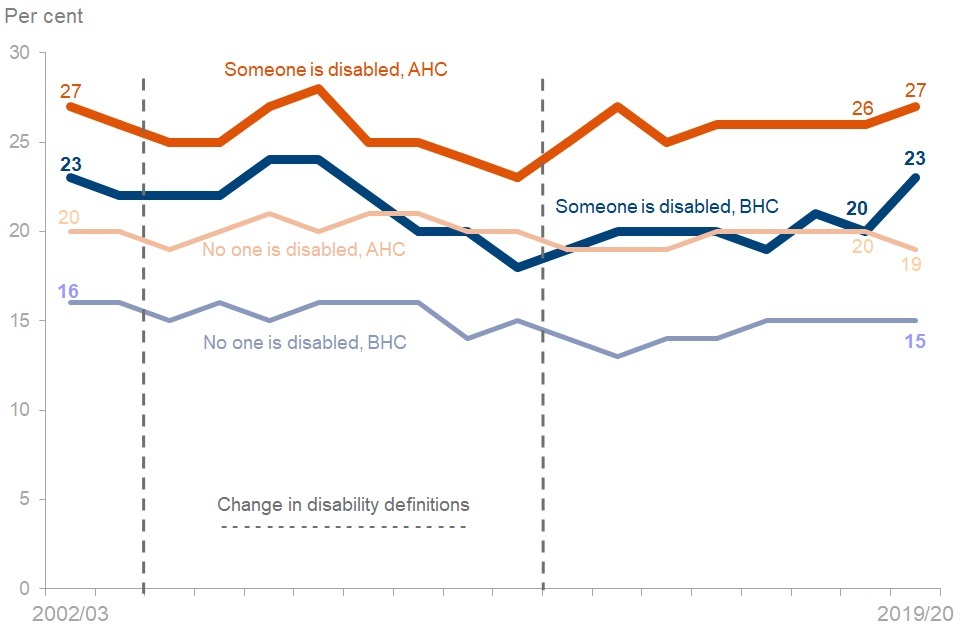
Percentage of individuals in low income BHC, by group for families containing someone who is disabled
Percentage of individuals in relative low income, by family disability
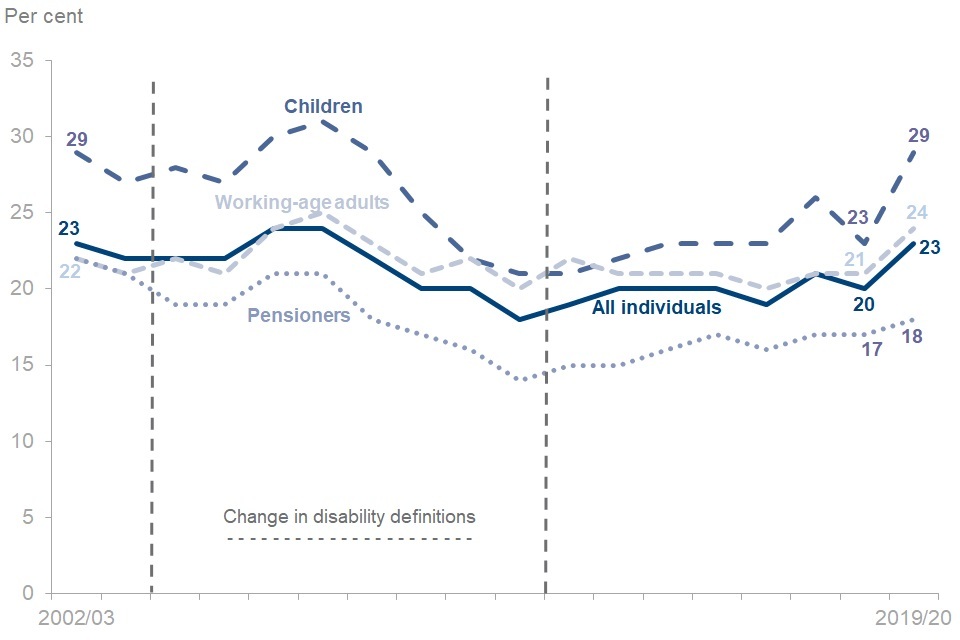
Percentage of individuals in absolute low income, by family disability
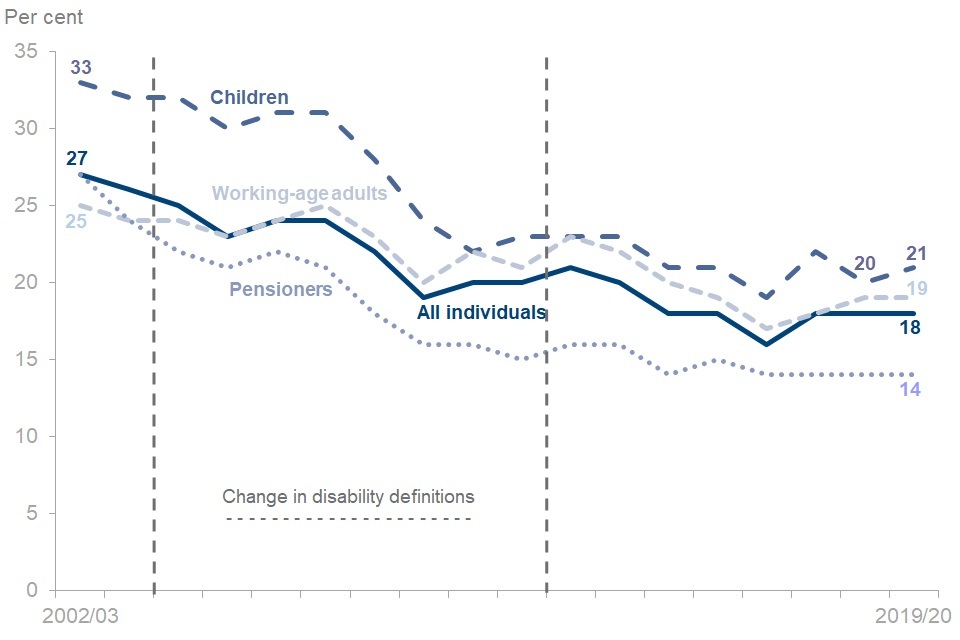
Main Findings
There is no direct relationship between trends for those with and without disabled family members. Different factors could affect the income of these households. We know, for example, that working-age adults with disabilities are less likely to be in employment, and that disability is more prevalent amongst pensioners.
On relative and absolute low income measures both BHC and AHC, those living in a family with a disabled member are more likely to be in low income than non-disabled families.
Between FYE 2019 and FYE 2020, relative low income BHC for those in families where someone is disabled rose from 20% to 23%*, while relative low income AHC in families where someone is disabled rose from 26% to 27%. Absolute low income BHC has remained stable at 18% for those in families where someone is disabled between FYE 2019 and FYE 2020, whereas AHC fell from 23% to 22%.
Looking at low income rates BHC by group shows large reductions in rates of low income for all groups and all measures between FYE 2008 and FYE 2010, with smaller movements either side of this period. The percentage of people in low income in families with a disabled person generally increased between FYE 2019 and FYE 2020. This increase was largely due to children in families with a disabled person, where there were rises in both the relative (from 23% to 29%) and absolute (from 20% to 21%) BHC measures.
See Summary tables 1.7a, 1.7c, 1.7e and 1.7g for full data.
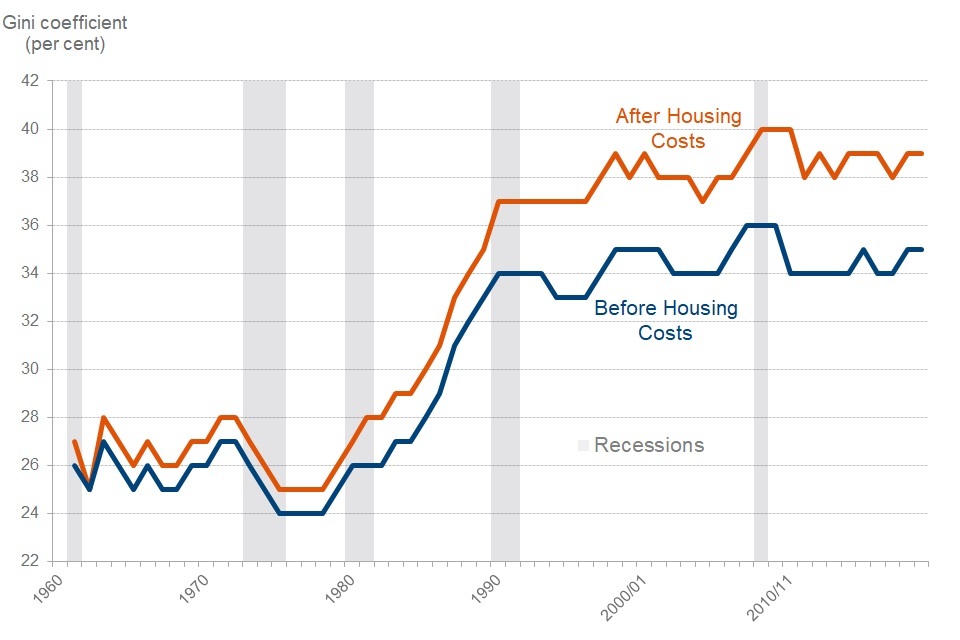
11. Long-term Trends (data prior to FYE 1995 are not National Statistics)
Work undertaken by IFS to extend HBAI trends back to 1961 shows large increases in inequality over the 1980s
Gini Coefficient
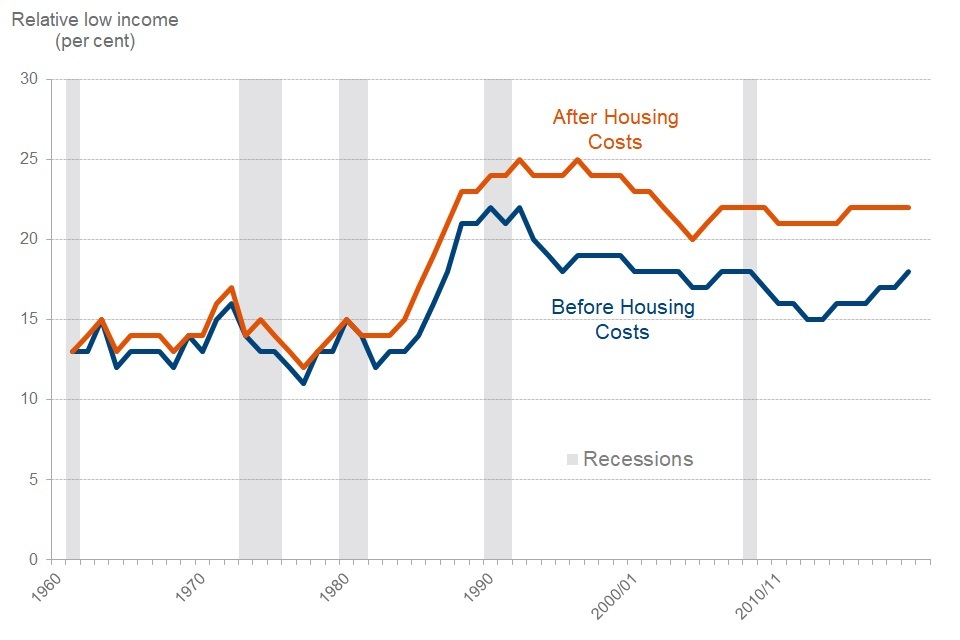
Relative Low Income
Absolute Low Income
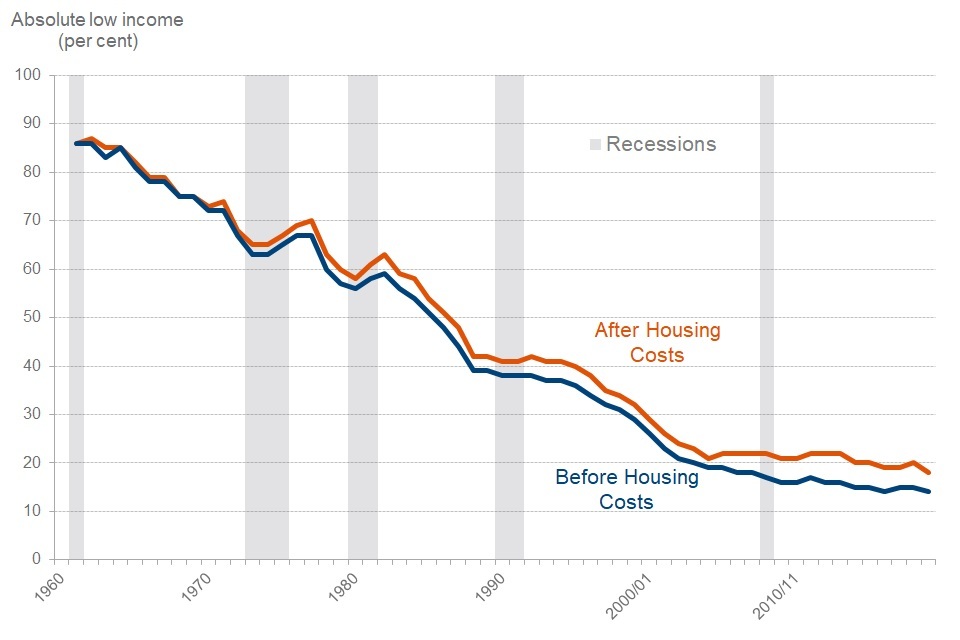
Main Findings
Looking at trends over the past 50 years, incomes across the population have increased dramatically in real terms over time, driving falls in absolute low income. This pattern has held fairly consistently over time, with rises in absolute low income relatively rare.
Over the 1980s, however, incomes for those further up the income distribution grew more quickly than for those at the bottom, driving large increases in income inequality (Gini) and in relative low income measures.
From the early 1990s, income inequality measures in the UK have remained relatively stable, although analysis by Atkinson, Piketty et al, held at the World Inequality Database suggests that increasing inequality has continued with incomes for those within the top 1% continuing to grow faster than for the rest of the distribution. Changes this far up the distribution will not be captured well in HBAI data.
Interpretation
The increase in income inequality (and in relative low income) over the past 40 years or so has been driven in part by a significant increase in individual earnings inequality over the same period. Partial explanations for wider trends are:
-
from the late-1970s there was a large rise in unemployment following the recession, accompanied by increasing inequality in earnings – driven in part by factors like increases in part-time working
-
from the mid-1980s increasing income inequality was further driven by incomes of those in employment pulling away from those who are economically inactive (including pensioners) as growth in employment income rose faster than for other sources such as benefits
-
in the late-1980s the widening of the income distribution was driven further by increases in earnings inequality, with increasing differences between wages for different occupations
-
by the early 1990s the picture began to stabilise with incomes of those economically inactive starting to catch up to those in employment
-
in the early 2000s falls in low income measures were driven by increasing relative incomes for families with children and pensioners – driven in part by the introduction of tax credits and the Basic State Pension “triple lock”
See the IFS publication for full data and Accounting for changes in inequality for detailed decomposition analysis of trends.
12. Measuring income in HBAI
HBAI uses data from the Family Resources Survey (FRS) to derive a measure of disposable household income. Adjustments are made to take into account the size and composition of households to make figures comparable.
FRS Survey Data
The FRS covers a sample of over 19,000 private households in the United Kingdom. Therefore, certain individuals, for example students in halls of residence and individuals in nursing or retirement homes will not be included.
Sampling Error
Results from surveys are estimates and not precise figures - in general terms the smaller the sample size, the larger the uncertainty. Confidence intervals help to interpret the certainty of these estimates, by showing the range of values around the estimate that the true result is likely to be within.
Non-sampling Error
These results are based on data from respondents to the survey. If people give inaccurate responses or certain groups of people are less likely to respond this can introduce biases and errors. This non-sampling error can be minimised through effective and accurate sample and questionnaire design and extensive quality assurance of the data. However, it is not possible to eliminate it completely, nor can it be quantified.
Income
This is measured as total weekly household income from all sources (including child income) after tax, national insurance and other deductions. Income measures are presented before and after housing costs (rent, mortgage interest payments, buildings insurance etc.)
A household income measure implicitly assumes that all members of the household benefit equally from the household’s income and so appear at the same position in the income distribution.
SPI adjustment
Estimates of mean income and some inequality measures are very sensitive to fluctuations in incomes at the top of the distribution. An adjustment to correct for this is made to ‘very rich’ households in FRS-based results using data from HMRC’s Survey of Personal Incomes.
Key Definitions
Household
One person living alone or a group of people (not necessarily related) living at the same address who share cooking facilities and share a living room, sitting room or dining area. A household will consist of one or more benefit units or families.
Family or Benefit Unit
A single adult or a couple living as married and any dependent children.
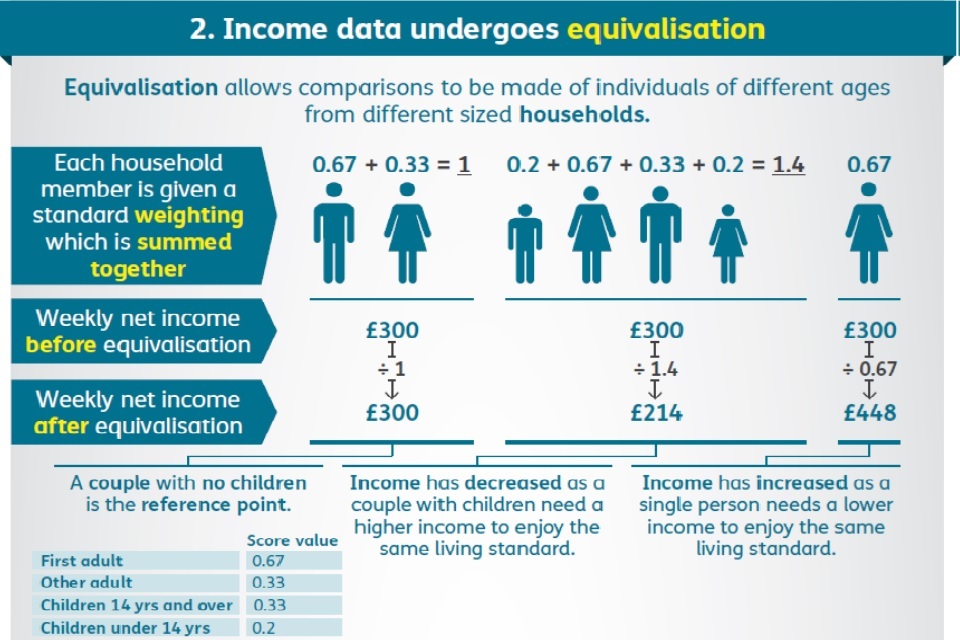
Equivalisation
An adjustment is made to income to make it comparable across households of different size and composition. For example, this process of equivalisation would adjust the income of a single person upwards, so their income can be compared directly to the standard of living for a couple.
Equivalisation
Inflation is the speed at which the prices of goods and services rise or fall. The use of different inflation measures has an effect on trends in average household income and absolute low income measures in HBAI.
HBAI uses variants of CPI to adjust for inflation to look at how incomes are changing over time in real terms i.e. if, for example, average incomes rise by 3% in cash terms but inflation is higher at 5%, then we will record a fall in average incomes as the real average purchasing power of incomes has fallen.
13. About these statistics
The income measure used in HBAI is weekly net disposable equivalised income Before Housing Costs measuring income from all sources from all household members including:
-
usual net earnings from employment
-
profit or loss from self-employment (losses are treated as negative income)
-
state support – all benefits and tax credits, including state pension
-
income from occupational and private pensions
-
investment income
-
all maintenance payments
-
income from educational grants and scholarships
-
the cash value of certain forms of income in kind, including free school meals
Income is net of:
-
income tax and National Insurance contributions
-
domestic rates and council tax
-
contributions to occupational pension schemes
-
all maintenance payments
-
student loan repayments
-
parental contributions to students living away
Income After Housing Costs is derived by deducting housing costs, including:
-
rent (gross of housing benefit)
-
water rates, community water charges and council water charges
-
mortgage interest payments
-
structural insurance premiums
-
ground rent and service charges
Negative Incomes BHC are reset to zero, but negative AHC incomes are possible
Children are defined as individuals aged under 16; or aged 16 to 19 in full-time non-advanced education.
Pensioners are defined as individuals over their state pension age at the time they are interviewed.
National Statistics Status: The regulatory arm of the UK Statistics Authority, the Office for Statistics Regulation (OSR), has designated these statistics as National Statistics, in accordance with the Statistics and Registration Service Act 2007, signifying compliance with the Code of Practice for Statistics.
National Statistics status means that official statistics meet the highest standards of trustworthiness, quality and public value and comply with all aspects of the Code. OSR has undertaken this assessment to consider whether the statistics meet the required standard. Since the latest review by the OSR, we have continued to comply with the Code of Practice for Statistics, and have made a number of improvements including:
-
publications have been made significantly shorter to enable a focus on commentary and analysis
-
the timeliness of the publication has been improved so that reports are released within 12 months of the completion of the Family Resources Survey, made possible by improvements to the background, publication and checking codes that are used to conduct analysis
-
by making our data available on Stat X-plore and the UK Data Service, our statistics are more accessible and support new analysis for users not included in the publications themselves
-
the quality of statistics have improved as variants of the Consumer Price Index (CPI) have replaced the use of Retail Prices Index (RPI) when adjusting for inflation, in line with guidance from the UK Statistics Authority and National Statistician
-
improved methodology for measuring and reporting uncertainty around key HBAI estimates
Where to find out more
Further outputs and reference tables from HBAI analysis, alongside our HBAI Quality and Methodology Information Report, giving further detail on how we estimate the measures reported here are available on the HBAI website.
Guidance on alternative sources of data on earnings and income is available on the ONS website and provides useful information to contextualise the HBAI statistics, with additional details on the ONS website.
Other National and Official Statistics
Details of other National and Official Statistics produced by the Department for Work and Pensions can be found on the DWP website with a schedule of statistical releases over the next 12 months and a list of the most recent releases. In accordance with the Code of Practice for Statistics, all DWP National Statistics are also announced on the Government Statistics website.
A closely-related source of key information on income is the Office for National Statistics’ analyses on Average Household Income and on the Effects of Taxes and Benefits on Household Income. As these statistics are based on survey data and so subject to statistical uncertainty, users are encouraged to take a holistic view across the full suite of results available on the ONS website.
-
Changes are not statistically significant unless highlighted by an asterisk (*). ↩