2026 HM Treasury COVID-19 Cost Tracker update
Published 28 May 2026

© Crown copyright 2026
This publication is licensed under the terms of the Open Government Licence v3.0 except where otherwise stated. To view this licence, visit nationalarchives.gov.uk/doc/open-government-licence/version/3 or write to the Information Policy Team, The National Archives, Kew, London TW9 4DU, or email: psi@nationalarchives.gov.uk.
Where we have identified any third party copyright information you will need to obtain permission from the copyright holders concerned.
This publication is available at https://www.gov.uk/government/statistics/hm-treasury-2026-covid-19-cost-tracker-update/2026-hm-treasury-covid-19-cost-tracker-update
1. Introduction
The COVID-19 Cost Tracker brings together data from across the UK government to show the costs of measures transparently. It provides estimates of the lifetime cost of measures announced in response to the COVID-19 pandemic as well as how much the government has spent on these measures so far (where this information is publicly available or has been provided to HM Treasury by government departments).
The National Audit Office (NAO) originally published the tracker, with its last publication in June 2022. To meet commitments to the Public Accounts Committee, HM Treasury published an update in July 2023. This new update is expected to be the final publication of the tracker given almost all measures have now been completed.
This publication references data previously published by the NAO.
You can download the COVID-19 Cost Tracker dataset by clicking the ‘Download data set’ button. The downloaded file will contain some additional detail on the data, such as descriptions of the measures and when the cost estimates were produced.
1.1 Overview
- £385bn: The amount the government expects to spend once all measures – both those still active and those already complete – are finished. This is an increase of £11bn since the previous publication, largely reflecting updated estimates of health spending and losses on loan schemes.
- £380bn: The amount the government has spent on these measures so far. There remains an estimated £5bn to spend across all active measures, mostly relating to expected losses on outstanding loans.
- £66bn: The net amount of government or Bank of England loans – for example, the Coronavirus Business Interruption Loan scheme – or guarantees. This is a reduction of £26bn, largely due to repayments of loans.
- 20: the number of measures that remain active.
1.2 New in this release
- This is the first publication of this document since the Machinery of Government (MoG) change that led to the dissolution of the Department for Business, Energy and Industrial Strategy (BEIS). Active measures previously owned by BEIS are now owned by the Department for Business and Trade, the Department for Science, Innovation and Technology, and the Foreign, Commonwealth and Development Office.
- On July 9, 2024, the Department for Levelling Up, Housing and Communities (DLUHC) reverted to its previous name, the Ministry of Housing, Communities and Local Government (MHCLG). Measures previously owned by DLUHC have been updated to reflect that they are now owned by MHCLG.
- There are two new measures included as part of this update. Both measures relate to spending by HM Treasury in relation to the COVID-19 Public Inquiry.
- Following the implementation of government’s ‘Living with COVID-19’ strategy, some COVID-19 spending is not separately identified from business-as-usual spending. For example, this often includes spending on the COVID-19 inquiry.
2. Further analysis
Table 1: New in this release
| 2022 NAO publication | 2023 HMT publication | 2026 HMT publication | Change | Commentary | |
|---|---|---|---|---|---|
| Estimated lifetime cost | £375.86bn | £373.30bn | £384.66bn | +£11.36bn | The change in estimated lifetime cost is largely due to: • £4.93bn increase in the NHS SR21 Covid recovery spending. • £3.79bn increase in the Bounce Back Loan Scheme, reflecting updated Expected Credit Losses. • £1.65bn increase in spending on the Vaccine Taskforce. |
| Amount reported spent so far | £334.13bn | £358.37bn | £380.15bn | +£21.78bn | The increase in the amount reported spent is due to various measures, including: • £4.93bn on the NHS SR21 Covid recovery spending. • £4.92bn from the Bounce Back Loan Scheme • £1.65bn on the Vaccine Taskforce. • £1.23bn in Housing Support. • £926m on the Vaccine Deployment Programme. • £760m in support to the Devolved Governments. • £697m on Restart. • £651m through the Recovery Premium. • £588m from the Coronavirus Business Interruption Loan Scheme. • £455m on the Education Recovery package. • £452m on the Recovery Loan Scheme. |
| Volume of loans reported issued/guaranteed | £110.98bn | £92.58bn | £66.17bn | -£26.41bn | The change in loans issued/guaranteed is primarily due to repayments, notably: • £14.79bn reduction in BBLS • £8.50bn reduction in CBILS |
| Number of measures where spend figures are not available | 29 | 12 | 7 | -5 | The number of measures without spend data has decreased to seven. This is generally where spending has been subsumed into business as usual (BAU) programmes so cannot be identified separately. |
Chart 1: Amount spent by department since the previous publication (£bn)[footnote 1]

Chart 2: Amount spent by each department since the previous publication (pink) and total amount spent (red) across all active measures (£bn)
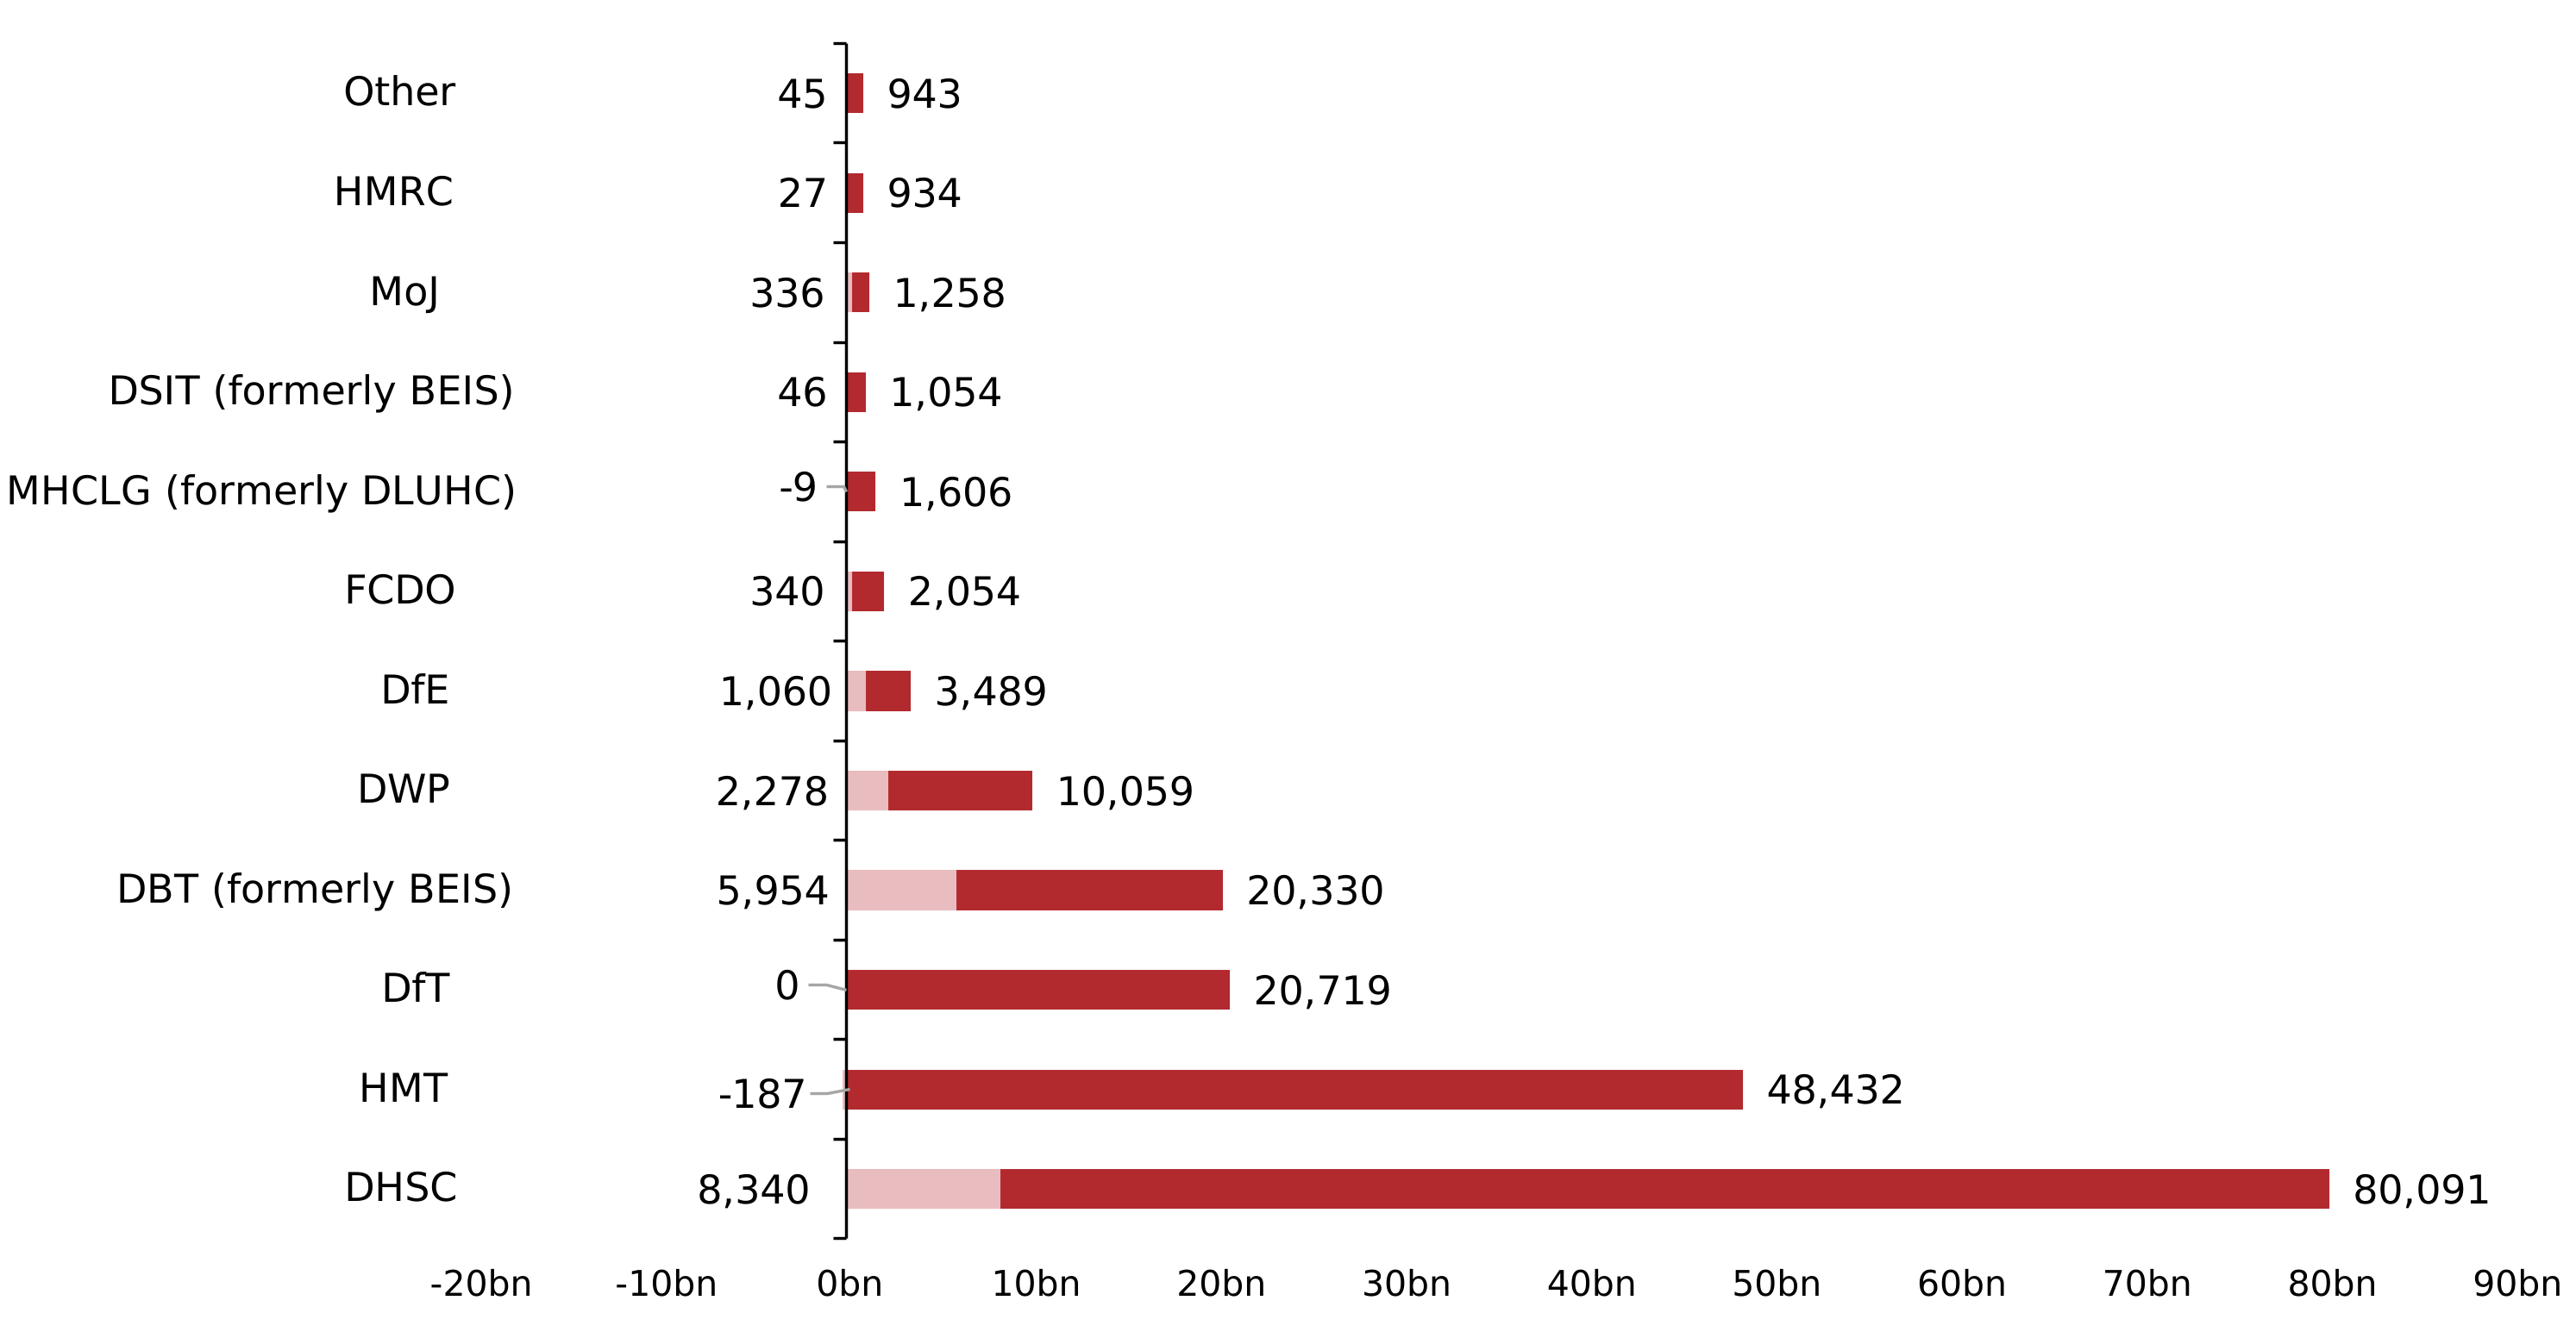
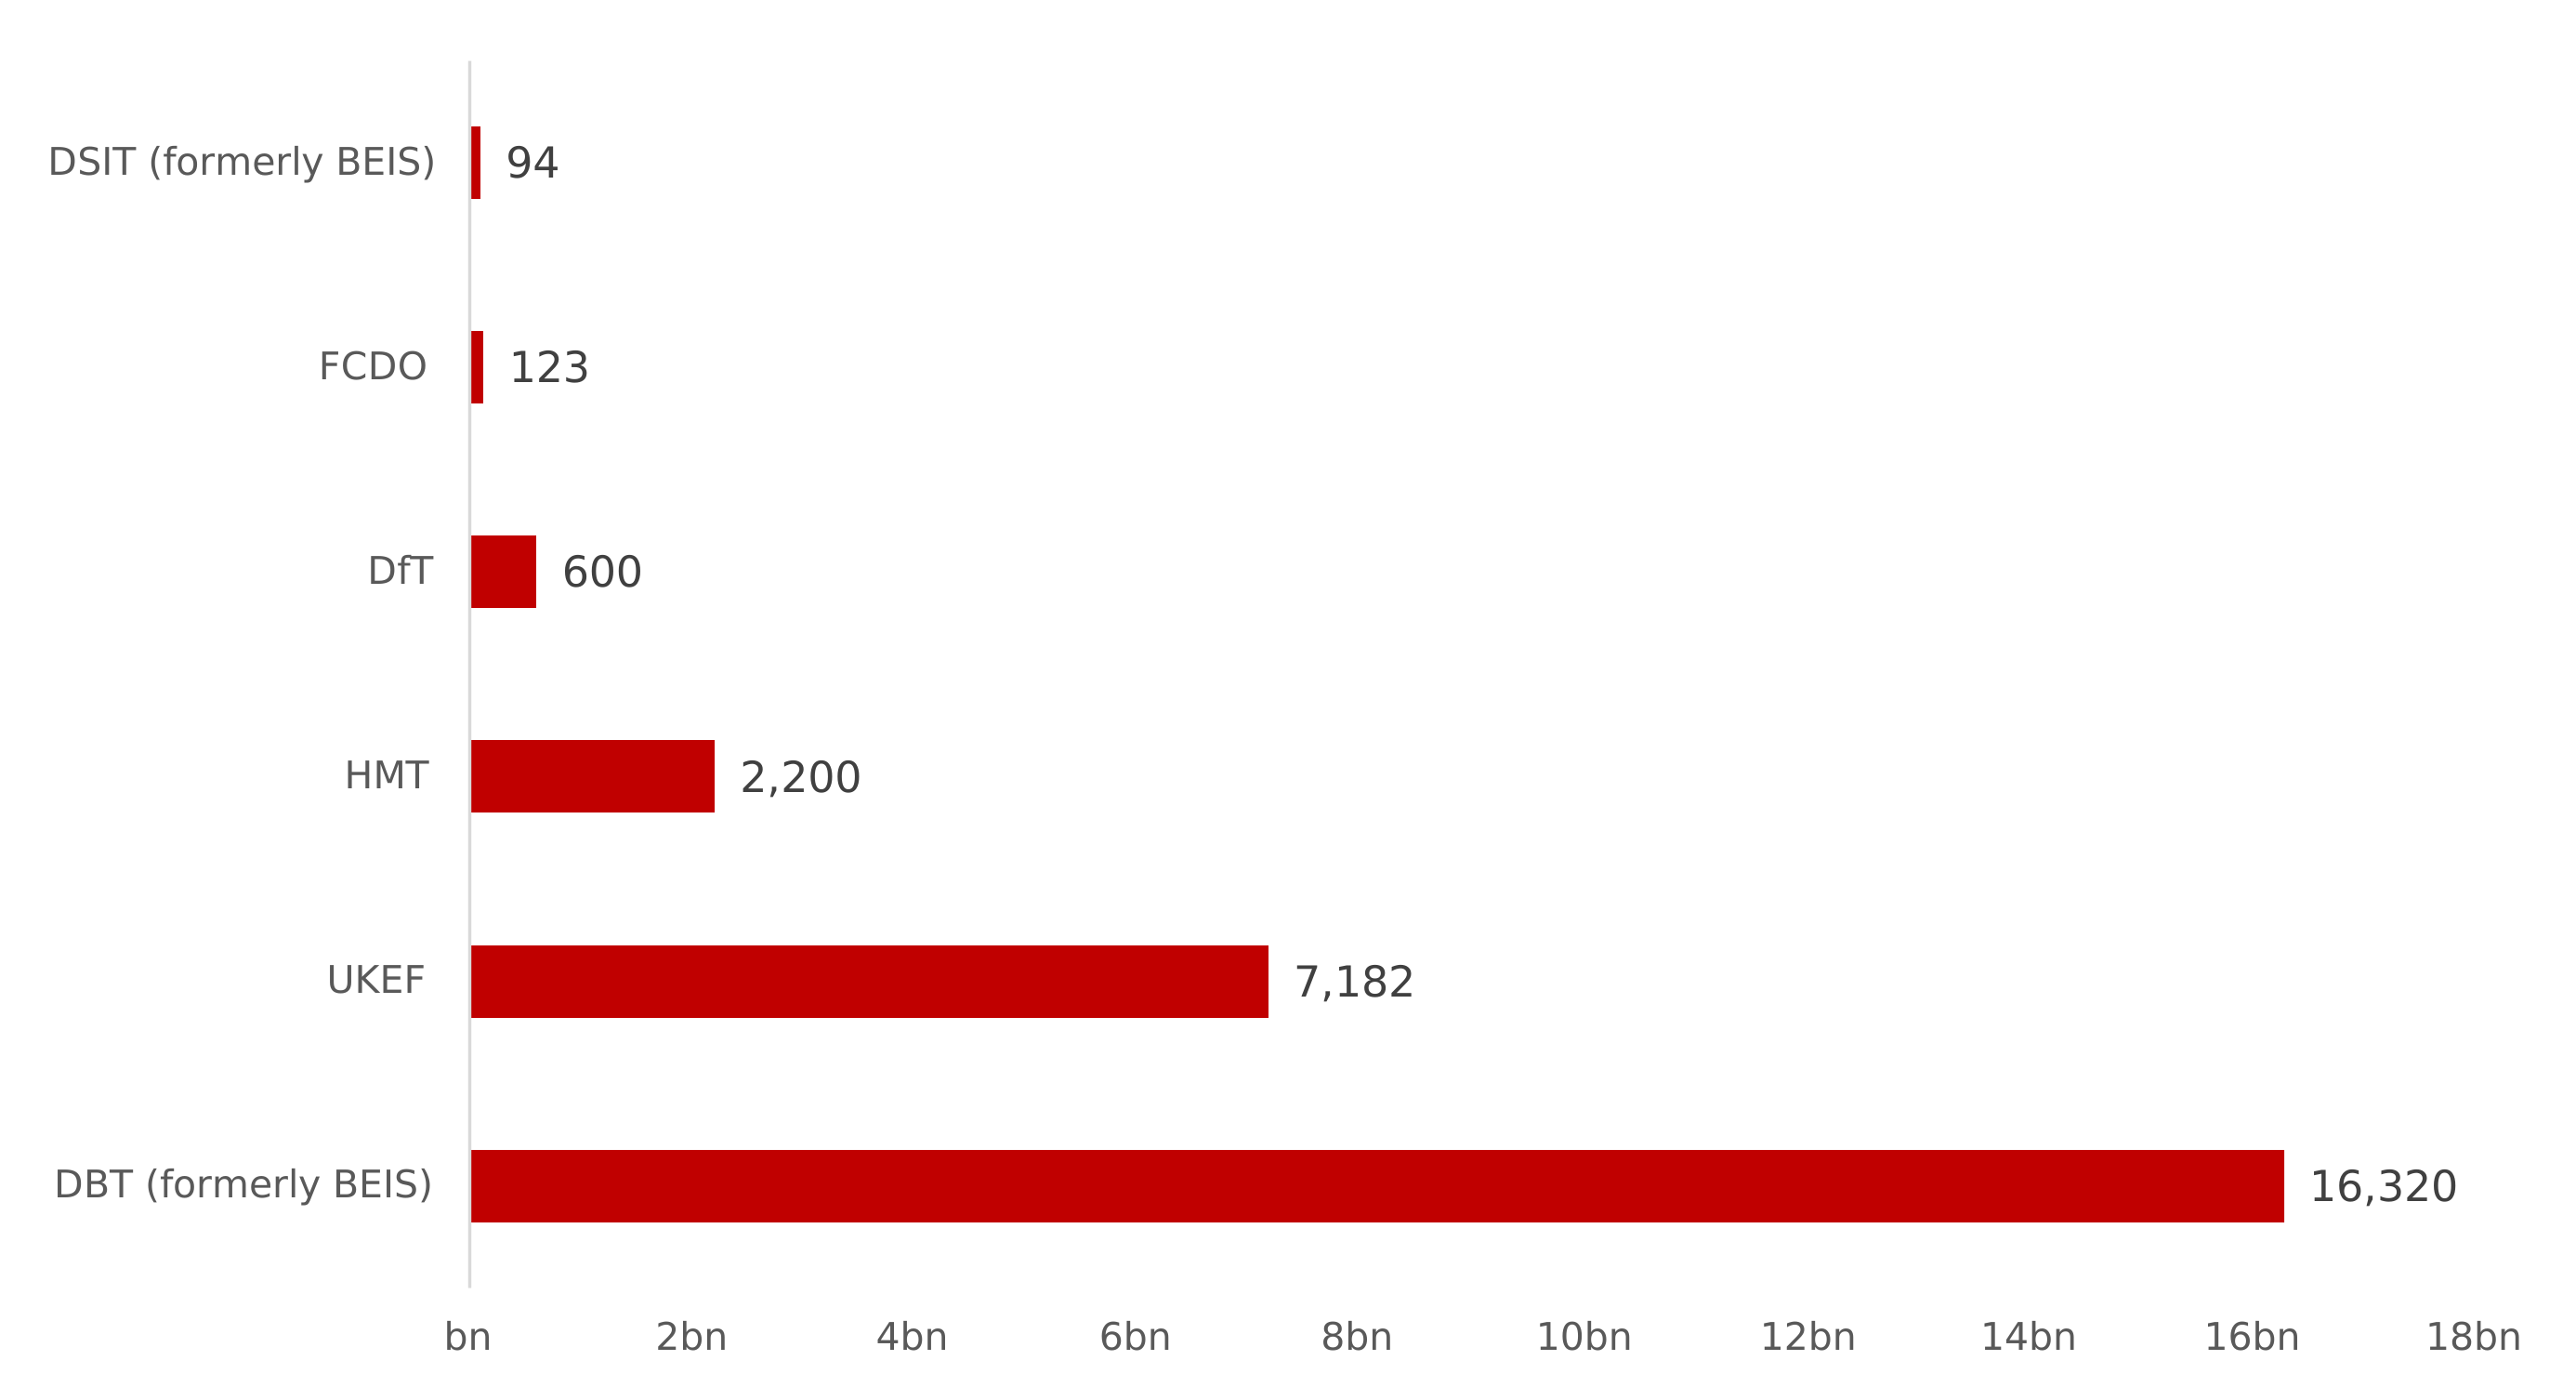
Chart 3: Total loans issued/guaranteed for active loan schemes by department (£bn)
3. Methodology
3.1 Data collection
HM Treasury has worked with relevant government departments to collect this information. All COVID-19 related data included within this publication has been collated based on estimates provided by these departments. HM Treasury has quality assured the data with the help of government departments. Data included within this publication has not been audited by the NAO.
This publication includes updated cost data for all active measures, where provided by the lead department. We have also included measures for which departments have not provided a cost estimate, which is marked with ‘n/a’ in the relevant cells.
We aimed to ensure that the list of measures is as complete as possible. However, not all expenditure will have been identified (see the ‘Limitations’ section for more details).
In some limited instances, we have made presentational changes to the measures - for example, to avoid double counting. This means that measures may not be directly comparable to previous versions of the COVID-19 Cost Tracker published by the NAO.
3.2 Estimated cost data
Estimated costs include the UK government’s allocation of funding to:
- government departments and their associated organisations
- local authorities in England
- the devolved governments in Scotland, Wales and Northern Ireland
They do not include further spending decisions taken by local authorities and the devolved governments.
3.3 Estimated spend data
This data has been provided by government departments and shows the amount spent on each COVID-19 response measure so far, where measures have already been implemented and data are available.
For the purposes of this Cost Tracker, expenditure means that funds have left the department responsible and accountable for them (the lead department).
The funds may have gone to an individual, a private sector organisation or another public sector organisation.
3.4 Gross costs
The Cost Tracker aims to show the estimated gross costs of policy interventions, not the estimated additional cost to the government over and above original budgets. In some cases, interventions will have involved reprioritising existing funding and resources.
3.5 What does the data include?
The data include measures that the government announced from February 2020 as part of its response to the COVID-19 pandemic, including some measures for which departments have not estimated a cost.
The latest estimate of how much each measure is expected to cost and how much has been spent so far has been included, where this information was provided to HM Treasury.
In line with previous versions of the Cost Tracker and where these measures are still ongoing, departments have included the additional costs that they incurred as a result of operating under COVID-19-related restrictions or while delivering COVID-19 policy measures, as well as the costs of government’s COVID-19 policy interventions. The majority of departments now capture these costs within their wider BAU budgets.
Where included, these measures include the following:
- increases in staff numbers, for example new COVID-19 teams, redeploying existing staff to the COVID-19 response or hiring additional call centre staff
- overtime claims or changes to shift working
- increases in staff expenses, such as working-from-home allowances
- IT and home office furniture costs to support staff working from home, or new IT implementation for COVID-19 measures
Where possible, these costs are presented as a single item for a department. As with data on policy interventions, not all departments were able to provide complete and detailed information on their operating costs. In some cases, operating expenditure may also be captured within wider departmental funding packages. Therefore, the data on operational expenditure are not directly comparable across departments.
4. Limitations of the data
4.1 Verifying the data
The data included in this publication has not been audited but HM Treasury has worked closely with departments to ensure that all data provided is accurate.
4.2 Completeness
Not all departments were able to provide us with all the information requested. For example, following the pivot to the previous government’s living with COVID-19 strategy, some departments do not distinguish between COVID-19 spending and business as usual spend, due to the removal of the COVID-19 specific ringfence within budgets. Where possible, departments have provided cost and spend data in line with their Spending Review settlements.
4.3 Data precision
The following caveats apply to this data:
- “Measures” is not a synonym for policies, nor is it a strictly defined classification. Analyses that assume measures have been similarly defined throughout the data should be avoided
- Data are rounded with different levels of precision
4.4 Certainty
Costs and spend on COVID-19 depend on a range of uncertain factors, including the impact of the pandemic on the wider economy.
4.5 Comparisons with government publications
When comparing any data included within this publication, costs may differ from other publications because:
- this tracker includes some measures funded through departments’ own resources
- the tracker excludes funds set aside for the COVID-19 response in the COVID-19 Reserve
- there are timing differences between producing the cost estimates for each publication
4.6 Technicalities
Technicalities such as the Barnett formula are explained where they are known to be included in costs, but may not be identified in all cases.
The estimated costs of government-backed loans and finance schemes represent estimates of write-off costs (for example, if businesses default on loans).
5. Background notes
5.1 Revisions policy
This policy has been developed in accordance with the UK Statistics Authority Code of Practice for Official Statistics and HM Treasury’s revisions policy.
5.2 User engagement
Users are encouraged to provide feedback on how these statistics are used and how well they meet user needs. Comments on any issues relating to this statistical release are welcomed and encouraged. Responses should be addressed to the “Public enquiries” contact given at the beginning of this document
The department’s engagement strategy to meet the needs of statistics users is published here.
-
The reduction in Other largely reflects updated estimates of HM Treasury spending on business rates reliefs. ↩