Farm Business Income by type of farm, England, 2020/21
Updated 20 November 2025
Applies to England

© Crown copyright 2025
This publication is licensed under the terms of the Open Government Licence v3.0 except where otherwise stated. To view this licence, visit nationalarchives.gov.uk/doc/open-government-licence/version/3 or write to the Information Policy Team, The National Archives, Kew, London TW9 4DU, or email: psi@nationalarchives.gov.uk.
Where we have identified any third party copyright information you will need to obtain permission from the copyright holders concerned.
This publication is available at https://www.gov.uk/government/statistics/historic-farm-business-income/farm-business-income-by-type-of-farm-england-202021
Farm Business Income by type of farm, England, 2020/21
Data on farm business incomes are used to monitor and evaluate Government policies and to inform wider research into the economic performance, productivity and competitiveness of the agricultural industry. The data are also widely used by the industry for benchmarking.
This release provides survey results of Farm Business Income for 2020/21 covering the 2020 harvest and including the 2020 Basic Payment (as this contributes to Farm Business Income) and the first year of the Covid-19 pandemic. These results replace the forecast estimates published on 8 April 2021. All figures are for March/February years. A time series showing this and other measures of income can be found on the GOV.UK website.
Key results
- In 2020/21, average Farm Business Income increased across all farm types except general cropping and specialist poultry. It was a far from typical year, the Covid-19 pandemic, challenging weather conditions (the extremely wet winter of 2020 and very dry spring of 2020) and the end of the EU exit transition period were just some of the influencing factors.
- On cereal farms, average income increased by 14 percent to £71,700; firm prices helped to offset lower yields for some crops and higher fixed costs. For general cropping farms income fell by 21 percent to £66,900 with lower input costs insufficient to offset a drop in crop output, the result of reduced yields and areas for crops such as sugar beet and oilseed rape.
- On dairy farms, average income increased by 9 percent to £92,500, with revenue from other cattle enterprises, which rose by 13 percent, a key driver.
- On lowland grazing livestock farms, average income nearly doubled to £18,400 driven by a rise in output from cattle and sheep enterprises which more than compensated for a fall in crop output. For grazing livestock farms in Less Favoured Areas (LFAs) similar drivers resulted in an average income of £33,400, a 46 percent increase compared to 2019/20.
- On specialist pig farms, average income increased to £48,000 with firmer prices at the start of the year helping to offset later prices falls and a rise in costs, particularly for feed. Average incomes on specialist poultry farms fell to £77,700; increases to egg and crop output and higher income from diversified activities were not enough to offset lower output from poultry meat.
- The average Basic Payment across all farm types was £28,400, which was little change compared to 2019.
1 Farm Business Income by farm type
Figure 1.1 Average Farm Business Income (£ per farm) by farm type, with 95% confidence intervals, England 2019/20 and 2020/21
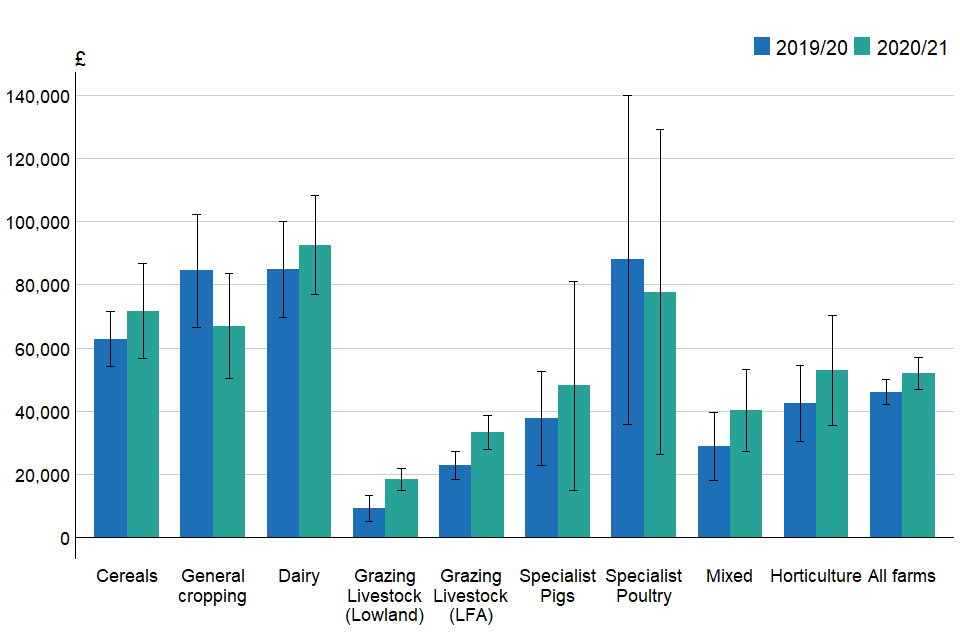
Average Farm Business Income (£ per farm) by farm type, with 95% confidence intervals, England 2019/20 and 2020/21
Table 1.1 Average Farm Business Income per farm at current prices (£/farm)(a)
| Farm Type | 2018/19 | 2019/20 | 2020/21 | % change 2019/20 to 2020/21 |
|---|---|---|---|---|
| Cereals | 67300 | 62800 | 71700 | 14% |
| General cropping | 106400 | 84400 | 66900 | -21% |
| Dairy | 79700 | 84800 | 92500 | 9% |
| Grazing livestock (Lowland) | 12500 | 9400 | 18400 | 97% |
| Grazing livestock (LFA) | 15500 | 22800 | 33400 | 46% |
| Specialist pigs(b) | 29600 | 37700 | 48000 | 27% |
| Specialist poultry(b) | 74700 | 87900 | 77700 | -12% |
| Mixed | 45500 | 28900 | 40200 | 39% |
| Horticulture | 52100 | 42400 | 52900 | 25% |
| All types | 50400 | 46000 | 51900 | 13% |
(a) Rounded to the nearest 100. Years ending at end of February.
(b) The sample sizes for specialist pig and poultry farms are relatively small with average incomes subject to greater variation. Individual farms can also have a large influence on the results, for more details see individual farm type commentaries.
Table 1.2 Average Farm Business Income per farm in real terms(a) at 2020/21 prices (£/farm)(b)
| Farm Type | 2018/19 | 2019/20 | 2020/21 | % change 2019/20 to 2020/21 |
|---|---|---|---|---|
| Cereals | 73500 | 67000 | 71700 | 6% |
| General cropping | 116200 | 90100 | 66900 | -20% |
| Dairy | 87000 | 90500 | 92500 | 2% |
| Grazing livestock (Lowland) | 13600 | 10000 | 18400 | 62% |
| Grazing livestock (LFA) | 17000 | 24300 | 33400 | 54% |
| Specialist pigs(c) | 32300 | 40300 | 48000 | 24% |
| Specialist poultry(c) | 81600 | 93700 | 77700 | -20% |
| Mixed | 49700 | 30800 | 40200 | 19% |
| Horticulture | 56900 | 45200 | 52900 | 14% |
| All types | 55000 | 49000 | 51900 | 5% |
(a) Uses GDP deflator.
(b) Rounded to the nearest 100. Years ending at end of February.
(c) The sample sizes for specialist pig and poultry farms are relatively small with average incomes subject to greater variation. Individual farms can also have a large influence on the results, for more details see individual farm type commentaries.
1.1 Cereal Farms
Figure 1.2 Average Farm Business Income (£ per farm) for cereal farms, England 2011/12 to 2020/21(a).
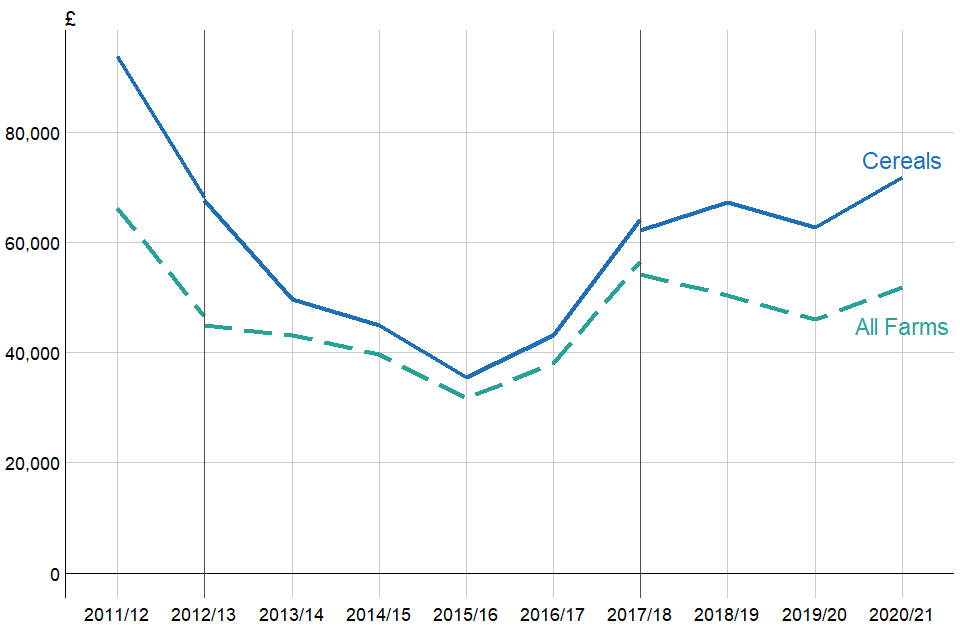
Average Farm Business Income (£ per farm) for cereal farms, England 2011/12 to 2020/21
(a) The breaks in the series shown in 2012/13 and 2017/18 represent changes in the method used to assign farms to a specific farm type. Where breaks occur, average income has been calculated using both methods for comparability.
On cereal farms, average Farm Business Income increased by 14 percent in 2020/21 to £71,700 (Table 1.1 and Figure 1.2 for a comparison to all farms over time). Despite lower yields for many crops, firm prices resulted in higher output for some enterprises, notably spring barley, other cereals, crop by-products, forage and cultivations. These increases more than offset lower output for winter sown crops, which were badly impacted by the extremely wet planting conditions in the autumn and winter of 2019/20. Overall, total crop output was 4 percent higher than 2019/20. Fixed costs increased by 12 percent driven by rises for labour, machinery, general farming costs and rent, while variable costs were largely unchanged. Cereal farms achieved a positive return on their agricultural activities of £2,700 (Figure 3.1) compared to £800 in 2019/20. The Basic Payment rose by 10 percent to £41,800 in 2020/21, reflecting an increase in average farmed area. Although the Covid-19 pandemic impacted diversified output from tourism, which fell by nearly 80 percent, higher revenue from recreation and renting out buildings led to an overall rise of 12 percent in diversified income, which equated to around 30 percent of total Farm Business Income.
1.2 General Cropping Farms
Figure 1.3 Average Farm Business Income (£ per farm) for General Cropping farms, England 2011/12 to 2020/21(a).
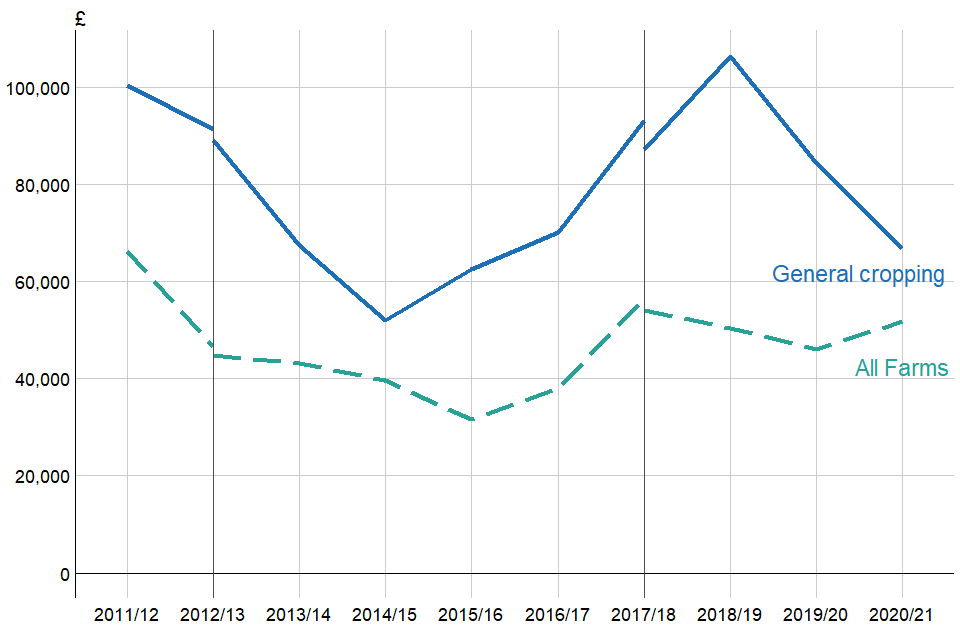
Average Farm Business Income (£ per farm) for General Cropping farms, England 2011/12 to 2020/21
(a) The breaks in the series shown in 2012/13 and 2017/18 represent changes in the method used to assign farms to a specific farm type. Where breaks occur, average income has been calculated using both methods for comparability.
In 2020/21, average income on general cropping farms fell by just over a fifth to £66,900 (Table 1.1 or Figure 1.3 for a comparison to all farms over time) with lower crop output a key driver. Reductions in the average area for potatoes, oilseed rape and sugar beet were compounded by lower yields, the result of the adverse weather conditions and, despite higher prices, crop output fell by 16 percent. Fixed costs were broadly in line with 2019/20 but variable costs fell by 16 percent, notably for crop specific costs (seed, fertiliser, crops protection and other crops costs) which dropped by 12 percent. The decrease in agricultural costs only partially offset the fall in output meaning that, at £1,900, income from agricultural activities was 88 percent lower in 2020/21 compared to 2019/20. Income from agri-environment activities fell by just over a fifth while the average Basic Payment decreased by 3 percent, influenced by a slightly smaller average farm area. Income from diversified activities was 4 percent lower than a year earlier.
1.3 Dairy Farms
Figure 1.4 Average Farm Business Income (£ per farm) for Dairy farms, England 2011/12 to 2020/21(a).
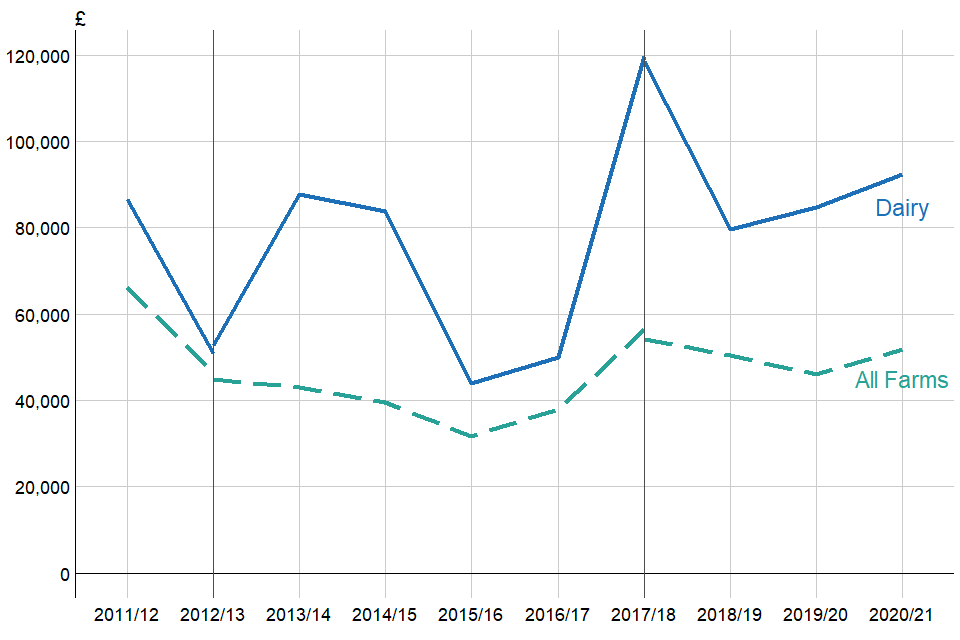
Average Farm Business Income (£ per farm) for Dairy farms, England 2011/12 to 2020/21
(a) The breaks in the series shown in 2012/13 and 2017/18 represent changes in the method used to assign farms to a specific farm type. Where breaks occur, average income has been calculated using both methods for comparability.
On dairy farms the average Farm Business Income increased by 9 percent to £92,500 (Table 1.1 or Figure 1.4 for a comparison to all farms over time). Agricultural output rose by 3 percent largely driven by a 13 percent rise in output from other cattle, reflecting an increase in the closing value for cattle enterprises as prices rose towards the end of the year. Output from milk and milk products increased by 1 percent. The average price of milk (29.6 pence per litre) was largely unchanged on 2019/20 while milk production, although lower than usual during the normal spring peak due to Covid-19 related pressures, was slightly higher overall than the previous year. It is important to note that there is a wide variation in milk prices with some farmers receiving considerably more or less than the average. The rise in output more than offset smaller increases to both fixed and variable costs. Income from diversified activities halved to £3,700, with output from food processing and retailing, building rental and other diversified activities experiencing the largest reductions. Average income from agri-environment activities increased by 31 percent to £5,400. At £30,000 the average Basic Payment was unchanged compared to 2019/20 (Figure 3.1).
1.4 Lowland Grazing Livestock Farms
Figure 1.5 Average Farm Business Income (£ per farm) for Lowland Grazing Livestock farms, England 2011/12 to 2020/21(a).
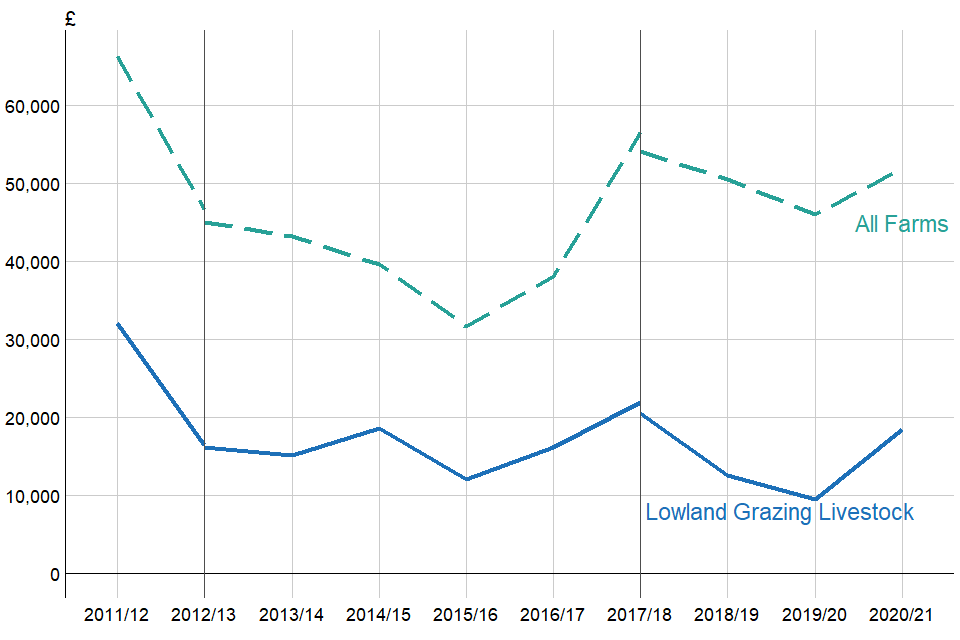
Average Farm Business Income (£ per farm) for Lowland Grazing Livestock farms, England 2011/12 to 2020/21
(a) The breaks in the series shown in 2012/13 and 2017/18 represent changes in the method used to assign farms to a specific farm type. Where breaks occur, average income has been calculated using both methods for comparability.
Average income on lowland grazing livestock farms nearly doubled in 2020/21, albeit from a low base, to £18,400 (Table 1.1 or Figure 1.5 for a comparison to all farms over time). Output from sheep enterprises increased by just over a quarter driven by higher average prices for fat and store lambs across most of the year. Cattle output, a main source of revenue for this farm type, also rose with tight supplies leading to higher average prices for both finished and store cattle. These increases were partially offset by a 17 percent fall in crop output. Overall, agricultural output rose by 10 percent but despite small reductions in both fixed and variable costs (notably for labour and machinery costs) this farm type failed to make a positive return from the agricultural cost centre (Figure 3.1) although loses were more than halved compared to 2019/20. The contribution from the agri-environment activities and Basic Payment cost centres fell slightly compared to 2019/20, while diversification increased by 9 percent.
1.5 LFA Grazing Livestock Farms
Figure 1.6 Average Farm Business Income (£ per farm) for LFA Grazing Livestock farms, England 2011/21 to 2020/21(a).
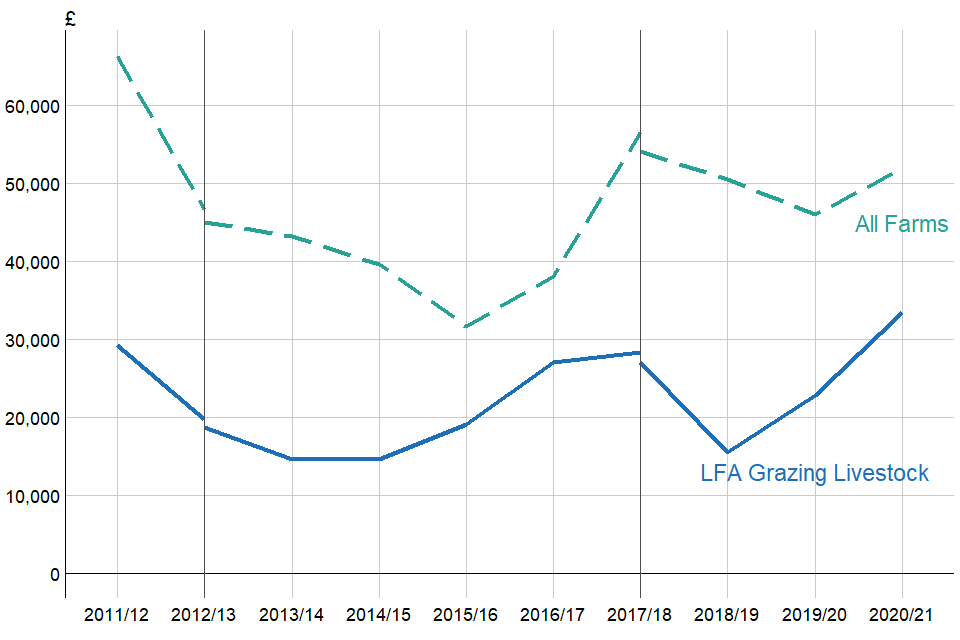
Average Farm Business Income (£ per farm) for LFA Grazing Livestock farms, England 2011/12 to 2020/21
(a) The breaks in the series shown in 2012/13 and 2017/18 represent changes in the method used to assign farms to a specific farm type. Where breaks occur, average income has been calculated using both methods for comparability.
For LFA grazing livestock farms, average Farm Business Income increased by 46 percent in 2020/21 to £33,400 (Table 1.1 or Figure 1.6 for a comparison to all farms over time), primarily due to a rise in livestock output. Both cattle and sheep enterprise output increased by around a fifth with similar drivers to those seen on lowland farms. Prices for ewe and ewe hoggs, an important source of income on these farms, were also higher compared to 2019. In comparison, fixed and variable costs rose by only 3 percent and 1 percent respectively. However, LFA grazing livestock farms failed to make a positive return from agriculture but like lowland farms, their losses were reduced by more than half compared to 2019/20. Income from diversified activities rose by 11 percent, driven by a 6 percent increase in output (food processing and retailing more than doubled) and accounted for 9 percent of total Farm Business Income. Income from the Basic Payment rose by 5 percent. At £10,400, income from agri-environment activities was 8 percent lower than in 2019/20: an important source of income for this type of farms these payments represented just under a third of their average Farm Business Income.
1.6 Mixed Farms
Figure 1.7 Average Farm Business Income (£ per farm) for Mixed farms, England 2011/12 to 2020/21(a).
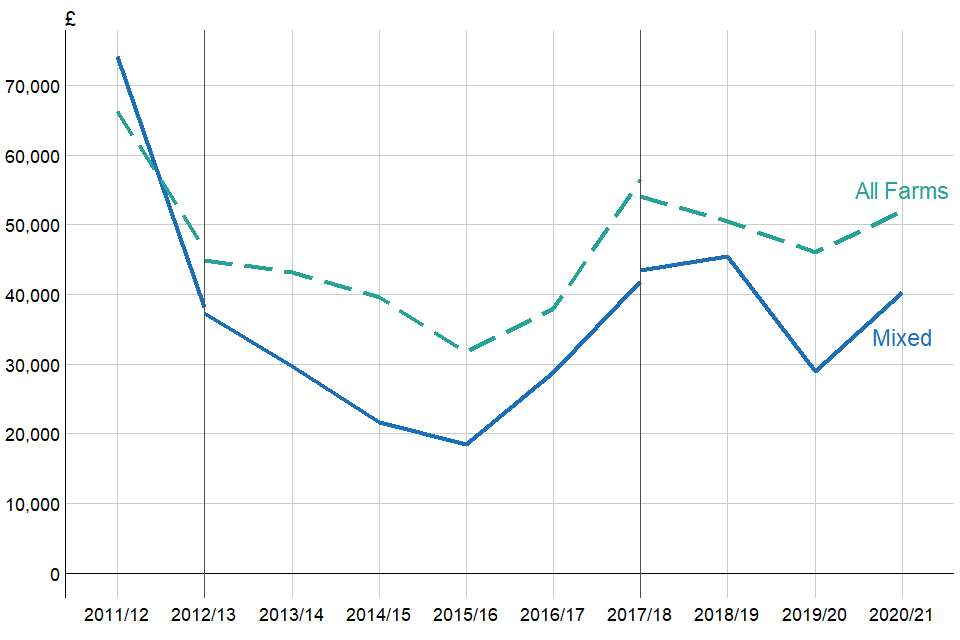
Average Farm Business Income (£ per farm) for Mixed farms, England 2011/12 to 2020/21
(a) The breaks in the series shown in 2012/13 and 2017/18 represent changes in the method used to assign farms to a specific farm type. Where breaks occur, average income has been calculated using both methods for comparability.
On mixed farms average income increased by 39 percent to £40,200 in 2020/21 (Table 1.1 or Figure 1.7 for a comparison to all farms over time). Both fixed and variable agricultural costs were 9 percent lower, with decreases particularly to purchased feed and fodder, crop protection, labour costs and machinery running costs. Agricultural output also fell, but to a lesser degree than costs. A 79 percent decrease in output from broilers and other poultry enterprises along with reductions for winter sown crops were key drivers for the lower output. Whilst there was an increase in Farm Business Income, on average mixed farms failed to generate a positive return on their farming activities in 2020/21, although losses were substantially lower than in 2019/20 (Figure 3.1) which drove the overall increase in average income. The contribution from each of the other cost centres (agri-environment activities, diversification activities and the Basic Payment) all fell slightly when compared to 2019/20.
1.7 Horticulture Farms
Figure 1.8 Average Farm Business Income (£ per farm) for Horticulture farms, England 2011/12 to 2020/21(a).
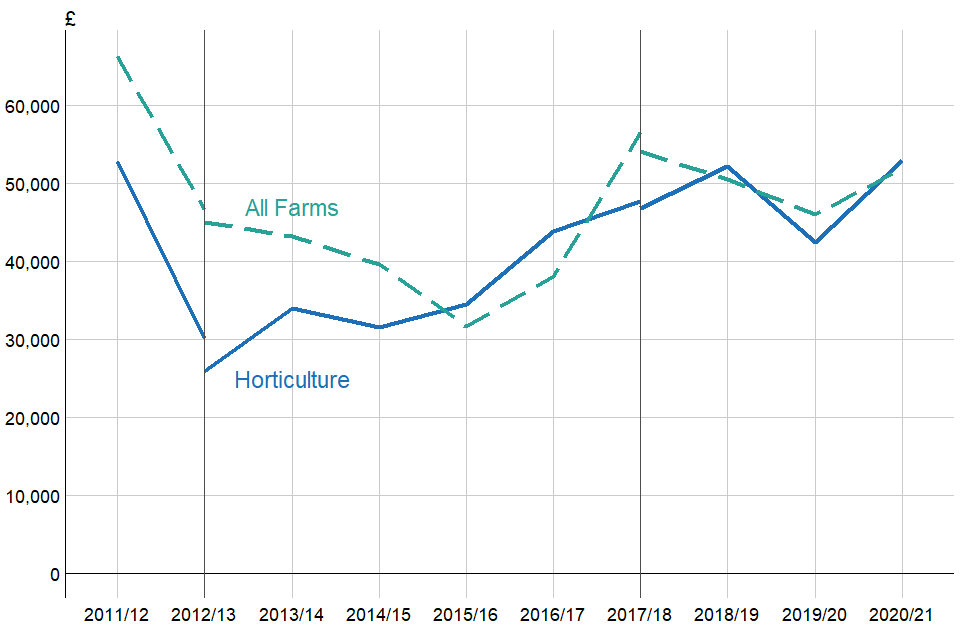
Average Farm Business Income (£ per farm) for Horticulture farms, England 2011/12 to 2020/21
(a) The breaks in the series shown in 2012/13 and 2017/18 represent changes in the method used to assign farms to a specific farm type. Where breaks occur, average income has been calculated using both methods for comparability.
Average income on horticulture farms rose by a quarter in 2020/21 to £52,900 (Table 1.1 or Figure 1.8 for a comparison to all farms over time). A fall in agricultural output of 18 percent, driven by lower output from outdoor vegetables, outdoor flowers and nursery stock, soft and top fruit, was more than offset by a larger decrease in costs. Variable costs fell by 22 percent, notably for casual labour and other crop costs while fixed costs were 19 percent lower with the largest decreases for labour and machinery costs. Income from diversified activities, an important source of revenue for horticulture farms (Figure 3.1), increased by 3 percent although as with agricultural activities, this was due to a fall in output being offset by a larger decrease in costs.
1.8 Specialist Pig Farms
Caution
The FBS sample for both specialist pigs and specialist poultry farms are relatively small, meaning that individual farms can have a large influence on the results.
Figure 1.9 Average Farm Business Income (£ per farm) for Pig farms, England 2011/12 to 2020/21(a).
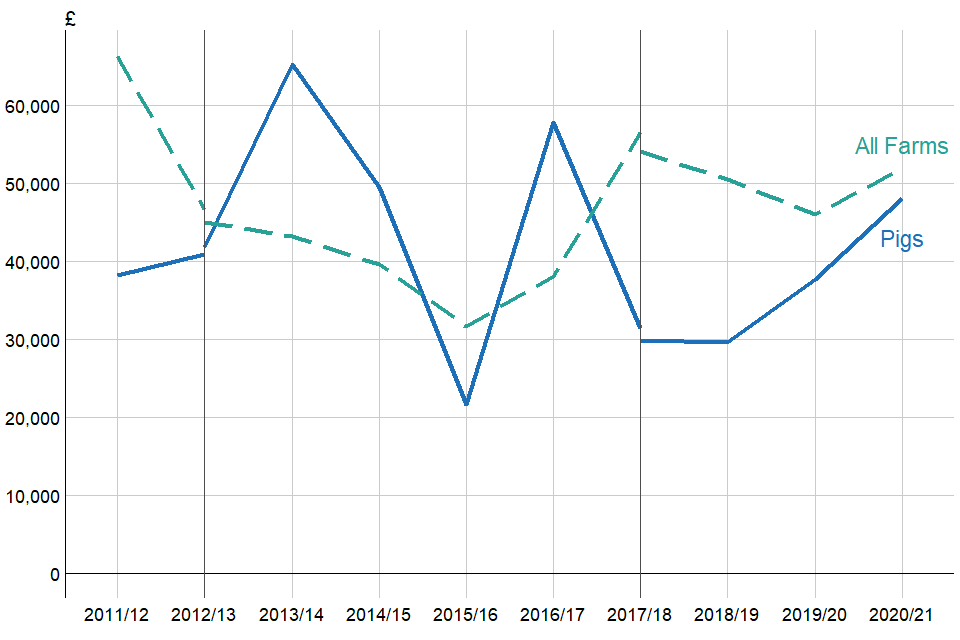
Average Farm Business Income (£ per farm) for Pig farms, England 2011/12 to 2020/21
(a) The breaks in the series shown in 2012/13 and 2017/18 represent changes in the method used to assign farms to a specific farm type. Where breaks occur, average income has been calculated using both methods for comparability.
In 2020/12, average Farm Business Income for specialist pig farms increased by 27 percent to £48,000 (Table 1.1 or Figure 1.9 for a comparison to all farms over time). The key driver for the higher income was a 16 percent increase in output from pig enterprises. Firmer prices at the start of the year helped to offset later price falls, influenced by Covid-19 related challenges and the detection of African Swine Fever in Germany. The increased output more than offset rises to both variable and fixed costs, particularly for purchased feed and fodder, labour and to a lesser extent machinery costs. Overall, there was an average positive return of £25,900 from the agricultural cost centre (Figure 3.1) compared to £15,000 in 2019/20. Income from diversification activities rose, driven by food processing and retailing, while there were decreases to both agri-environment payments and the Basic Payment.
Note that these changes should be treated with caution because of the small sample size and the wide confidence intervals. Contract rearers are also well represented in the FBS sample. Business models for contract rearing operations are varied and these types of farms may not be impacted by price variations to the same extent as non contract rearing farms. In 2020/21, there was also a particularly influential pig farm in the sample. Reweighting this farm so it only represents itself in the results would reduce average Farm Business Income for specialist pig farms to £38,900. For more information on weighting see Section 6.1.
1.9 Specialist Poultry Farms
Caution
The FBS sample for both specialist pigs and specialist poultry farms are relatively small, meaning that individual farms can have a large influence on the results.
Figure 1.10 Average Farm Business Income (£ per farm) for Poultry farms, England 2011/12 to 2020/21(a).
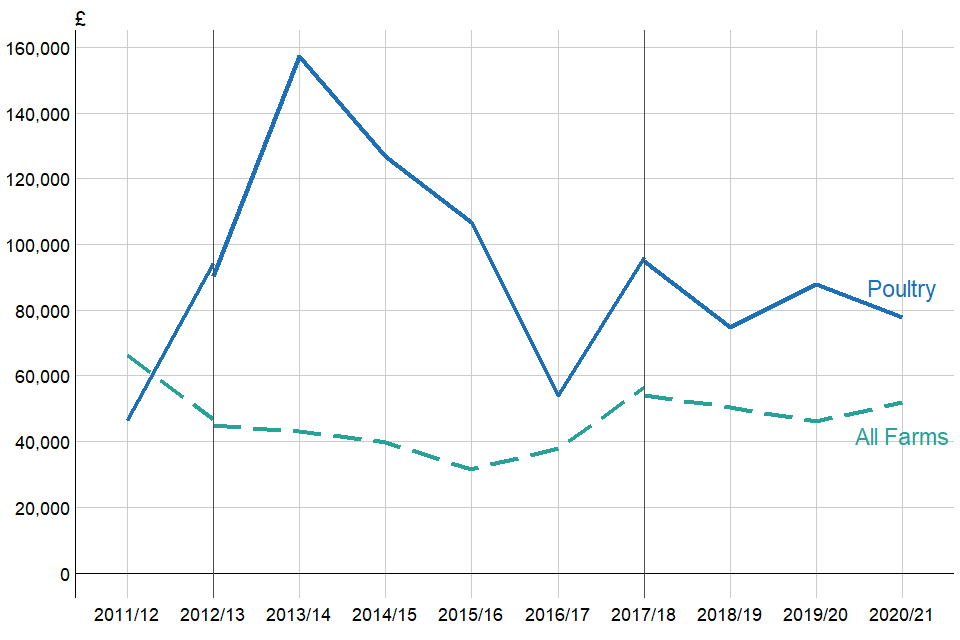
Average Farm Business Income (£ per farm) for Poultry farms, England 2011/12 to 2020/21
(a) The breaks in the series shown in 2012/13 and 2017/18 represent changes in the method used to assign farms to a specific farm type. Where breaks occur, average income has been calculated using both methods for comparability.
For specialist poultry farms average income in 2020/21 was £77,700, a 12 percent fall compared to 2019/20 (Table 1.1 or Figure 1.10 for a comparison to all farms over time). Output from eggs rose by 3% driven by an increase in price following strong retail demand during Covid-19 lockdowns, and a slight increase in quantity. In terms of egg production this is in contrast to UK statistics, which indicate a small decrease in production. Output from birds for poultry meat fell by 7 percent: while prices rose slightly, throughput was lower. Crop output rose by 40 percent buoyed by increases particularly for spring barley, oilseed rape and sugar beet. Combined, these factors meant agricultural output decreased by 2 percent while total agricultural costs were virtually unchanged on 2019/20. Diversified output rose by 6 percent with falls in output from tourism and recreation more than offset by increases to rental income, food processing and retailing.
Note that these changes for specialist poultry farms should be treated with caution because of the small sample size and the range of enterprises covered by this farm type. For example, there are farms producing broilers, turkeys, ducks and geese and for laying flocks the systems cover organic and conventional free range enterprises as well as enriched cages.
2 Distribution of Farm Business Income
Figure 2.1 Distribution of Farm Business Income by farm type(a), England 2020/21.
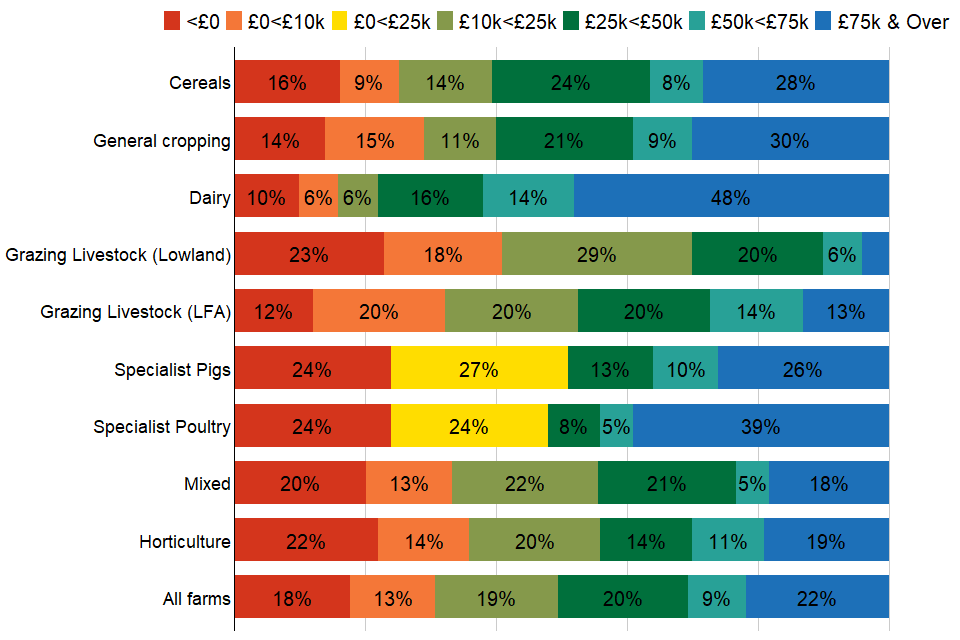
Distribution of Farm Business Income by farm type, 2020/21
(a) The sample sizes for specialist pig and specialist poultry farms are relatively small with average incomes subject to greater variation. Also, due to the sample size, the £0>£10k and £10<£25k size groups have been merged for pig farms and poultry farms
View the data for this chart (1.58 KB)
Download the data for this chart (1.58 KB)
The average values mask the considerable variability in incomes at the farm level, both between and within farm types (Figure 2.1). In 2020/21, at least 10 percent of each farm type failed to make a profit and the figure is much higher for some types, such as specialist pigs, specialist poultry and lowland grazing livestock. For each of these farm types just under a quarter of farms failed to make a profit. At 48 percent of farms, dairy had the largest proportion of farms with an income of more than £75,000, while lowland grazing livestock had the lowest proportion at 4 percent of farms. The variation in incomes within farm type reflects different production costs between farms which are influenced by a number of factors such as size, location, soil type etc.
More detailed analysis of farm incomes based on farm performance is provided in Farm Accounts in England. This will be updated with 2020/21 data in January 2022 and published on the GOV.UK website.
3 Farm Business Income by Cost Centre
Figure 3.1 Cost Centre(a) breakdown for Farm Business Income(b) by farm type(c), 2020/21.
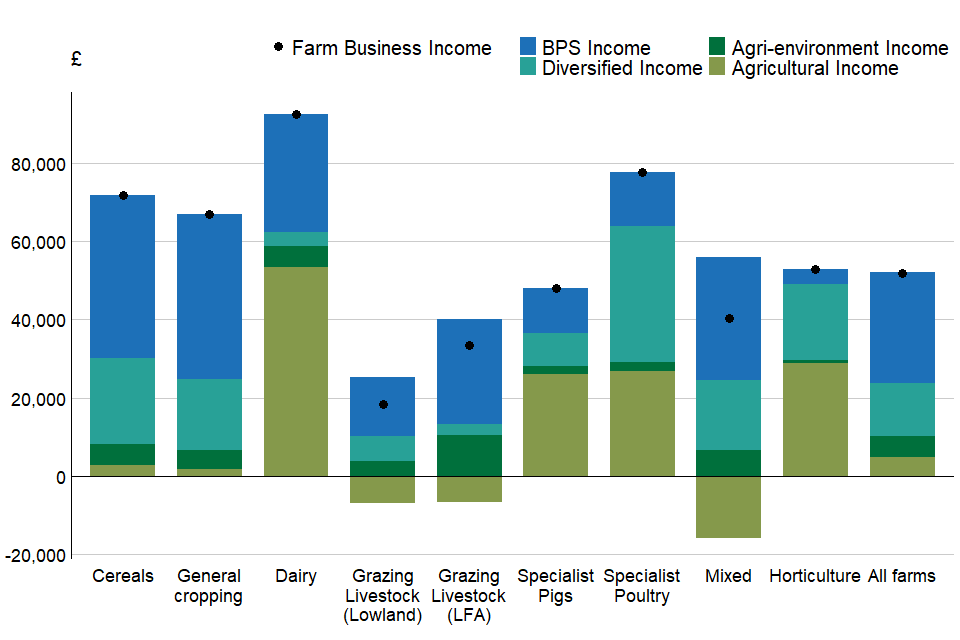
Cost Centre breakdown for Farm Business Income by farm type, England 2020/21
(a) The data shown are the averages across all farms in the sample including those that do not have any income within some of the cost centres. The resulting Farm Business Income is shown by the dot.
(b) Rounded to the nearest hundred.
(c) The sample sizes for specialist pig and poultry farms are relatively small with average incomes subject to greater variation. Individual farms can also have a large influence on the results, for more details see individual farm type commentaries
View the data for this chart (3.2 KB)
Download the data for this chart (3.2 KB)
Farm Business Income can be broken down by cost centre (Figure 3.1) to illustrate the relative contribution to average total Farm Business Income (shown as text at the top of each column). Further information about the methodology adopted for allocating costs across cost centres can be found in Appendix 3 of [Farm Accounts in England](https://(www.gov.uk/government/statistics/farm-accounts-in-england).
In 2020/21, the Basic Payment accounted for more than half of average Farm Business Income on cereal, general cropping, grazing livestock and mixed farms. Across all farm types, the average Basic Payment received was approximately £28,400, this was little change on the previous year.
On average, all farm types generated a positive return on their farming activities in 2020/21 excepting grazing livestock and mixed farms.
4 Revisions
Forecasts of Farm Business Income for 2020/21 were published in April 2021. These forecasts were based on information available in February/March 2021 for prices, animal populations, marketings, crop areas, yields and input costs and were intended as a broad indication of how incomes for each farm type were expected to move compared with 2019/20.
The outturns published here are based on actual survey results from the Farm Business Survey 2020/21. For general cropping, grazing livestock LFA, grazing livestock lowland and mixed farms the forecasts were within the confidence intervals of the survey outturns.
The average income for cereal farms was higher than predicted, largely due to an under estimation of crop output, particularly from barley and other cereals. For dairy farms income was also higher than forecast, the result of an under estimation of the value of output from cattle. On specialist pig farms average income was higher than expected due to a substantial under estimation of output from pig enterprises. Average income on specialist poultry farms was lower than predicted; crop output was higher than forecast while enterprise output from poultry was over estimated.
Table 4.1 Revisions to average Farm Business Income per farm (£/farm)(a) by Type of Farm in England from forecast at current prices.
| Farm Type | Forecast: April 2021 | Outturn: November 2021 (a) | 95% Confidence Limits (+/-) (a) | Change |
|---|---|---|---|---|
| Cereals | 36000 | 71700 | 15000 | 35700 |
| General cropping | 55000 | 66900 | 16600 | 11900 |
| Dairy | 76000 | 92500 | 15700 | 16500 |
| Grazing livestock (Lowland) | 17000 | 18400 | 3500 | 1400 |
| Grazing livestock (LFA) | 32000 | 33400 | 5400 | 1400 |
| Specialist pigs(b) | 5000 | 48000 | 33000 | 43000 |
| Specialist poultry(b) | 130000 | 77700 | 51400 | -52300 |
| Mixed | 31000 | 40200 | 13000 | 9200 |
(a) Rounded to the nearest hundred.
(b) The sample sizes for specialist pig and poultry farms are relatively small with average incomes subject to greater variation.
5 What you need to know about this release
5.1 Availability of results
All Defra statistical notices can be viewed on the Gov.UK site at:
www.gov.uk/government/organisations/department-for-environment-food-rural-affairs/about/statistics
Results from the Farm Business Survey including time series in spreadsheet format can be found at:
www.gov.uk/government/collections/farm-business-survey
An additional statistical notice presenting data from the 2020/21 Farm Business Survey relating to Covid-19 schemes and funding is planned for late December 2021.
5.2 Contact details
Responsible statistician: Alison Wray
Public enquiries: fbs.queries@defra.gov.uk
Room 201
Foss House
1-2 Peasholme Green
York
YO1 7PX
5.3 National Statistics Status
National Statistics status means that our statistics meet the highest standards of trustworthiness, quality and public value, and it is our responsibility to maintain compliance with these standards.
These statistics last underwent a full assessment Assessment Report 271 Statistics on Agriculture against the Code of Practice for Statistics in 2014. Since the last review by the Office for Statistics Regulation, we have continued to comply with the Code of Practice for Statistics across the FBS.
For general enquiries about National Statistics, contact the National Statistics Public Enquiry Service:
Tel: 0845 601 3034
Email: info@statistics.gov.uk
You can find National Statistics on the internet on the Gov.uk website.
As part of our ongoing commitment to compliance with the Code of Practice for Official Statistics we wish to strengthen our engagement with users of these statistics and better understand the use made of them and the types of decisions that they inform. Consequently, we invite users to make contact to advise us of the use they do, or might, make of these statistics, and what their wishes are in terms of engagement. Feedback on this statistical release and enquiries about these statistics are also welcome.
6 Technical note
6.1 Survey coverage and weighting
The Farm Business Survey (FBS) is an annual survey providing information on the financial position and physical and economic performance of commercial farm businesses in England. It covers all types of farming in all regions of the country and includes owner-occupied, tenanted and mixed tenure farms. The FBS only includes farm businesses with a Standard Output of at least €25,000, based on activity recorded in the previous June Survey of Agriculture and Horticulture. In 2020, this accounted for approximately 56,048 farm businesses. In 2016 the sample was reduced from 1800 to 1750 farm businesses. In 2019/20 and 2020/21 the samples were slightly smaller as a result of Covid-19 restrictions on data collection. Data are collected by face to face interviews with farmers, conducted by highly trained researchers.
Each record is given a weight to make the sample representative of the population. Initial weights are applied to the FBS records based on the inverse sampling fraction. These weights are then adjusted by calibrating certain totals to match published totals from other surveys so that they can be used to produce unbiased estimators of a number of different target variables. More detailed information about the Farm Business Survey, the data collected and information on calibration weighting can be found at:
www.gov.uk/farm-business-survey-technical-notes-and-guidance.
6.2 Farm type classification
From 2018/19, the classification of farms is based on 2013 standard output coefficients. 2017/18 results have been recalculated and presented in this release to allow comparability between 2017/18 and 2018/19. The results published here are therefore not directly comparable with those published in earlier years which are based on previous standard output coefficients.
6.3 Farm Business Income
For non-corporate businesses, Farm Business Income represents the financial return to all unpaid labour (farmers and spouses, non-principal partners and their spouses and family workers) and on all their capital invested in the farm business, including land and buildings. For corporate businesses it represents the financial return on the shareholders capital invested in the farm business.
In essence Farm Business Income is the same as Net Profit, which as a standard financial accounting measure of income is used widely within and outside agriculture. Using the term Farm Business Income rather than Net Profit, gives an indication of the measure’s farm management accounting rather than financial accounting origins, accurately describes its composition and is intuitively recognisable to users as a measure of farm income.
6.4 Accuracy and reliability of the results
In common with other statistical surveys, the published estimates of income from the Farm Business Survey are subject to sampling error, as we are not measuring the whole population.
We show error bars based on 95% confidence intervals for mean Farm Business Income as a measure of uncertainty that may apply to the estimated means. These signify that we are 95% confident that this range contains the true value. They are calculated as the standard errors multiplied by 1.96 to give the 95% confidence interval.
- The smaller range of possible values that could apply to grazing livestock, dairy, cereal and mixed farm types reflects relatively large sample sizes and the relative homogeneity of these sectors in terms of the range of income levels across the farms in each of these types.
- The range of values that could apply to general cropping and horticulture farm types reflect a more diverse range of agricultural activities, e.g. general cropping is made up of arable crop and field scale vegetable producers, while horticulture includes specialist fruit producers, hardy nursery stock and fruit and vegetables grown in glasshouses. As a result these sectors are less homogeneous in terms of income levels.
- Confidence limits for specialist pig and poultry farms are affected by the relatively small samples and a huge range in scale of production.
For the Farm Business Survey, the confidence limits shown are appropriate for comparing groups within the same year only; they should not be used for comparing with previous years since they do not allow for the fact that many of the same farms will have contributed to the Farm Business Survey in both years.
Standard errors (and therefore confidence intervals) only give an indication of the sampling error. They do not reflect any other sources of survey errors, such as non-response bias.