Fraud and error in the benefit system for financial year ending 2021
Published 13 May 2021
Applies to England, Scotland and Wales

© Crown copyright 2021
This publication is licensed under the terms of the Open Government Licence v3.0 except where otherwise stated. To view this licence, visit nationalarchives.gov.uk/doc/open-government-licence/version/3 or write to the Information Policy Team, The National Archives, Kew, London TW9 4DU, or email: psi@nationalarchives.gov.uk.
Where we have identified any third party copyright information you will need to obtain permission from the copyright holders concerned.
This publication is available at https://www.gov.uk/government/statistics/fraud-and-error-in-the-benefit-system-financial-year-2020-to-2021-estimates/fraud-and-error-in-the-benefit-system-for-financial-year-ending-2021
1. Introduction
The Department for Work and Pensions (DWP) pays welfare benefits to around 23 million people. ‘Fraud and Error in the Benefit System’ estimates how much money the department incorrectly pays, either by paying people too much benefit – overpayments – or by not paying enough benefit – underpayments. We calculate this as a percentage of the total amount of benefit we pay – expenditure.
Overpayments and underpayments happen as a consequence of fraud, claimant error and official error (processing errors or delays by DWP, a Local Authority, or Her Majesty’s Revenue and Customs (HMRC)).
Universal Credit (UC) and State Pension (SP) are the only benefits with fraud and error reviews carried out in Financial Year Ending (FYE) 2021. UC estimates relate to reviews carried out from July to November 2020 and SP estimates relate to reviews carried out from October 2019 to September 2020 (with a break May to July 2020). The rates found are then applied to the expenditure for FYE 2021 to estimate the monetary amount of fraud and error. The benefit expenditure figures used are consistent with Spring Budget 2021 and the reviews and expenditure cover a period impacted by the coronavirus (COVID-19) pandemic.
When comparing UC and SP estimates to previous estimates, users should be aware that the FYE 2021 estimates are impacted by the coronavirus pandemic whereas previous estimates are not.
2. Main stories
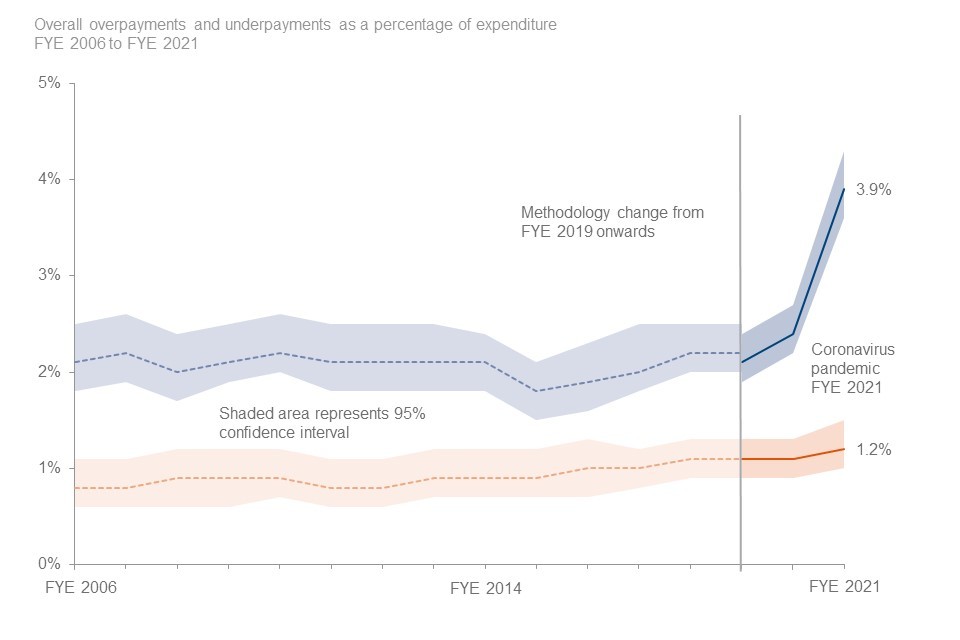
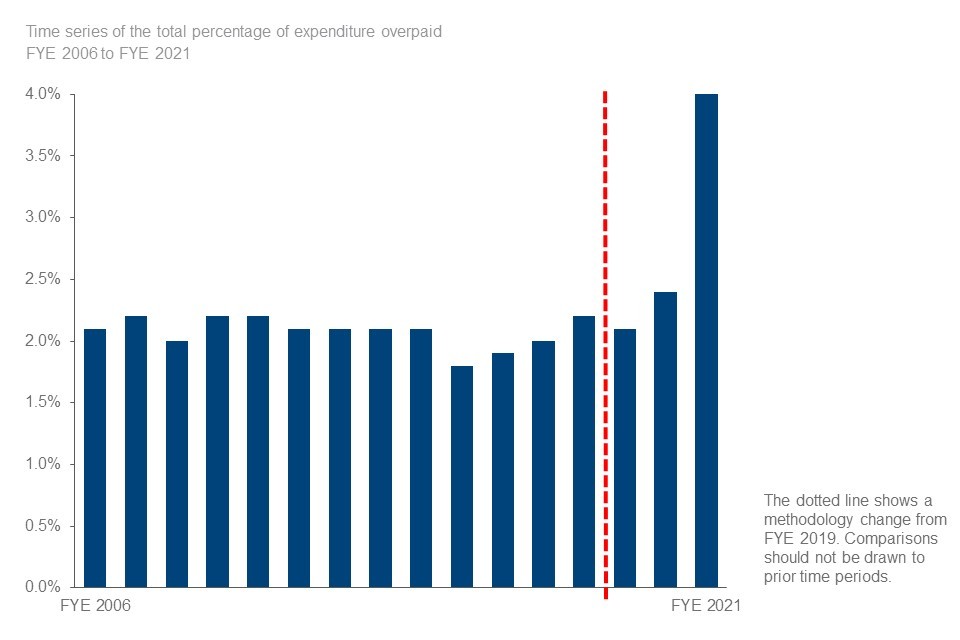
3.9% of benefit expenditure was overpaid in FYE 2021 - the highest overpayment rate to date:
- This amounted to £8.4bn of overpayments
- The overpayment rate has increased from the FYE 2020 rate of 2.4%
1.2% of benefit expenditure was underpaid in FYE 2021 – the highest underpayment rate to date:
- This amounted to £2.5bn of underpayments
- The underpayment rate has increased from the FYE 2020 rate of 1.1%
The overpayment rate has risen because:
- UC has the highest rate of overpayments of all benefits and has risen to its highest overpayment rate to date
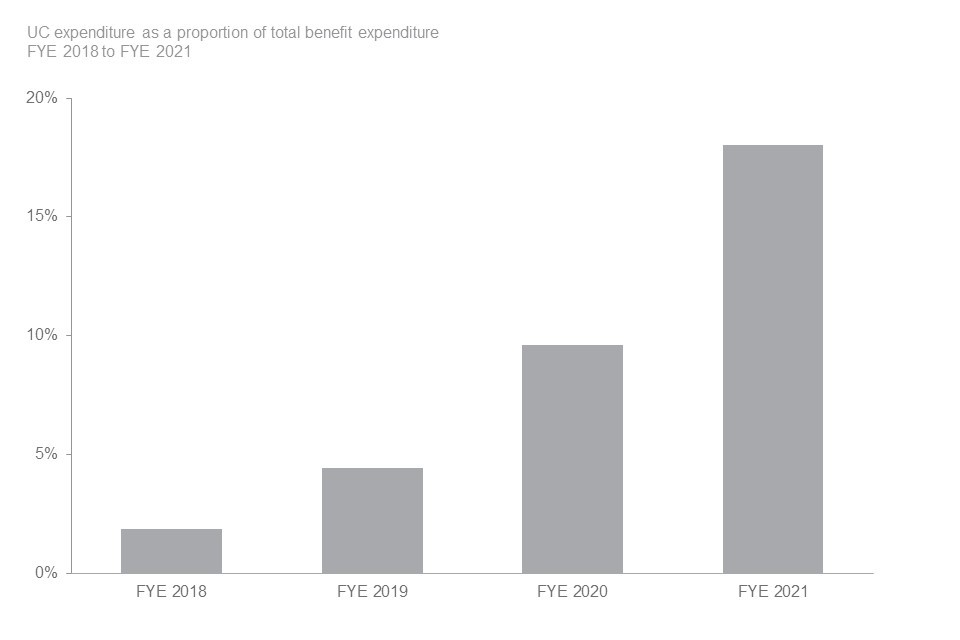
- The expenditure on UC more than doubled in FYE 2021 and accounts for 18% of all benefit expenditure
- The coronavirus pandemic had an impact on both the UC expenditure and overpayments increases this year
The proportion of total benefit expenditure that relates to UC has almost doubled.
3. What you need to know
About this document
This document contains estimates of the level of fraud and error in the benefit system. The main measure we use is the percentage of benefit expenditure that is overpaid or underpaid. We also show this as an amount in pounds. The amount in pounds could go up, even if the percentage stays the same, if the amount of benefit we pay out in total goes up. The amounts in pounds are not adjusted for inflation. When comparing over time, we recommend comparing percentage rates rather than monetary amounts for these reasons.
We measure fraud and error so we can understand the levels, trends and reasons behind it. This understanding supports decision making on what actions DWP can take to reduce the level of fraud and error in the benefit system. The National Audit Office takes account of the amount of fraud and error when they audit DWP’s accounts each year.
These estimates relate to the levels of fraud and error in the benefit system in Great Britain. They are underpinned by reviews of benefit claimants in England, Wales and Scotland. The benefit expenditure figures used in this publication also include people resident overseas who are receiving United Kingdom benefits, except for Over 75 TV Licences and Financial Assistance Scheme payments which also cover Northern Ireland. All other benefit expenditure on residents of Northern Ireland is the responsibility of the Northern Ireland Executive. The benefit expenditure figures do not include amounts devolved to Scottish Government (which totalled £3.2 billion in FYE 2021).
Published tables and data
The figures in this document are a selection from the Reference tables accompanying this release. The tables contain further breakdowns of the results presented in this report by different characteristics, with time series data back to FYE 2006 for some benefits.
How we measure fraud and error
We take a sample of benefit claims from our administrative systems (we sampled around 4,000 for FYE 2021, equating to 0.02% of benefit claimants). DWP’s Performance Measurement team look at the data we hold on the systems and then contact claimants to arrange a review. In previous years we have carried out reviews by both visit and phone, however due to the coronavirus pandemic all reviews this year have been by phone. This is our normal method of review for UC. As part of the review we ask claimants to provide evidence such as identity, bank account details and other information that could affect their benefit claim (for example, childcare costs). We assess if the claim is correct or not. If the claim is not correct, we look at the amount of money the claim is wrong by and classify it as one of the following:
- Fraud
- Claimant Error
- Official Error
Read more about the definitions of Fraud, Claimant Error and Official Error.
Fraud and error – rates and monetary values
For benefits measure this year, the monetary value of fraud and error is calculated using the percentage of fraud and error found in our sample:
(Percentage of fraud and error) x (Benefit expenditure)
Even if the rate of fraud and error is decreasing, if the benefit expenditure is increasing, we could see a higher monetary value; and vice versa.
For example: The rate of Official Error overpayments on Universal Credit decreased from 1.3% to 0.9% between FYE 2020 and FYE 2021, but expenditure increased from £18.4bn to £38.2bn, which meant that the monetary value increased between the two years, from £250m to £330m.
This is why it is usually better to compare rates of overpayments and underpayments, rather than monetary values, and why statistically significant changes to monetary values are not highlighted.
Methodology changes since the FYE 2020 publication
A small number of methodology changes have been made to this year’s estimates of fraud and error in the benefit system:
1. Categorisation
This year we have made a change to how we attribute the amount overpaid or underpaid to error reasons. This change has no effect on the amount overpaid or underpaid at a total level or an error type level (i.e. Fraud, Official Error, Claimant Error). We have introduced a new error reason category “Failure to provide evidence/fully engage in the process”. This is applied to cases where the claimant did not fully engage in the process and where we are unsure as to the reason why. These cases had given up their benefit entitlement rather than engage in the benefit review process, therefore we make the assumption that the claim was fraudulent.
2. State Pension Changes
We have made some small changes to the measurement of SP. The impact of these is minimal.
Further details on these changes and their impact on the statistics are available in the Background Information and Methodology note.
Cannot Review adjustment
A number of cases are removed from the headline overpayment estimates for UC. This is due to reviews not being completed and subsequently categorised as ‘Inconclusive’. These cases are estimated to have a monetary value of £320m in total. See Appendix 4 for full details.
State Pension impact on total overpayments and underpayments
SP is – and has always been – the benefit with the highest expenditure, accounting for around half of total benefit expenditure in FYE 2021 (£101.2bn). SP has a very low rate of both overpayments and underpayments – in part because it is not a means-tested benefit. Due to both the large expenditure and the low rates of fraud and error, SP has a strong influence on the overall reported fraud and error rates.
Coronavirus pandemic impacts
Our estimates are normally based on around 15,000 reviews of a random sample of claimants on certain benefits. The benefit reviews, which underpin the annual fraud and error estimates for FYE 2021, were stopped in March 2020, due to the visiting restrictions imposed as a result of the coronavirus pandemic, the inability of claimants to provide evidence due to lockdown restrictions, and changes to the process of suspension of benefit (which is a key compliance tool when carrying out benefit reviews). As a result, for FYE 2021 we only measured Universal Credit and State Pension due to coronavirus restrictions.
A number of operational easements and changes to benefit administration were introduced as a consequence of the pandemic. This was to protect vulnerable customers and ensure benefit claim processing was as timely as possible. We refer to verification easements as Trust and Protect. For benefits that we have been unable to review this year, we have considered and analysed the impact of these easements and changes.
More information on this can be found in Appendix 3.
For benefits we have not reviewed, we use historical rates or proxy measures. For more information see Appendix 2 of the Background Information and Methodology note.
Statistical significance and confidence intervals
These estimates are based on a sample of benefit claims receiving a monetary payment. Choosing a different sample might give us a different estimate. The figure we quote is the central estimate. We also show a range around the central estimate, called a Confidence Interval. A simplified view of this is that we are 95% sure that the true value lies within this interval (for a more detailed explanation, see section 6 of our Background Information and Methodology note).
Statistical significance is an expression that says whether an estimated value is likely to have arisen only from variations in the sampling. It is most often used when talking about a change or a difference: a significant change or difference is one that is not likely to be due only to the sampling, and is therefore likely to be a real change or difference. In this publication we note when changes since the previous year are statistically significant.
Definitions of fraud, claimant error and official error
In this publication we classify incorrect claims as follows.
Fraud
Cases where all three of the following conditions apply:
- the conditions for receipt of benefit, or the rate of benefit in payment, are not being met
- the claimant can reasonably be expected to be aware of the effect on entitlement
- benefit stops or reduces as a result of the review
Claimant Error
The claimant has provided inaccurate or incomplete information, or failed to report a change in their circumstances, but there is no evidence of fraudulent intent on the claimant’s part.
Official Error
Benefit has been paid incorrectly due to a failure to act, a delay or a mistaken assessment by the DWP, a Local Authority or Her Majesty’s Revenue and Customs to which no one outside of that department has materially contributed, regardless of whether the business unit has processed the information.
4. Total estimates of fraud and error across all benefit expenditure
The total overpayment rate in FYE 2021 was 3.9% and the total underpayment rate was 1.2%. Both are the highest reported rates to date. The total overpayment and underpayment rates are estimates of fraud and error across all benefit expenditure.
Overpayments
The total rate of overpayments has risen due to an increase in the rate of overpayments on UC, and due to an increase in expenditure on UC (which has more than doubled since FYE 2020).
Within the total overpayment rate, the increase was driven by a statistically significant increase in the Fraud overpayment rate, from 1.4% in FYE 2020 to 3.0% in FYE 2021
The estimate of the monetary value of total overpayments increased to £8.4bn, from £4.6bn in FYE 2020.
Benefit expenditure increased by £20.0bn, from £191.7bn to £211.7bn. This rise in expenditure accounted for £1.8bn of the £3.8bn rise in the total monetary value of overpayments.
Just over half of the overall increase was due to the statistically significant increase in the UC overpayment rate, from 9.4% to 14.5%. Even if the overpayment rate for UC had remained at the same level as in FYE 2020, the overall overpayment rate across all benefits would still have risen to a level higher than ever reported (3.0%), due to the expenditure on UC more than doubling in the last year.
Within total overpayments, the increase was driven by a statistically significant increase in Fraud overpayments, from 1.4% in FYE 2020 to 3.0% in FYE 2021
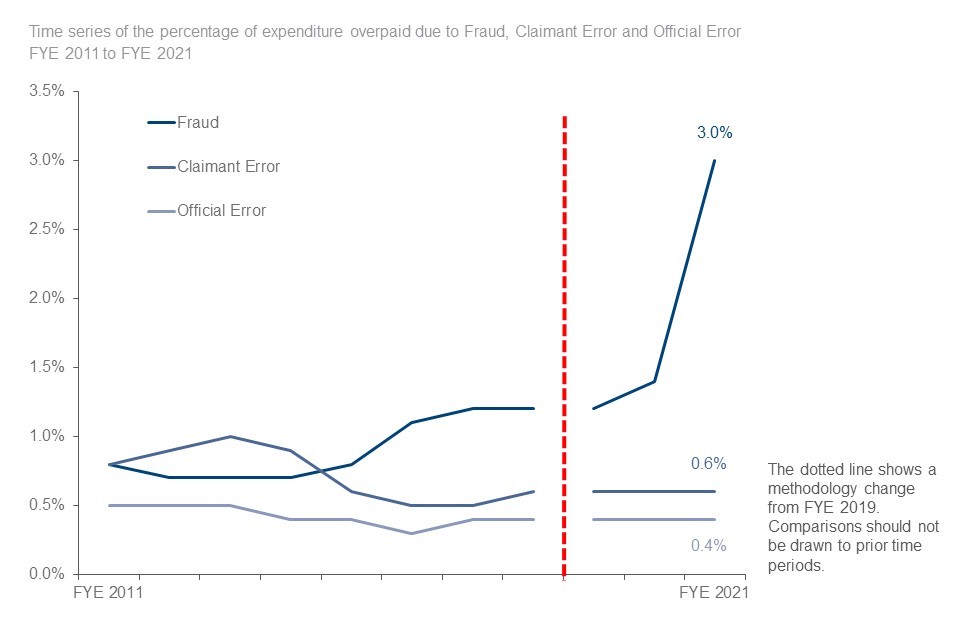
The rate of Fraud overpayments was 3.0%, an increase from 1.4% in FYE 2020, and the monetary value of Fraud overpayments increased from £2.8bn to £6.3bn. The rise was primarily due to an increase in Fraud overpayments on UC.
Total Official Error and Claimant Error overpayment rates were the same as in FYE 2020, at 0.4% and 0.6% respectively.
Underpayments
The estimate of the total rate of underpayments in FYE 2021 was 1.2%, a small increase from 1.1% in FYE 2020.
This increase was not statistically significant. The total monetary value of underpayments increased to £2.5bn, from £2.0bn in FYE 2020. The rise in expenditure accounted for £0.2bn of the rise in the total monetary value of underpayments.
Increases in underpayments on both UC and SP contributed to the increase in the total rate of underpayments.
Official Error and Claimant Error underpayment rates have remained at 0.4% and 0.7% respectively.
Net loss from overpayments
DWP can recover overpayments from people – this means not all of the £8.4bn is lost, and we can describe a net loss figure which deducts recoveries from total overpayments. In FYE 2021, we recovered £0.8bn of overpayments (£0.5bn Housing Benefit and £0.3bn other DWP benefits). This was a slight fall from £1.0bn in FYE 2020, and was due in part to debt recovery being paused for three months from April 2020, so that Debt Management staff could support processing of the substantial rise in new Universal Credit claims, following the outbreak of coronavirus.
Note that some recoveries made by DWP are not included in our net loss estimate as they do not relate to our fraud and error reporting (mainly recoveries of tax credits and of benefit advances).
The net rate of loss from overpayments in FYE 2021 was 3.6%, or £7.6bn. This has increased from the FYE 2020 rate of 1.9% (£3.6bn).
5. Universal Credit overpayments and underpayments
UC overpayments increased significantly and underpayments also increased.
UC is a payment to help with living costs for people who are in work on a low income, or for those who are out of work. Eligibility for UC depends on individual circumstances and location.
Advances for UC are not part of the benefit payment itself. We therefore do not review fraud and error on UC advances. For more information see section 3 of the Background Information and Methodology note.
UC Expenditure
The expenditure on UC has increased from £18.4bn in FYE 2020 to £38.2bn in FYE 2021. This means that the monetary values of fraud and error cannot be directly compared year on year.
Coronavirus (COVID-19) pandemic impacts on UC
This year covers a period impacted by the coronavirus pandemic, which has affected UC in many ways:
- the volume of claims has increased, heavily contributing to the rise in expenditure
- the makeup of the caseload has changed, potentially impacting fraud and error due to increased requirement for support for particular claimant groups, for example self-employed claimants
- easements were applied to UC claims processing, meaning some verification was not asked for. This affected the likelihood of errors occurring for reasons related to the easements, for example Housing Costs
- the Minimum Income Floor (MIF) is an assumed level of earnings used in the monthly UC payment calculation. It affects UC claimants whose main source of income is from self-employment. The MIF has been temporarily suspended to help UC claimants during the pandemic. We estimate that the overpayment rate could have been between 13.0% and 13.8% had the MIF been in place
The estimate of the rate of overpayments on UC in FYE 2021 was 14.5%, a statistically significant increase from 9.4% in FYE 2020.
However, the proportion of UC cases with overpayments increased only slightly from 23 in 100 cases in FYE 2020 to 24 in 100 cases in FYE 2021. The increase in expenditure overpaid was primarily due to there being higher value errors on the incorrect cases and incorrect cases having a higher number of errors, rather than a higher proportion of cases being incorrect.
The increase in the UC overpayment rates has been driven by an increase of 5.2 percentage points in Fraud
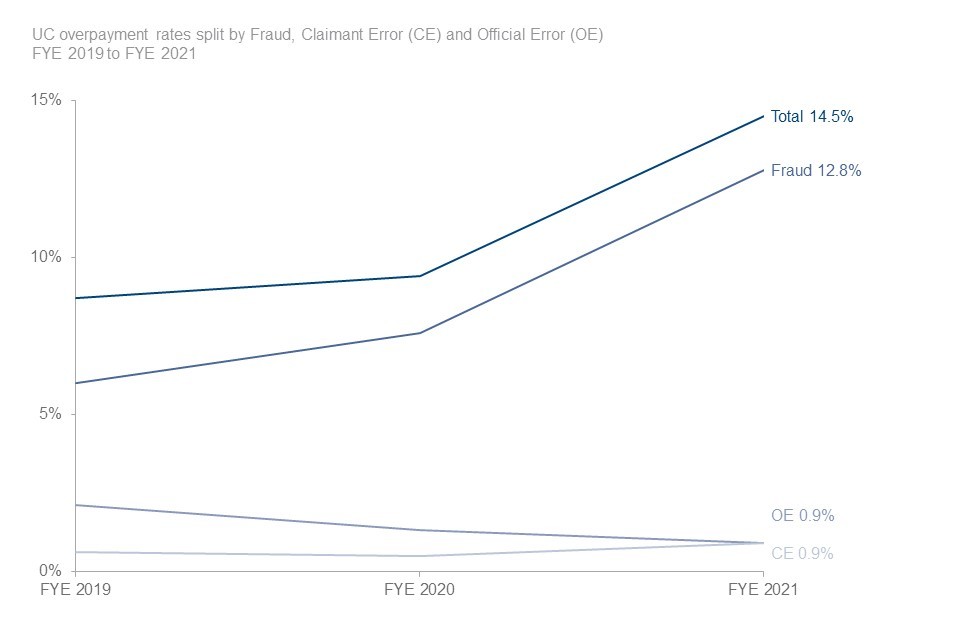
The change largely resulted from a statistically significant increase in the Fraud overpayment rate, which rose from 7.6% to 12.8%
Although there was a large increase in the overpayment rate, the proportion of UC cases with Fraud overpayments was unchanged, at 17 in 100 cases. The increase in the Fraud overpayment rate was due to a combination of higher error values and a larger number of errors on the incorrect cases.
The increase in the UC Fraud overpayment rate was underpinned by increases in the following error reasons:
- Earnings/Employment
- Capital
- Living Together
- Housing Costs
These remained the four largest known error reasons since FYE 2020 and accounted for over three quarters of expenditure overpaid as Fraud on UC. Earnings/Employment had the largest increase.
Please note we have made a change to how we categorise error reasons, with the addition of category ‘failure to provide evidence/fully engage in the process’. Although this does not change total amounts of fraud and error, it does affect the underlying allocation of reasons why fraud and error occurred. This change has also been applied to data held in supplementary tables for FYE 2020 to allow comparison. For more information, see methodology changes section below and the Background Information and Methodology note.
The rise in the Fraud overpayment rate is primarily due to a 2.5 percentage point increase in Earnings/Employment
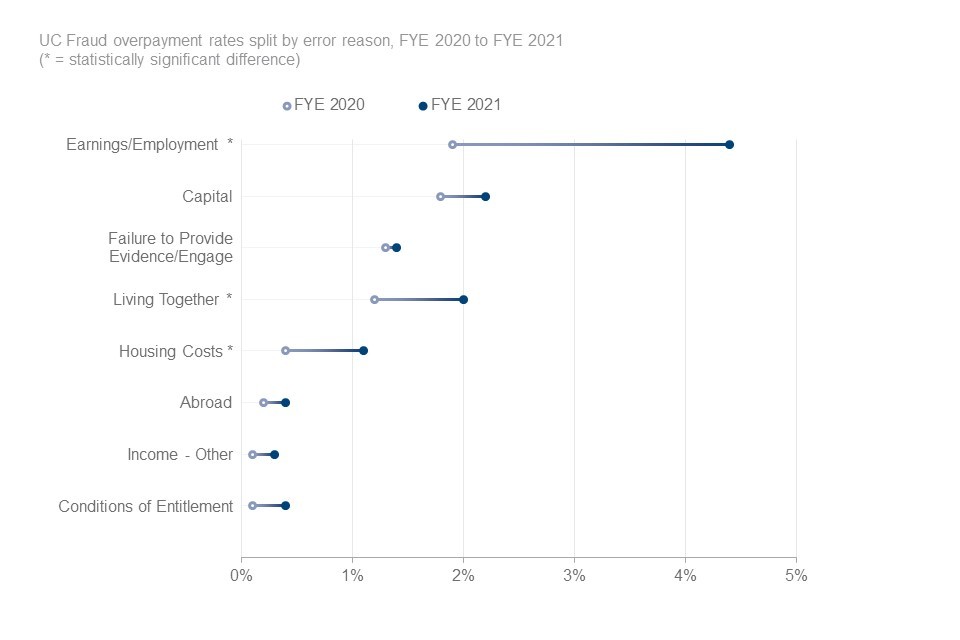
The Earnings/Employment Fraud overpayment rate had a statistically significant increase of 2.5 percentage points, from 1.9% to 4.4%
This was due to a statistically significant increase in the Self Employed Earnings Fraud overpayment rate from 0.9% to 3.6%. This was partly due to a change in caseload composition, as the proportion of self-employed claimants more than doubled from FYE 2020 to FYE 2021. Over three quarters of Self Employed Earnings Fraud overpayments related to claims starting on or after the coronavirus pandemic onset (16th March 2021 was used as the pandemic onset date).
Capital remained the second largest reason for Fraud overpayments, increasing from 1.8% to 2.2%. However, this was not a statistically significant increase.
Living Together was the third largest reason for UC Fraud, with a statistically significant increase of 0.8 percentage points from 1.2% in FYE 2020 to 2.0% in FYE 2021.
Housing Cost Fraud rates more than doubled, with a statistically significant increase from 0.4% to 1.1%. Part of this increase related to coronavirus verification easements (Trust and Protect), associated with over one quarter of Housing Costs Fraud errors. More information on easements can be found in the Background Information and Methodology note.
Claimant Error overpayments increased from 0.5% to 0.9%
This was not a statistically significant difference. This was due to a statistically significant increases in Self Employed Earnings (within category Earnings/Employment) and Capital.
Official Error overpayments decreased from 1.3% to 0.9%
This was not a statistically significant difference. This decrease was linked to Housing Costs, which had a statistically significant decrease from 0.4% to 0.1%.
For Claimant Error we saw a statistically significant increase in the proportion of cases with a Claimant Error overpayment (from 5 in 100 cases in FYE 2020, to 6 in 100 cases in FYE 2021).
For Official Error we saw a statistically significant decrease in the proportion of cases with an Official Error overpayment (from 4 cases in 100 in FYE 2020, to 2 in 100 cases in FYE 2021).
The decrease in Official Error, could be due to verification easements. Through Trust and Protect, the onus moves to the claimant rather than the department, potentially resulting in more claimant errors and a lower likelihood of official errors.
The estimate of the rate of underpayments on UC in FYE 2021 was 1.4%, an increase from 1.1% in FYE 2020
This was not statistically significant. The proportion of cases with an underpayment has increased alongside the rate of error; from 7 in 100 cases in FYE 2020, to 12 in 100 cases in FYE 2021, a statistically significant difference.
The increase in the UC underpayment rate has been driven by an increase of 0.5 percentage points in Claimant Error (CE)
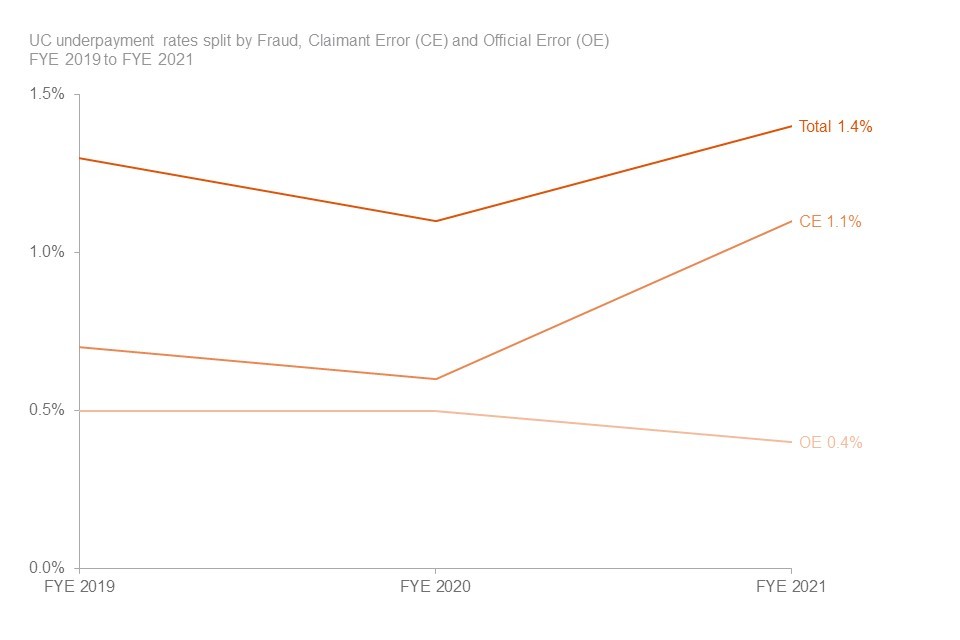
The UC underpayment rate has increased due to a statistically significant rise in Claimant Error. The Claimant Error underpayment rate increased from 0.6% to 1.1% in FYE 2021, which is the highest measured level on UC.
The increase in the Claimant Error underpayment rate is mainly due to a 0.3 percentage point increase in Housing Costs
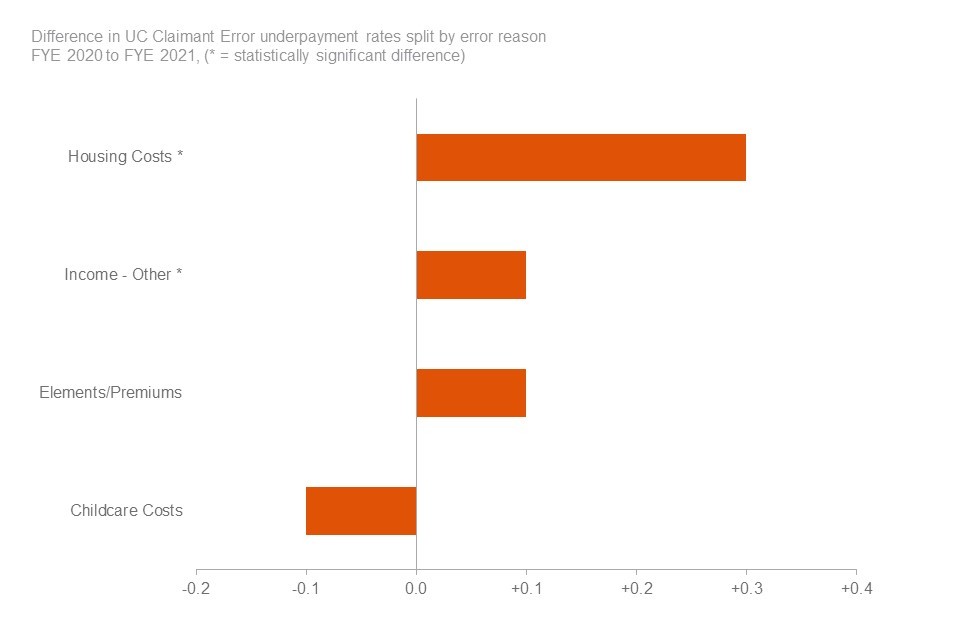
Housing Costs errors underpinned the rise in the Claimant Error underpayment rate and remained the largest Claimant Error reason in FYE 2021. It had a statistically significant increase from 0.2% to 0.5%, an increase of 0.3 percentage points. This error reason has increased due to a greater number of claimants not declaring their Housing Costs correctly. Income - Other also had a statistically significant increase of 0.1 percentage points, from 0.0% to 0.1%.
The remaining increase in the Claimant Error underpayment rate was due to small changes across a number of error reasons. This included a statistically significant increase in Earnings/Employment as a result of an increase in Self Employed Earnings. However, the associated monetary values are small and round down to 0.0% of expenditure underpaid.
Official Error underpayments decreased from 0.5% to 0.4%
This was not a statistically significant difference.
Housing Costs was the largest source of Official Error underpayments. This remains unchanged at 0.2%.
Underpayments categorised as Other have had a statistically significant decrease of 0.1 percentage points, from 0.1% to 0.0%.
Similar to overpayments, for underpayments there has also been a statistically significant rise in the proportion of cases with a Claimant Error (from 5 in 100 cases in FYE 2020, to 11 in 100 cases in FYE 2021), and a statistically significant decrease in the proportion of cases with an Official Error (from 3 in 100 cases in FYE 2020, to 2 in 100 cases in FYE 2021).
Again, this shift in Claimant Error and Official Error rates could be due to verification easements. Through Trust and Protect, the onus moves to the claimant rather than the department, potentially resulting in more claimant errors and a lower likelihood of official errors.
6. State Pension
State Pension is the benefit with the highest expenditure. In FYE 2021, State Pension expenditure was £101.2bn, a little under half of total benefit expenditure.
Official Error on State Pension is measured every year, but Fraud and Claimant Error were last measured in FYE 2006. This means that the rate of Official Error in FYE 2021 is based on reviews undertaken in FYE 2021, while the rates of Fraud and Claimant Error have been rolled forward since FYE 2006. A full review of State Pension is being undertaken in FYE 2022, where Fraud, Claimant Error, and Official Error will all be measured.
The total overpayment rate for State Pension in FYE 2021 was 0.1%, the same as FYE 2020. The monetary amount overpaid was £90m.
The Official Error overpayment rate remained at 0.0% (monetary amount £20m).
The total underpayment rate for State Pension in FYE 2021 was 0.3%, the joint highest recorded rate since FYE 2006.
The monetary amount underpaid was £310m. The increase from 0.2% in FYE 2020 was not statistically significant.
All underpayments were for Official Errors.
Note: There have been some changes to how we calculate the State Pension estimates this year. For more information see section 2 of the Background Information and Methodology note.
7. About these statistics
All the information underlying the charts and figures featured in this document is included in the accompanying reference tables.
The tables show the rates and monetary values of overpayments and underpayments for each benefit, split by Fraud, Claimant Error and Official Error. The tables also show the net loss of overpayments measure with a time series and a breakdown by benefit.
For the benefits we have measured this year, we can also show more detail about the cause of the error (for example, incomes, savings and who lives in the house) and the demographics of the claimants. We also estimate the percentage of cases that are incorrect, and the amount of money that is incorrectly paid.
The Background Information and Methodology note provides further information on how we calculate ‘Fraud and Error in the Benefit System’ statistics and gives a glossary of the causes of fraud and error used in this document and the reference tables. It also contains further details on any methodological changes which have been introduced.
The Background Information and Methodology note gives more detail about the data manipulation process.
Interactive information and charts illustrating the fraud and error data are available.
We will continue to review our publication content, and welcome user comments, which should be sent to caxtonhouse.femaenquiries@dwp.gov.uk.
National Statistics status
National Statistics status means that our statistics meet the highest standards of trustworthiness, quality and public value, and it is our responsibility to maintain compliance with these standards.
The continued designation of these statistics as National Statistics was confirmed in December 2017 following a compliance check by the Office for Statistics Regulation. The statistics last underwent a full assessment against the Code of Practice for Statistics in February 2012. Since the latest review by the Office for Statistics Regulation, we have continued to comply with the Code of Practice for Statistics, and have made the following improvements:
- we conducted a user consultation on the frequency of the publication, the benefits measured and on the breakdowns used within the publication. This has resulted in us changing from a bi-annual to an annual publication, and beginning to measure fraud on error on benefits that have not been measured at all or for a long time
- we have made some methodological changes, resulting in better understood methodologies and assumptions, improved accuracy of the fraud and error statistics, and more consistency across benefits
- we have made a number of changes to improve the relevance and accessibility of our statistics. For example, we have: moved away from using the same wording and charts for all the benefits in our publication to instead focus on the key messages for each benefit, updated the categories of error we report in our publication based on user needs, and made the data from our publication available to analysts within DWP to conduct their own analysis. We have also created an online tool to allow users to explore our fraud and error statistics
- we have produced the documents in HTML format and provided an accessible version of the reference tables
Other National and Official Statistics
Details of other National and Official Statistics produced by the Department for Work and Pensions can be found on the DWP website via the following links:
- a list of DWP statistical summaries
- a schedule of statistical releases over the next 12 months and a list of the most recent releases
- in addition, users can find links to additional DWP statistical analyses that have not been included in our standard publications
If you would like to receive occasional e-mails from DWP to directly inform you of documents seeking the views of users, please email general.statistics@dwp.gov.uk giving details of the DWP publications you use.
8. Contact information
Lead Statistician: Louise Blake
Comment? Feedback is welcome at caxtonhouse.femaenquiries@dwp.gov.uk
DWP Press Office: 020 3267 5144
Report Benefit Fraud: 0800 854 4400
Appendix 1: Overpayment rates and monetary values by benefit
| Benefit | Expenditure (£m) | Total (Rate %) | Total (Value £m) | Fraud (Rate %) | Fraud (Value £m) | Claimant Error (Rate %) | Claimant Error (Value %) | Official Error (Rate %) | Official Error (Value £m) | Last measured |
|---|---|---|---|---|---|---|---|---|---|---|
| Universal Credit | 38,200 | 14.5 | 5,540 | 12.8 | 4,880 | 0.9 | 330 | 0.9 | 330 | Jul 20 - Nov 20 |
| Housing Benefit | 17,300 | 6.0 | 1,030 | 3.7 | 650 | 1.7 | 300 | 0.5 | 90 | Oct 18 - Sep 19 |
| ESA | 13,400 | 4.1 | 550 | 1.9 | 250 | 1.2 | 160 | 1.1 | 150 | Oct 18 - Sep 19 |
| PIP | 13,600 | 1.5 | 210 | 0.3 | 40 | 1.1 | 150 | 0.1 | 20 | Aug 18 - Jul 19 |
| Pension Credit | 5,100 | 5.3 | 270 | 2.5 | 130 | 1.6 | 80 | 1.2 | 60 | Oct 18 - Sep 19 |
| Carer’s Allowance | 3,100 | 5.2 | 160 | 3.0 | 90 | 2.0 | 60 | 0.1 | 0 | May 19 - Dec 19 |
| JSA | 1,000 | 4.6 | 50 | 3.1 | 30 | 0.3 | 0 | 1.2 | 10 | Oct 17 - Sep 18 |
| Income Support | 1,100 | 3.9 | 40 | 2.4 | 30 | 1.0 | 10 | 0.4 | 0 | Oct 13 - Sep 14 |
| Incapacity Benefit | 0 | 2.4 | 0 | 0.3 | 0 | 0.9 | 0 | 1.2 | 0 | Oct 09 - Sep 10 |
| DLA | 5,800 | 1.9 | 110 | 0.5 | 30 | 0.6 | 40 | 0.8 | 40 | Apr 04 - Mar 05 |
| State Pension | 101,200 | 0.1 | 90 | 0.0 | 0 | 0.1 | 70 | 0.0 | 20 | Apr 05 - Mar 06 |
| Interdependencies | 50 | 10 | 20 | 20 | ||||||
| Never reviewed | 12,100 | 2.2 | 270 | 1.2 | 140 | 0.5 | 60 | 0.5 | 60 | |
| Total | 211,700 | 3.9 | 8,400 | 3.0 | 6,300 | 0.6 | 1,300 | 0.4 | 800 | |
| Range | (3.6, 4.3) | (7,700, 9,200) | (2.7, 3.3) | (5,700, 7,000) | (0.5, 0.8) | (1,000, 1,600) | (0.3, 0.5) | (600, 1,000) |
Notes:
- Certain cases are removed from the headline overpayments estimates for DLA and PIP estimates. Based on FYE 2021 expenditure the DLA figure is now estimated to be £420m (£310m, £550m). The amount of PIP excluded is estimated to be £460m (£350m, £560m) for FYE 2021.
- Monetary values associated with Incapacity Benefit are displaying zeroes due to rounding.
- Official Error estimates for State Pension (SP) are derived from a review exercise which covered the period October 2019 to September 2020 (with a break May to July 2020). SP Fraud and Claimant Error estimates have been produced based on a National Benefit Review exercise carried out in FYE 2006, applied to the latest FYE 2021 expenditure.
- The ‘Never reviewed’ category includes benefits which were not previously reviewed and have not been historically reviewed in a particular year.
- Rows and columns may not sum to totals due to rounding.
- A number of cases are removed from the headline overpayment estimates. This is due to a review not being completed and categorised as ‘Inconclusive’. These cases are estimated to have a monetary value of £530 million. See Appendix 4 for more information.
- Approximate 95% confidence interval ranges are given for the totals in the row below them. These also allow for non-sample error in occasionally reviewed benefits and the additional uncertainty that comes from the use of older measurement periods.
- ESA is Employment and Support Allowance, JSA is Jobseeker’s Allowance and DLA is Disability Living Allowance.
Appendix 2: Underpayment rates and monetary values by benefit
| Benefit | Expenditure (£m) | Total (Rate %) | Total (Value £m) | Fraud (Rate %) | Fraud (Value £m) | Claimant Error (Rate %) | Claimant Error (Value £m) | Official Error (Rate %) | Official Error (Value £m) | Last measured |
|---|---|---|---|---|---|---|---|---|---|---|
| Universal Credit | 38,200 | 1.4 | 540 | 0.0 | 0 | 1.1 | 400 | 0.4 | 140 | Jul 20 - Nov 20 |
| Housing Benefit | 17,300 | 1.7 | 300 | 0.0 | 0 | 1.3 | 220 | 0.4 | 80 | Oct 18 - Sep 19 |
| ESA | 13,400 | 2.8 | 370 | 0.0 | 0 | 1.2 | 160 | 1.6 | 210 | Oct 18 - Sep 19 |
| PIP | 13,600 | 3.8 | 510 | 0.0 | 0 | 3.1 | 420 | 0.7 | 90 | Aug 18 - Jul 19 |
| Pension Credit | 5,100 | 2.2 | 110 | 0.0 | 0 | 1.2 | 60 | 1.1 | 50 | Oct 18 - Sep 19 |
| Carer’s Allowance | 3,100 | 0.0 | 0 | 0.0 | 0 | 0.0 | 0 | 0.0 | 0 | May 19 - Dec 19 |
| JSA | 1,000 | 1.5 | 20 | 0.1 | 0 | 0.3 | 0 | 1.2 | 10 | Oct 17 - Sep 18 |
| Income Support | 1,100 | 0.8 | 10 | 0.1 | 0 | 0.4 | 0 | 0.3 | 0 | Oct 13 - Sep 14 |
| Incapacity Benefit | 0 | 0.7 | 0 | 0.0 | 0 | 0.0 | 0 | 0.7 | 0 | Oct 09 - Sep 10 |
| DLA | 5,800 | 2.5 | 150 | 0.0 | 0 | 2.4 | 140 | 0.1 | 10 | Apr 04 - Mar 05 |
| State Pension | 101,200 | 0.3 | 310 | 0.0 | 0 | 0.0 | 0 | 0.3 | 310 | Apr 05 - Mar 06 |
| Never reviewed | 12,100 | 1.7 | 210 | 0.0 | 0 | 1.4 | 170 | 0.3 | 40 | |
| Total | 211,700 | 1.2 | 2,500 | 0.0 | 0 | 0.7 | 1,600 | 0.4 | 900 | |
| Range | (1.0, 1.5) | (2,100, 3,100) | (0.0, 0.0) | (0, 0) | (0.6, 1.0) | (1,300, 2,100) | (0.3, 0.6) | (700, 1,200) |
Notes:
- A small number of Fraud underpayments are included in the total column, but are not shown in a separate column in the table above. Fraud underpayments can be recorded on Living Together cases, where the claimant commits Fraud because they do not tell DWP that their partner has moved in with them. Although this causes an underpayment for the individual, the circumstances of the partner (for example, their income) cause overpayments for the claim as a whole, which results in an overall overpayment.
- A new legislation ruling for PIP means that some claimants may qualify for higher benefit awards than they were given at their assessment. Cases categorised since August 2018 will include this judgement which means that prior to this date we may be underestimating Official Error underpayments.
- Carer’s Allowance estimates are zero as no underpayment cases were found in the sample.
- Monetary values associated with Incapacity Benefit are displaying zeroes due to rounding.
- Official Error estimates for State Pension (SP) are derived from a review exercise which covered the period October 2019 to September 2020 (with a break May to July 2020). SP Fraud and Claimant Error estimates have been produced based on a National Benefit Review exercise carried out in FYE 2006, applied to the latest FYE 2021 expenditure.
- The ‘Never reviewed’ category includes benefits which were not previously reviewed and have not been historically reviewed in a particular year.
- Rows and columns may not sum to totals due to rounding.
- Approximate 95% confidence interval ranges are given for the totals in the row below them. These also allow for non-sample error in occasionally reviewed benefits and the additional uncertainty that comes from the use of older measurement periods.
- ESA is Employment and Support Allowance, JSA is Jobseeker’s Allowance and DLA is Disability Living Allowance.
Appendix 3: Operational easements and changes due to the coronavirus pandemic
A number of operational easements and changes to benefit administration were introduced as a consequence of the coronavirus pandemic. Some of these changes were necessary to comply with public health restrictions, and others were introduced to meet departmental aims to protect vulnerable customers and ensure benefit claim processing was as timely as possible.
Many easements related to verification of evidence required to complete a benefit claim. Examples include verification of identity, of household circumstances, and of tenancy agreements.
These verification easements impact all means-tested benefits not measured this year (which is all benefits except Universal Credit and State Pension – please see the Coronavirus pandemic impacts section above for details on why benefits weren’t measured). There have also been some benefit specific easements and changes for certain benefits.
When we don’t review a given benefit in a year, we would normally roll forward the rate of fraud and error from when it was previously measured, or apply a proxy rate if that benefit has never been measured. This year we have needed to assess whether it is valid to do this, or whether we needed to make an adjustment due to potential impacts of benefit easements related to the coronavirus. More information can be found in the Background Information and Methodology note.
This appendix sets out our assessment of the impact of benefit easements and changes as a result of the coronavirus pandemic, and our rationale for rolling forward rates on all benefits not measured this year. More detailed information on our methodology can be found in the Background Information and Methodology note.
Personal Independence Payment (PIP)
There was a specific change made as a direct result of the coronavirus pandemic with regard to when PIP claims in payment are reviewed. Some PIP claims are subject to reviews through an ‘Award Review’ (AR), and the change resulted in claims that were due an AR from April 2020 having their AR paused for four months.
We therefore investigated the potential impact on fraud and error of this easement, by taking the extension to ARs into consideration. This was estimated using existing published data on PIP, using numbers of ARs delayed, the length of the pause, and likely changes in the rate of benefit received after the AR.
PIP was not subject to easements to verification as it is not a means-tested benefit where claimants must demonstrate that their income and capital are below a certain level.
PIP Overpayments
The initial estimate of a potential additional overpayment was £150m. However, our normal methodology for estimating overpayments on PIP removes a large proportion of overpayments from our main estimate due to some claimants not being reasonably expected to know to report an improvement in their functional needs (Not RETK). In FYE 2020 we reported PIP overpayments of £190m and removed £420m due to Not RETK. (More information on Not RETK can be found in the Background Information and Methodology note).
We would therefore assume that a large proportion of the estimated £150m impact of easements should also be removed due to the ‘Not REKT’ adjustment. As the impact of easements relate to a specific group of cases that have had their AR delayed, rather than the PIP caseload as a whole, there is significant uncertainty around what proportion should be removed. Some scenarios are presented in the table below.
The impact on the ‘global’ (overall) estimate of fraud and error of including the estimated impact, after rolling forward the FYE 2020 rate, would be minimal. The table below shows the impact on the global estimate of including the entire £150m and of removing different proportions due to Not RETK. All impacts are below 0.1 percentage points (pp.).
The potential impact on the PIP overpayment rate itself is larger. Impacts are shown in the table below. However, inclusion of the estimated impact would not increase the overpayment rate to above those seen in any previous year in which we have measured PIP for fraud and error (between FYE 2017 and FYE 2019).
Another factor affecting the estimates is the outcomes of Mandatory Reconsiderations and appeals. Claimants may ask for the AR outcome to be reviewed (a Mandatory Reconsideration), and they may also appeal the outcome of that. There is no published data on the rates of these in relation to outcomes of ARs, although for PIP initial assessment decisions in FYE 2020 (new claims and DLA to PIP reassessments), more than 10% of all cases had their award changed after either a Mandatory Reconsideration or an appeal. Were it possible to incorporate an adjustment to account for this, then the estimates in the table below would be lower.
Possible impact of Not RETK adjustment and impact on the PIP overpayment rate estimate and global overpayment rate estimate
| Proportion removed due to Not RETK | Estimated additional overpayment | Impact on PIP overpayment estimate | Impact on Global overpayment estimate |
|---|---|---|---|
| None (0%) | £150m | + 1.1 p.p | + 0.07 p.p |
| Half (50%) - average proportion of previous measurements | £80m | + 0.6 p.p | + 0.04 p.p |
| Same as FYE 2020 (69%) | £50m | + 0.4 p.p | + 0.02 p.p |
PIP Underpayments
We estimated a potential additional underpayment of £50m. (Note that underpayments are not subject to the RETK rule).
This estimate is within the reported confidence intervals for our main fraud and error estimate. Due to this, we can conclude that the impacts are small and do not require adjustments to our estimate. To put this figure into wider context, last year we reported total underpayments on PIP of £470m.
Note that claimants who had their review paused could have notified DWP of a Change of Circumstances during the period of the pause. For those claimants, there would be no underpayments or overpayments.
Conclusion
Given the significant uncertainty around the additional overpayment estimate, the low impact on the global estimate, and that the additional underpayment estimate is within our confidence interval, we have not adjusted the PIP fraud and error estimates or added an adjustment to the global estimates for FYE 2021.
Verification easements
We carried out sensitivity analysis on the following benefits:
- Housing Benefit, Employment and Support Allowance, Pension Credit and Carer’s Allowance – all measured last year (FYE 2020)
- Jobseekers’ Allowance – measured in FYE 2019
- Attendance Allowance and Bereavement Benefits – never measured; instead a ‘proxy’ rate is published based on other benefits
The analysis used the onflows to benefits, the last measured incorrectness rate of that benefit, and the average monetary amount of Fraud/Error found when the benefit was last measured, to estimate a range in which the additional fraud and error due to easements lies. Onflows were used because easements on these benefits largely affected verification of identity at the start of a claim, rather than change of circumstances during a claim. (Note: ‘Incorrectness’ means the proportion of cases with an overpayment or underpayment, regardless of the number of errors on a case or the values of the errors).
Verification easements - Overpayments
The estimated ranges for additional overpayments due to verification-related easements in FYE 2021 for each benefit are shown below:
Estimated range of additional overpayments
| Benefit | Range of additional overpayments (£m) |
|---|---|
| Housing Benefit (working age) | 0 – 42 |
| Housing Benefit (pension age) | 0 – 13 |
| Jobseekers’ Allowance | 0 – 16 |
| Carer’s Allowance | 0 – 13 |
| Employment and Support Allowance | 0 – 6 |
| Pension Credit | 0 – 8 |
| Attendance Allowance | 0 – 2 |
| Bereavement Benefits | 0 – 3 |
The lowest possible additional overpayment shown in the table above is zero. This is based on the assumption that the proportion of onflows to the benefits with fraud or error is the same as the rate seen in FYE 2020, which is being rolled forward. We then estimated a maximum impact of the easements, using the assumption that the proportion of onflows with fraud or error had doubled for each benefit since FYE 2020.
The overpayment ranges for each benefit are within the reported confidence intervals for our main fraud and error estimates. Due to this, we can conclude that the easement impacts are small and do not require adjustments to our estimates. For example, the maximum total estimated additional overpayments for Housing Benefit is £55m. Our central estimate of the total overpayments on Housing Benefit for FYE 2020 is £1,090m. The 95% confidence interval around this shows that the figure is likely to lie between £1,000m and £1,180m. We would only adjust our figures if the additional fraud and error estimate took overpayments higher than £1,180m.
In addition, analysis showed that of the total expenditure across these benefits for FYE 2021 (£46bn), the maximum total estimated additional overpayments due to verification-related easements are equivalent to 0.2% of expenditure. This estimate uses the top value for each benefit estimate range. Therefore, given the minimal impact, we are not adjusting our global estimate of fraud and error for FYE 2021.
Conclusion
We believe that any additional fraud and error introduced as a direct result of verification-related easements to be low. As a result, we have not made any adjustments to our reported fraud and error levels to account for them.
HB SEISS Payments
If you are self-employed and have been impacted by coronavirus you can apply for a Self-Employment Income Support Scheme (SEISS) grant. The scheme was started in April 2020 and eligible claimants could have applied for one of these grants every quarter in the last financial year. These grants are calculated to be a top up of the impacted person’s 3-month average trading profits. More information can be found in the SEISS guidance.
For the purpose of benefits and HB in particular, these grants are treated the same as any earned Self Employed Income. For HB, the amount of Self Employed income used to calculate a claimant’s benefit is usually based on their previous year’s tax return. However, if the claimant has a significant change in income this should be reported to the Local Authority (who administer HB) and their HB recalculated. We have assumed that any impact from SEISS payments to HB is small. This is due to:
- the pandemic and in particular national/regional lockdowns. Self Employed people are likely to have had a decrease in their earnings this year. The SEISS payments would have then taken them more in line with income from their previous year’s tax return, and therefore any overpayment/underpayment would be small
- the uncertainty around what constitutes a significant change in income, and therefore which SEISS payment(s) should have been reported and HB entitlement recalculated (leading to an overpayment/underpayment)
We have therefore decided to not adjust the rolled forward HB rates for the impact SEISS would have.
Appendix 4: Cannot Review adjustment
For more information on this adjustment, please see section 5 of the Background Information and Methodology note.
The primary reason for an ineffective review is the claimant not engaging in a review, resulting in their benefit claim being suspended and then later terminated. Additionally, it includes cases where the claimant withdrew their claim to benefit following notification of a review. The estimate of the monetary value of fraud and error on these cases was around £1370m (1.5% of expenditure).
These cases are referred to as ‘Cannot Review’ and the department holds very little evidence of their current circumstances and their reasons for failing to engage.
Given the lack of evidence available for these cases, a set of assumptions are applied to categorise them for reporting purposes as follows:
- Fraud – where a case has a suspicion of Fraud raised following initial data gathering prior to review, these cases are assumed to be Fraud in the reported estimates
- Not Fraud – If there is no information to suggest a suspicion of Fraud, where a claimant reclaims benefit at a similar rate within four months of their original award being terminated, these cases are assumed not to be Fraud. Any other errors such as Official Error would remain on the case, so they may not be entirely benefit correct
- Inconclusive – where there is no information to suggest a suspicion of Fraud or that the claimant has reclaimed benefit, these are recorded as inconclusive and no assumptions are made on these cases. These cases are taken out of the headline reported estimates, since there is insufficient evidence to categorise as Fraud or not. The expenditure for these cases is estimated and reported separately within the publication and supplementary tables
Cannot Review cases accounted for around £1,370m of expenditure
Estimates of the breakdown of cases that did not have an effective review, split by benefit and assumption categorisation
| Benefit | Cannot Review Assumption Category | % of expenditure | Monetary Value |
|---|---|---|---|
| CA | Fraud | 0.8% | 20 |
| CA | Benefit Correct | 0.7% | 20 |
| CA | Inconclusive | 1.3% | 40 |
| ESA | Fraud | 0.4% | 50 |
| ESA | Benefit Correct | 0.1% | 20 |
| ESA | Inconclusive | 0.3% | 40 |
| HB | Fraud | 0.8% | 150 |
| HB | Benefit Correct | 0.2% | 40 |
| HB | Inconclusive | 0.4% | 80 |
| PC | Fraud | 0.7% | 30 |
| PC | Benefit Correct | 0.0% | 0 |
| PC | Inconclusive | 0.3% | 20 |
| PIP | Fraud | 0.0% | 0 |
| PIP | Benefit Correct | 0.0% | 0 |
| PIP | Inconclusive | 0.3% | 40 |
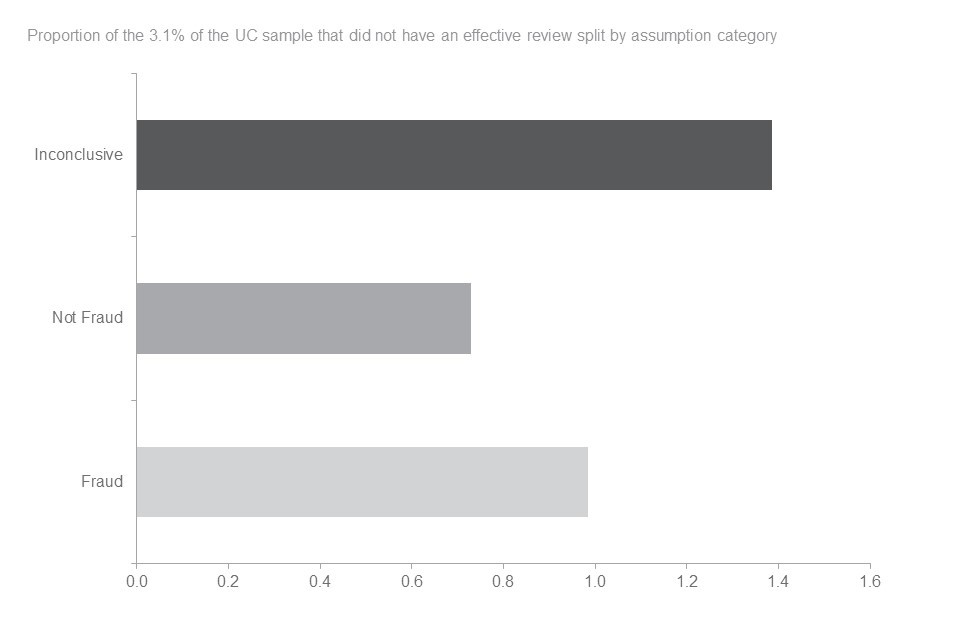
| UC | Fraud | 0.8% | 310 |
| UC | Benefit Correct | 0.5% | 190 |
| UC | Inconclusive | 0.8% | 320 |
| Total | Fraud | 0.6% | 570 |
| Total | Benefit Correct | 0.3% | 270 |
| Total | Inconclusive | 0.6% | 530 |
For all benefits apart from UC, the last measured Cannot Review rates were applied to expenditure for FYE 2021. UC rates were measured this year and accounted for £320m (0.8%) of expenditure.
Almost half of UC Cannot Review cases were categorised as inconclusive
ISBN: 978-1-78659-329-0